Effects of fungal (Lentinussajor-caju) treated oil palm frond on performance and carcass characteristics in finishing goats
Article information
Abstract
Objective
This experiment was conducted to investigate the effects of fungal treated oil palm fronds (FTOPF) on performance, carcass traits, meat quality, and muscle chemical composition.
Methods
Eighteen growing crossbred male goats (Thai Native×Anglo Nubian) with 18.7±2.0 kg of initial body weight (BW) were stratified and blocked by BW in a randomized complete block design. Three diets containing 30% of oil palm fronds (OPF) either untreated (UOPF) or treated with Lentinussajor-caju (FTOPF) with or without urea (FTOPFU) were used as roughage sources in total mixed rations (TMRs). The diets were offered ad libitum and weight gain was determined. At the end of the experimental period, the harvest data and carcass characteristics of the goats were recorded, and muscular longissimus dorsi composition was determined.
Results
No significant effect of fungal treated (FT) inclusion was observed in any of the feed intake, growth performance, and carcass characteristics. Likewise, no apparent effects on carcass composition and muscle chemical composition were detected in this study, except for hind leg and chump were affected (p<0.05) by FT inclusion.
Conclusion
In conclusion, feeding of fungal (Lentinussajor-caju) treated oil palm frond in TMR diet did not affect performance and carcass characteristics in finishing goats.
INTRODUCTION
Oil palm fronds (OPF), leaves and petioles from pruned branches during the harvesting of fresh fruit bunches for the production of oil, represent a major quantity of biomass from oil palm production and they are a potential source of energy for ruminant feed [1]. However, the use of OPF in livestock production is limited due to their complex biological structure, low nutritive values, high neutral detergent fiber (NDF, 70.0% dry matter [DM]), and lignin contents (20.5% DM); [2] which are the major constraints to use as livestock feed. As a result, OPF have a low energy value, varying between 4.9 and 5.6 MJ metabolisable energy (ME)/kg DM [1]. In order to break down the lignocellulosic bonds and to increase bioavailability of nutrients, various physical and chemical delignification methods have been examined in agricultural co-products such as rice and wheat straw [3]. Although these methods have advantages, they are costly, low in effectiveness, and not environmentally friendly. Colonization with white rot fungi (WRF) is considered to be a promising technique because of its preferential degradation of lignin [4]. In recent decades, biological de-lignification of straw by solid-state fermentation has been considered because of its capacity to remove lignin preferentially [4]. Currently, a few experiments have investigated the effects of feeding biologically treated OPF to ruminants including the utilization of fungal (Lentinussajor-caju) treated oil palm fronds (FTOPF). Therefore, the objective of this study was to determine the effects of feeding FTOPF, as a roughage source in total mixed ration (TMR) diet, on growth performance, carcass characteristics, and meat quality of finishing goats.
MATERIALS AND METHODS
The experiment was conducted at the Department of Animal Science, the Faculty of Natural Resources, Prince of Songkla University located in Songkhla Province, Thailand. This study lasted for 104 days with 14 days for animal adaptation to diets and daily management and 90 days for data collection. All procedures involving animals were approved by the Ethical Principles for the Use of Animals for Scientific Purposes of the National Research Council of Thailand (NRCT) for the metabolism study and finishing study.
Preparation of fungal treated oil palm fronds
A Lentinussajor-caju strain, provided by Biotechnology Research and Development Office, the Department of Agriculture, Thanyaburi, Pathum Thani Thailand, was used to inoculate the OPF. OPF were provided by the Faculty of Natural Resources, Prince of Songkla University, Hat Yai Campus, Songkhla, Thailand. The preparation of FTOPF were as follows in brief. Firstly, fresh OPF were chopped into 1 to 2 cm length and air dried at ambient temperature (30°C to 35°C). Then, chopped OPF were packed in plastic bags (30×45 cm), and autoclaved at 100°C to 102°C for 2 h and then cooled down to room temperature. The autoclaved OPF were inoculated with sorghum grain spawns of Lentinussajor-caju cultures at the rate of 4% w/w (fresh weight basis), and re-packed in plastic bags. The culture bags were transferred into the fermentation room and incubated at room temperature (28°C to 32°C) or full colonization of the mushroom mycelia on the substrate for 21 days. After 21 days of incubation, all bags were removed from the fermentation room and the OPF substrates were sun dried for 3 to 5 days. The air-dried spent OPFs were packed in plastic bags (45×90 cm) and stored at room temperature until feeding to the goats.
Animals, design and experimental diets
Eighteen growing crossbred male goats (Thai Native×Anglo Nubian) with 18.7±2.0 kg of initial body weight (BW) were stratified and blocked by BW in a randomized complete block design. All goats were randomly assigned within block to receive 1 of 3 treatments (6 goats/treatment), and were adapted to the experimental diets for 2wk before data collection period. Goats were housed individually in ventilated pens (1.0×1.0 m) with wooden slotted flooring in an open goat barn raised above the ground where water and mineral salt block were available at all times.
The three dietary treatments were as follows: untreated oil palm frond (UOPF; T1), fungal treated oil palm frond (FTOPF; T2), and fungal treated oil palm frond with urea 1% (FTOPFU; T3). Three experimental diets were formulated as roughage: concentrate ratio of 30:70. The roughage component of the diets included 30% of OPF either untreated (UOPF) or treated with Lentinussajor-caju (FTOPF) with or without urea (FTOPFU) (Table 1). The diets were formulated to provide the nutrient allowances to meet or exceed the [5] requirements of growing goats.
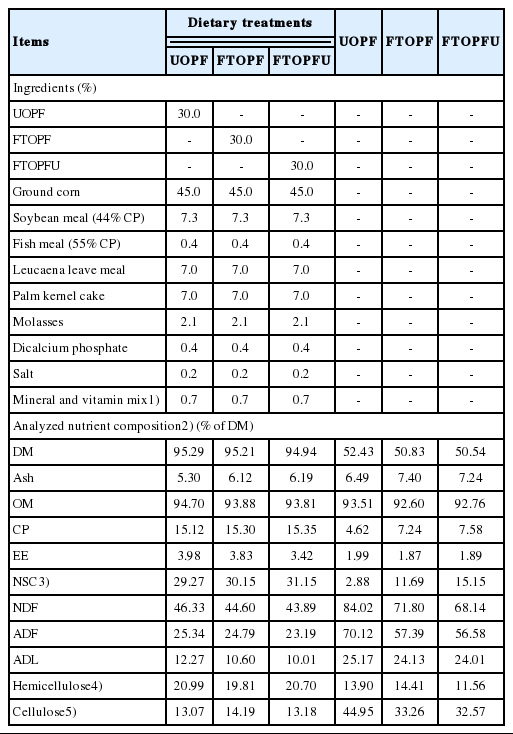
Ingredient proportion and chemical composition of the experimental diets, oil palm frond, and fungal treated oil palm frond (% DM basis)
All animals were fed diet ad libitum twice daily in two equal portions at 0800 and 1600 h for 90 days. The amount of TMR offered and refused were recorded daily from each goat and feed offering was adjusted to ensure approximately 10% of refusals after feeding, whereas during the last 7 days, the animals were moved to metabolism crates for total tract DM digestibility. Animals of this digestibility trial were fed the same experimental rations as used in the fattening experiment. Animals were fed separately in individual cages. Feed refusal was collected and analyzed for DM, and discarded to calculate dry matter intake (DMI), accurately. Feces were collected separately for each individual animal and sampled for analysis. In the digestibility trial, data on nutrient intakes and outputs were taken and coefficients of digestion of DM, organic matter (OM), and ash were calculated. Chemical analysis was conducted according to AOAC (1995). Individual feed ingredients were analyzed weekly for DM to adjust the diet composition for ingredient moisture content. Composite feed samples were collected weekly and dried in a forced-air oven at 60°C for 48 h for analysis of DM. Dried samples were ground to pass a 1-mm screen (Cyclotech Mill, Tecator, Box 70, S-263 21 Höganäs, Sweden) and then analyzed for DM, crude protein (CP), ether extract (EE), ash [6]. The method used for the evaluation of NDF and acid detergent fiber (ADF) were based on [7]. Lignin was obtained by treatment of ADF residue with 72% sulfuric acid [7]. Non-fibrous carbohydrate (% in the DM) was calculated as: 100–(CP+NDF+EE+ash).
Animal performance, slaughter and sample collection
All goats were weighed before the morning feeding at the beginning of the experiment and during the experiment every 2 weeks at the same time of day and before transportation to the abattoir of the Institute of Animal Science (final weight) thereafter. Daily DMI by each goat was estimated by summing the weekly intake and dividing by the number of days of the week. The average daily gain (ADG) was determined by dividing BW gain (initial full BW – final full BW) by the number of days in the study. Feed conversion was calculated as the ratio between ADG and DMI (g of BW gain/g of DMI).
At the end of the 90-d experiment, three blocks were randomly selected (which each block would compose of all treatments) for slaughter after being fasted overnight (live weight ~28 kg). Therefore the total number of goats for this carcass study was 9 (3 goats per treatment). The animals were slaughtered according to the standard slaughter procedures described in [8]. Fasted live and hot carcass weights were recorded before and immediately after slaughter, respectively. Directly after slaughter, non-carcass components (skin, head, feet, lung, heart, liver, spleen, kidneys, kidney fat, and gastro-intestinal tract fat) were removed and weighed. The stomach (rumen, reticulum, omasum, and abomasum) and postruminal tract (small intestine, large intestine, and caecum) were removed and weighed separately. The contents of the stomach and postruminal tract were removed, washed, and weighed to obtain the weight of the empty stomach and postruminal tract. The carcass yield percentage was calculated as 100 (hot carcass weight/slaughter weight). Carcasses were chilled overnight at 4°C and cold carcass weight was determined the next morning. Carcass length and width were measured. The carcasses were split longitudinally in two parts. The right sides of the carcasses were cut into eight pieces (loin, hind leg, chump, rack, should, fore leg, breast, and neck) according to [8] and were weighed, separately. Individual parts were then dissected into lean meat, bone, trimmings and weighed, separately. The muscular longissimus dorsi (LD) area was made on the left cut surface (of the chilled carcass) between rib 12 and 13. The LD (the section between the last lumbar and the first sacral vertebrae) were collected. These cuts of meat and two per animal were labeled and frozen immediately after collection for later measurement of the chemical composition, meat color, and shear force characteristics.
Laboratory analyses
Samples of LD muscle were subjected to proximate analysis following the standard methods of [6]. Muscle surface color was measured objectively using a Hunter Lab Miniscan Plus Spectrocolorimeter on the same cut surface the LD. Instrumental color measurements were recorded for L* (measures darkness to lightness; lower L* indicates a dark color), a* (measures redness; higher a* value indicates a redder color), and b* (measures yellowness; higher b* value indicates a yellower color) at 3 locations of exposed lean to obtain a representative reading. To determine shear force, samples were defrosted at room temperature until their internal temperature reached 2°C to 5°C. After weighing, samples were trimmed, and thin sections from the lateral and extremities were removed; 4 samples, parallel to the muscle fibers and having 1 cm of thickness and 5 cm of length were obtained, to measure the shear force in a texture analyzer (TA-XTPlus-Texture Analyzer, with a Warner-Bratzler Blade probe, Texture Expert Exponent-Stable Micro Systems software, Ltd in Godalming, Surrey, UK. SMS). For each sample, 6 shear force results were obtained.
Statistical analysis
All data were analyzed using SAS (Cary, NC, USA) software. The MIXED procedure was used to analyze the fixed effects of treatment and block on performance and carcass characteristics, with animal serving as the experimental unit. Orthogonal contrasts were used to determine the effect of UOPF vs the average of all diets containing FTOPF. Treatment means were statistically compared using Duncan’s multiple range test [9] to identify differences between means. Contrasts were considered significant when the p-value was ≤0.05, with a p-value of ≤0.10 considered as a tendency approaching significance.
RESULTS AND DISCUSSION
Chemical composition of feeds
The feed ingredients and chemical compositions of the experimental diets are presented in Table 1. All three TMR diets were formulated to contain similar nutrient compositions. In addition, FTOPF and FTOPFU had higher CP and lower NDF, ADF, and acid detergent lignin (ADL) as compared to UOPF. The UOPF contained 4.62% CP and high in OM (93.51%), NDF (84.02%), ADF (70.12), and ADL (25.17%) contents. CP content of UOPF obtained in this study was within the common range reported by previous findings [2]. Similar values for NDF and NDF of UOPF have been previously reported by [10]. The increasing of CP content of the FTOPF and FTOPFU compared to UOPF could be attributed to mycelia growth of the fungi which is high in protein [11]. The protein content of the mycelium was reported relatively high [11]; therefore, it was expected the treated OPF containing fungal mycelium had a higher concentration of CP. Similarly, [12,13] reported that CP concentration of wheat straw was improved by treatment of Pleurotus species. It is also possible that increasing of CP (per unit DM) is due to a DM loss as a consequence of fungal growth [12]. The lower NDF and ADF contents by fungal treatment might be an indication of cell wall breakdown due to Lentinussajor-caju. Generally, NDF and ADF (3 and 9 wks colonization) content of OPF decreased when colonized with WRF [14]. Similarly, the decreases in these fiber fraction levels were also reported by [15] for wheat straw colonized for 2–4 wks with Pleurotus ostreatus, madake bamboo colonized for 10 wks with Ceriporiopsis subvermispora [4] and OPF colonized for 3 to 9 wks with C. subvermispora (3 wks) and Lentinula edodes and Phlebia brevispora (9 wks) [14]. The above results thus suggested that fungal fermentation improved nutritive values of the straw by lowering its cell wall content as measured by its NDF, ADF, and ADL contents. It has been widely known that high ADF and/or lignin in a feed are related to its low digestibility [16], especially the large proportion of lignified cell walls with low fermentation rate and digestibility, leading to a low rate of disappearance through digestion or passage and limited feed intake. Structural modification of cell wall components due to the respective urea or fungal treatment appears to facilitate fiber degrading microbes in the rumen to degrade fibrous components more intensively and therefore increasing the digestibility of feed [17].
Intake and animal performance
The effects of inclusion of fungal treated of OPF on growth performance of finishing goats are presented in Table 2. Overall initial BW, final BW, and weight gain were not significantly affected (p>0.05) for all dietary treatments as compared between the experimental diets (fungal treated, FT) with the control diet. No significant differences attributable to dietary treatment were observed in DM, OM, CP, and NDF intakes, except for intake of ADF was significantly (p<0.05) lower in FTOPFU as compared with UOPF and tended to be lower in the FT fed groups (p = 0.03) likely because of numerically decreased intakes. The reasons for this phenomenon were not clear. The lower voluntary feed intake of the treated OPF diet (FTOPF and FTOPFU) might be due to reduced palatability of the diet compared with UOPF; this could be one explanation to the underlying phenomenon. Similarly, Kamra and Zadražil [18] revealed that majority of the fungal treated substrates are less palatable, which can easily be improved by either ensiling or mixing with more palatable feeds. Furthermore, no differences in DM feed intake could be due to the similar digestibility of DM found in this study (Table 2). Apparent digestibility of DM ranged from 0.639 to 0.730 kg/kg and was close to that reported by Chanjula et al [22] Conversely, Fazaeli et al [13] reported that inclusion of fungal treated straw up to 30% of the TMR in late lactating Holstein cows improved the nutrients digestibility and also noted an increase in fat corrected milk yield by 13% and daily average BW gain by 2.7 times. Similarly, Abdel-Azim et al [19] treated rice straw and corn stalks with Trichoderma viride, which improved their feeding value resulting in higher intake, N balance and growth rate in cross-bred lambs. The discrepancies between the results of the two studies may have been due to the fact that the roughage source in the present study was treated OPF, while the source of roughage in the experiment of Fazaeli et al [13] was fungal treated straw, which is characterized by low ADL contents.
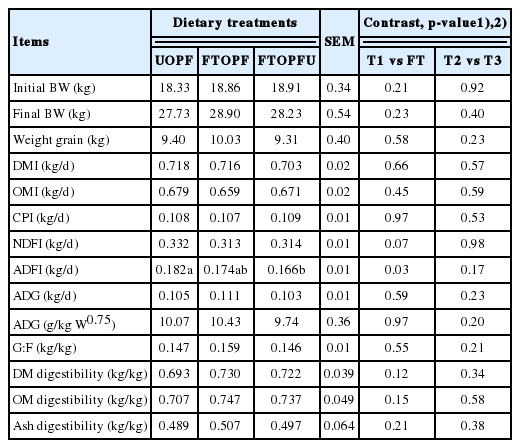
Effects of diet on performance and DMI of finishing goats
The inclusion of fungal treated of OPF did not significantly affect the ADG (0.106 kg/d) and feed efficiency of goats (0.151 kg/kg) in our study (Table 2). However, there was a tendency to increase ADG, and feed efficiency as animals were inclusion with FTOPF, when compared with other treatments. Similarly, Abdel-Azim et al [19] treated rice straw and corn stalks with Trichoderma viride, which improved growth rate in cross-bred lambs. In addition, Omer et al [20] had shown that biologically treated corn stalks (using Trichoderma ressi) can completely replace clover hay in the ration of growing sheep which was evident by a favorable increase in DM intake, and an improvement in the digestibility of all nutrients with higher ADG.
Carcass characteristics and meat quality
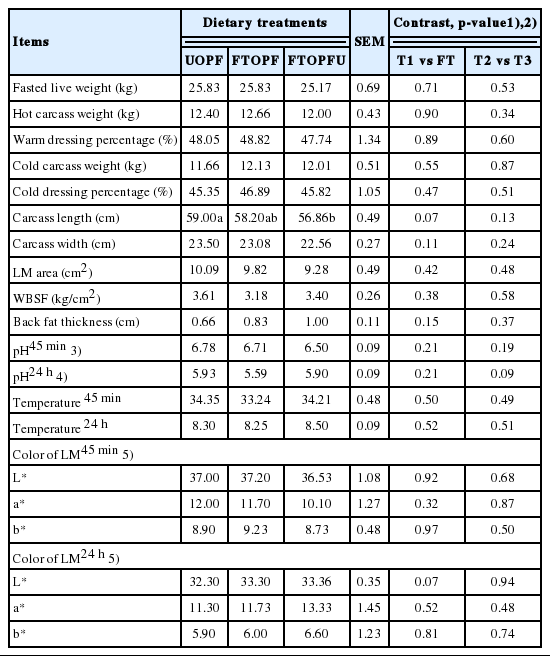
Carcass characteristics are presented in Table 3. No significant effect of inclusion with FT was observed on fasted live weight, hot carcass weight, cold carcass weight, and dressing percentage. Likewise, carcass length, carcass width, Longissimus muscle (LM) area, and Warner-Bratzler shear force (WBSF) were not affected by FT inclusion in the diets as compared with UOPF, except for carcass length being significantly (p<0.05) lower in FTOPFU as compared with UOPF and tended to be lower in the FT fed groups (p = 0.07) likely because of numerically decreased intakes. For the warm dressing percentage in this study was similar to the one reported for crossbred male (Thai Native×Anglo Nubian) goats [21] who reported that warm dressing percentage in the ranges of 48.9% to 50.3% of crossbred male (Thai Native×Anglo Nubian). However, the dress yield (DHY) reported in this study was lower than those other goat breeds slaughtered [22], which could be due to weight differences in DHY and which can be observed at heavier hot carcass weights, as reported by [23]. Likewise, the area, WBSF, pH, and temperature of LM were not affected by treatments. Nevertheless, the obtained WBSF results (<4.0 kg) ensure a tenderness that should result in high consumer acceptance [24]. Warner-Bratzler force values exceeding 5.5 kg would often be considered objectionably tough by both trained panel and consumers [25]. In addition, inclusion with FTOPF did not affect back fat thickness (0.8±0.1), 45 min pH (6.7±0.1) and 24 h pH (5.8±0.3), and also colorimetric parameters of LD (35.9±0.3, 11.2±0.8, and 8.9±0.02, for L*, a*, and b*, respectively) among treatments.
Effects of diet on slaughtered carcass characteristics of finishing goats
The pH 45 min and 24 h of LM muscle, within the range recorded in the studies reviewed by [26], was not affected by dietary treatments. The pH value of the muscle after slaughter is one of the most important factors that affect meat quality, because the pH can influence the tenderness, color and water retention capacity. In the first hours after slaughter there is the transformation of muscle in meat. This process involves the depletion of muscle glycogen stores with the production and accumulation of lactic acid. This process also triggers rigor mortis, which in sheep or goat carcasses occurs when the pH is between 5.6 and 5.8 for the LM. In this study, the pH of LM 45 min and 24 h after slaughter averaged 6.7 and 5.8. It can be inferred from these low values that no DFD meat (dry, firm, and dark muscle) was observed, as indicated by the high L* values found 45 min after slaughter, reflecting on high values of a* and b*. Color is an important meat quality trait because the first impression consumers have of any meat product is based on its color [27]. The average values observed in the current study for each of these variables were 36.5 to 37.2, 11.1 to 12.0, and 8.7 to 9.2, respectively for L*, a*, and b*. Similar value for color have been previously reported by Chanjula et al [22]; Adeyemi et al [28] who was observed in goats meat usually presents values from 30.6 to 39.9 for L*, 11.8 to 18.0 for a*, and 3.3 to 11.54 for b*. Postmortem ageing did not affect (p>0.05) the L*, a*, and b* values of LM muscle from goats. The lack of differences in carcass characteristics (Table 4) can be explained by the uniformity of the animals in the beginning of feedlot period and the similar laughter weight (average 25.6 kg). It shows that the inclusion of FT in by itself does not affect any of those characteristics.
Effects of diet on carcass composition of finishing goats
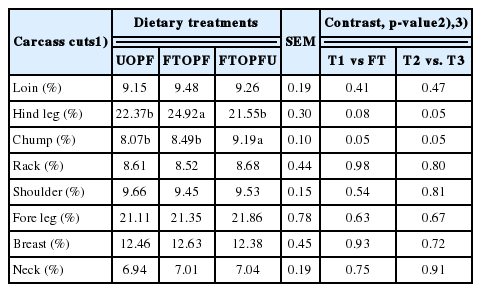
The effects of treatment diets on the carcass cuts of the goats are presented in Table 4. Percentage of the chilled carcass weight, loin, rack, shoulder, breast, fore leg, and neck were similar (p>0.05) for all treatments. However, hind leg and chump were affected by dietary treatment in goats that received FT treatment as compared with UOPF. It remains unclear whether this was due to the dietary treatment. Nevertheless, data from the current study demonstrate that feeding FT had no significant effect any of the goat growth performance and carcass. By design, no significant effect of treatment diets was observed on chemical composition of LD from goats (Table 5). The mean values of chemical composition of LM was within the range recorded in the studies by Beserra et al [29] who reported DM, ash, CP, and EE levels ranging 22.3 to 24.0, 20.5 to 21.9, 1.5 to 2.7, and 1.0 to 1.1, respectively. These observations could be attributed to the similar growth rate and slaughter weight of the goats. The results from current study showed that feeding fungal treatments had no effects on growth and carcass quality of goats; it remains unclear whether this was due to the dietary treatments. However, it could be due to all TMRs being formulated to be isonitrogenous at 15 of CP and isocaloric at 2.5 to 2.7 Mcal/kg DM to meet the NRC [5] requirement for goats. In addition, inclusion of 30% FTOPF in TMR ration might be a low level as roughage source, resulting in no differences between growth performance and carcass quality of goats.
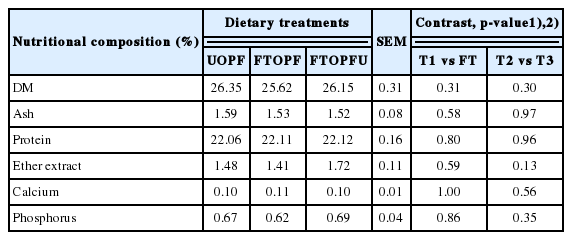
Effects of diet on chemical composition of Longissimus dorsi muscle of finishing goats
IMPLICATIONS
Based on the experimental data, treatment of FTOPF had no significant effect on any of feed intake, DM, OM, ash digestibility, the growth performance, carcass, and meat quality traits studies. However, these findings should be applied further in growing goat experiments in order to feed FTOPF ad libitum with concentrate supplementation.
ACKNOWLEDGMENTS
The authors would like to express our sincere thanks the Department of Animal Science, Faculty of Natural Resources, Prince of Songkla University (PSU), and the Research Grant from the National Research Council of Thailand (2016) for providing the financial support for the research and the use of the research facilities (Project no. NAT570154B and NAT570154C). This work was also supported by Increase Production Efficiency and Meat Quality of Native Beef and Buffalo Research Group, Khon Kaen University.
Notes
CONFLICT OF INTEREST
We certify that there is no conflict of interest with any financial organization regarding the material discussed in the manuscript.
References
Thai Agricultural Standard (TAS) 6006. Goat meat - general guidelines. National Bureau of Agricultural Commodity and Food Standards, Published in the Royal Gazette Vol. 125 Section 139 D, dated 18 August; 2008.