Assessment of genetic diversity and phylogenetic relationships of Korean native chicken breeds using microsatellite markers
Article information

Abstract
Objective
This study was conducted to investigate the basic information on genetic structure and characteristics of Korean Native chickens (NC) and foreign breeds through the analysis of the pure chicken populations and commercial chicken lines of the Hanhyup Company which are popular in the NC market, using the 20 microsatellite markers.
Methods
In this study, the genetic diversity and phylogenetic relationships of 445 NC from five different breeds (NC, Leghorn [LH], Cornish [CS], Rhode Island Red [RIR], and Hanhyup [HH] commercial line) were investigated by performing genotyping using 20 microsatellite markers.
Results
The highest genetic distance was observed between RIR and LH (18.9%), whereas the lowest genetic distance was observed between HH and NC (2.7%). In the principal coordinates analysis (PCoA) illustrated by the first component, LH was clearly separated from the other groups. The correspondence analysis showed close relationship among individuals belonging to the NC, CS, and HH lines. From the STRUCTURE program, the presence of 5 clusters was detected and it was found that the proportion of membership in the different clusters was almost comparable among the breeds with the exception of one breed (HH), although it was highest in LH (0.987) and lowest in CS (0.578). For the cluster 1 it was high in HH (0.582) and in CS (0.368), while for the cluster 4 it was relatively higher in HH (0.392) than other breeds.
Conclusion
Our study showed useful genetic diversity and phylogenetic relationship data that can be utilized for NC breeding and development by the commercial chicken industry to meet consumer demands.
INTRODUCTION
About 60 million Korean native chickens (NC) are consumed annually in Korea, which accounts for only 10% of the total chickens consumed [1]. Owing to changes in eating habits, more and more Koreans have started preferring chicken meat, resulting in an increase in consumption [2]. Roasted chicken, Dak galbi (spicy stir-fried chicken), and chicken breast salad utilizing general broiler and imported chicken meat are mainly consumed in Korea. Since NC are used only for seasonal preparations such as Baeksuk (chicken soup with rice), Samgyetang (chicken soup with ginseng), and Braised spicy chicken, the proportion of NC is relatively low. Further, White slender tail roots are disguised as NC, which contributed to its lower consumption percentage [3]. According to the study reported by Lee et al [4] flavor- and taste-contributing amino acids, including aspartic acid, threonine, serine, glycine, alanine, tyrosine, lysine, histidine, and arginine, are significantly higher in the NC breast meat than in other broilers. Native chicken meat is not only light because of its flavory taste and low fat content, but it is also chewy because of solid muscle [5]. Through many research results, the superiority of NC meat has been proved. However, the growth of NC industry is marginal, owing to the consumption of a variety of other chicken breeds in Korea. The NC breeds such as Hanhyup 3 and Woorimatdag are commercial chicken breeds developed taking into consideration the merits and economic feasibility of NC, and produced by mating the NC and economically superior and naturalized breeds [1]. This industrialization strategy of using commercial chicken is an effective counterplan for changing consumer demands and market economics. However, for the sustainable growth of NC market, strategies for the improvement should be established based on the precise genetic background for NC breeds. Woorimatdag was developed from pure NC population at the National Institute of Animal Science (NIAS) in Korea, and various genetic research projects on pure populations have been done and are still underway. Although many researchers have studied the genetic diversity and phylogenetic relationships of NC and foreign breeds using microsatellite (MS) markers, studies on the genetic background or characteristics of commercial chicken lines are still lacking. The MS markers can be suitable for a wide range of applications and have been commonly used as markers for studies of population genetics and paternity since early 1990s. The MS markers are likely to be used continuously in the future since they are comparatively cheap for genotyping and provide more genetic information on population than biallelic markers such as single nucleotide polymorphisms [6]. This experiment was conducted to investigate the basic information on genetic structure and characteristics of NC and foreign breeds through the analysis of the pure chicken populations and commercial chicken lines of the Hanhyup Company which are very popular in the NC market, using the 20 MS markers.
MATERIALS AND METHODS
Sample collection and DNA extraction
Commercial lines of chickens were collected from Hanhyup company, while NC (red, yellow, gray, black, and white) and naturalized breeds such as Rhode Island Red (RIR), Cornish (CS), Leghorn (LH) (which were introduced into Korea from foreign countries a long time ago) were collected from the NIAS in Korea (Table 1).

Description and distribution of chicken breeds used in the study
Five breeds of NC (red, yellow, gray, black, and white) recon structed by NC conservation project (1994) were used. However, the genetic origins of commercial lines were not identified because it is confidential information of the company.
Blood samples from wing veins were collected from 445 indi viduals in tubes containing ethylenediaminetetraacetic acid for DNA extraction. Samples were stored at −20°C, and genomic DNA was extracted using the manual extraction method.
Microsatellite markers and polymerase chain reaction amplification
Initially, 28 MS markers were genotyped, and all MS markers were labeled with a capillary-based dye—FAM (blue), VIC (green), or NED (yellow)—to enable genotyping. From these results, 20 highly polymorphic MS markers were selected based on the number of alleles, expected heterozygosity (Hexp) and polymorphic information content (PIC) values (Table 2). All 445 DNA samples were amplified using a GeneAmp PCR system 9700 (Applied Biosystems, Foster City, CA, USA). The amplifications were carried out using 15 μL reaction mixtures containing genomic DNA (5 to 20 ng/μL), each primer (10 pM), 2.5 mM dNTP, 10X Maxima Hot Start Taq buffer, 25 mM MgCl2, and 1.5 U Thermo Scientific Maxima Hot Start Taq DNA polymerase (Thermo Scientific, Waltham, MA, USA). The initial denaturation was performed at 95°C for 10 min, followed by 30 cycles of 30 s at 95°C, 30 s at 55°C, and 30 s at 72°C. The final extension step was at 72°C for 15 min and then cooled to 8°C.
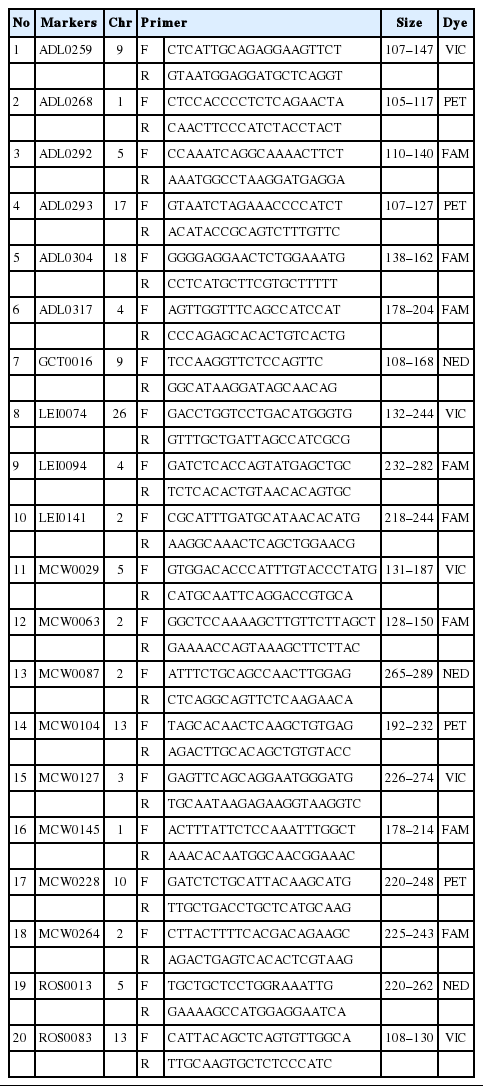
Primer information for 20 selected microsatellite markers in the study
Genotyping
The amplified DNA was genotyped using an automated Genetic Analyzer 3130xl (Applied Biosystems, USA). The genotyping reaction contained 1 μL of polymerase chain reaction (PCR) products, 8.9 μL of Hi-Di formamide, and 0.1 μL of GeneScan-500LIZ size standard in 10 μL total volume. The genotyping results were obtained using GeneMapper V 4.1 (Applied Biosystems, USA).
Statistical analysis
The genotyped data were analyzed using Cervus V 3.0 program [7] and Excel MS toolkit version 3.1 [8] to calculate allele frequencies at each locus for each population, Hexp, observed heterozygosity (Hobs), and PIC values. The amount of inbreeding-like effects within subpopulations (genetic distance [Fst]), among subpopulations (within inbreeding [Fis]), and within the entire population (total inbreeding [Fit]) were analyzed by F-statistics [9]. The STRUCTURE program [10] was used to analyze the Proportion of membership of the studied breeds. The neighbor joining method [11] was used to construct a phylogenetic tree. The principal coordinates analysis (PCoA) was carried out for 5 breeds using GenAlEx 6.4 program. The correspondence analysis, which is a weighted principal component analysis, was performed using the allele frequency data for the individuals of all five breeds and the 20 MS markers using GENETIX software [12].
RESULTS AND DISCUSSION
The Hexp, Hobs, and PIC values for the five chicken breeds are summarized in Table 3. Among the 20 MS markers selected, the number of alleles was confirmed in the range of 5 (ADL0268) to 20 (MCW0127). Total number of alleles with 20 markers was 250, and the mean number of alleles (MNA) was 12.5. The Hobs ranged from 0.349 (GCT0016) to 0.683 (MCW0145). MCW0104 showed the highest Hexp and PIC values of 0.878 and 0.866 respectively, while ROS0083 showed the lowest Hexp and PIC values of 0.742 and 0.708 respectively. Estimation of genotypic diversity in heterozygosity and PIC value informativeness of MS markers were previously used for determining animal breed selection [13]. For the animal traceability, PIC>0.5 and Hexp>0.6 are the most reasonable informative locus for application in genetics [14]. In this study, 15 MS markers selected were highly informative for the five chicken breeds and are appropriate for discrimination as well.

The statistical analysis of heterozygosity (Hobs and Hexp), polymorphism information content (PIC), and F-statistics value using selected 20 microsatellite markers among 5 chicken breeds
F-statistics [9] were estimated in a fixation index as genetic differentiation (Fst), the global heterozygote deficit among five chicken breeds (Fit), and the heterozygote deficit within the breed/line (Fis) among the 20 MS markers (Table 3). Among these markers, estimation of fixation index has been discovered for Fst, Fit, and Fis values ranging from 0.048 to 0.182, 0.200 to 0.551, and 0.111 to 0.442, respectively. The estimated mean value of the total inbreeding (Fit), within line inbreeding (Fis) and genetic distance were 0.308, 0.229, and 0.102 respectively. The F-statistics values for Fst, Fit, and Fis were high (0.182, 0.551, and 0.442, respectively) for the GCT0016 marker. While the lowest values for genetic distance (Fst) and total inbreeding (Fit) were 0.048 and 0.200 respectively for the MCW0145 marker, the lowest value within line inbreeding (Fis) value was 0.111 for the MCW0029 marker.
The heterozygosity (H exp and Hobs) and PIC value regarding the five chicken breeds are summarized in Table 4. The values for MNA, Hobs, Hexp, and PIC were highest (10.05, 0.630, 0.796, and 0.767 respectively) in the NC population, while the lowest values for MNA, Hexp, and PIC (4.40, 0.580, and 0.520 respectively) were observed in the RIR population. The Hobs value, however, was lowest in the LH population (0.420).
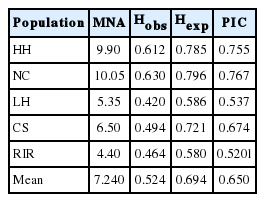
Mean number of alleles (MNA), heterozygosity (Hobs and Hexp), and polymorphism information content (PIC) observed across 20 microsatellite loci for each population
The genetic divergences among the populations based on allele frequencies were calculated according to DA genetic distance [11]. The genetic distances of 5 chicken breeds were in the range of 0.131 (HH and NC) to 0.545 (RIR and LH) (Table 5) and neighbour-joining tree of genetic relationship among 5 chicken breeds using DA genetic distance is shown in Figure 1. The NC and HH were grouped into the same branch.
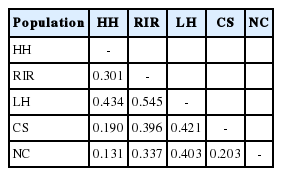
DA genetic distance matrix estimated from the frequencies of 20 microsatellite loci among the five chicken breeds
Neighbour-joining tree of genetic relationship among 5 chicken population using DA genetic distance based on 20 microsatellite loci. The numbers on the nodes are percentage bootstrap in 1,000 replications. HH, Hanhyup (Commercial line); RIR, Rhode Island Red; LH, Leghorn; CS, Cornish; NC, Korean native chicken.
Figure 2 illustrates the population relationships based on the PCoA using individual multi-locus genotypes of 20 MS markers. Contribution to the variance of the principal components was over 90% including the third ingredient. The first two components contributed 47.85% and 33.56% respectively, and the third component contributed12.42%. Notably, by the first component, LH was confirmed to be clearly separated from the other groups. CS was confirmed near the NC and HH by the second component. On the other hand, it was separated from HH and NC under the third component.
Principal coordinates analysis (PCoA) of allele frequencies from 20 microsatellite markers typed in five populations using GenAlEx. HH, Hanhyup (Commercial line); RIR, Rhode Island Red; LH, Leghorn; CS, Cornish; NC, Korean native chicken.
The correspondence analysis was performed on the five populations using allele frequencies of the 20 MS markers to summarize the breed relationships (Figure 3). The first four factors contributed to a total of 99.99% with values of 39.68%, 25.03%, 19.53%, and 15.75% respectively. Figure 3 shows close relationship among individuals which belong to the NC (pink plots), CS (gray plots), and HH (yellow plots), and it was confirmed LH (White plots) was similar to the PCoA results.
Correspondence analysis of allele frequencies from 20 MS markers typed in 5 populations using Genetix405 (White, Leghorn; Blue, Rhode Island Red; Pink, Korean native chicken; Yellow, Hanhyup (Commercial line); Gray, Cornish).
Table 6 illustrates the results of the analysis performed using STRUCTURE program. The presence of 5 clusters was detected and the proportion of membership in the different clusters was almost comparable among the breeds with the exception of one breed (HH), although it was highest in LH (0.987), and lowest in CS (0.578). For the cluster 1 it was high in HH (0.582) and in CS (0.368), while for the cluster 4 it was relatively higher in HH (0.392) than other breeds. The reason for this seems to be due to the variety of commercial pure lines by the improvement goals (for egg or meat production, etc). However, further research is needed to determine why HH line did not form a single cluster with high proportion of membership.
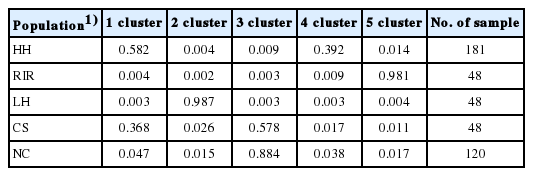
Proportion of membership of the studied breeds to the 5 detected clusters using the STRUCTURE program (ver. 2.3.4) (500 burn-in period/1,000 Reps)
LH is known as the typical egg breed, while RIR is known as the dual purpose breed and CS as meat type breed [15]. According to this study, the CS breed was genetically close to NC and HH commercial lines. From these results CS, NC, and HH commercial lines seem to be genetically close because they have been improved for the same purpose (meat type breed).
The expected probabilities of identity values were calculated for random individuals (PI), random half-sib (PIhalf-sibs), and random sibs (PIsibs) using 10, 15, and 20 MS markers and their estimates were 3.88×10−60, 4.86×10−39, and 1.38×10⁻¹², respectively when calculated using 20 MS markers (Table 7). Seo et al [16] reported that random individuals (PI), random half-sib (PIhalf-sibs), and random sibs (PIsibs) with 15 markers were estimated as 7.98 ×10⁻²⁹, 2.88×10⁻²⁰, and 1.25×10⁻⁸ respectively. On comparing the two results, it was confirmed that the expected probabilities of identity values from this study were higher than those of Seo’s Report [16]. When the domestic chicken market scale is considered, it seems to be sufficient if 15 markers are used. These results in this study indicated that these MS markers will be used to aid the conservation, traceability, and future improvement of chicken lines in Korea.
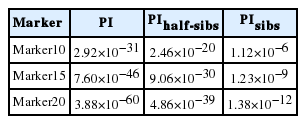
The expected probability of identity values among genotypes of random individuals (PI), random half-sib (PIhalf-sibs) and random sibs (PIsibs) for discrimination of chicken lines using 10, 15 and 20 markers
ACKNOWLEDGMENTS
This work was supported by Golden Seed Project. (2013010-05-1-WT251).
Notes
CONFLICT OF INTEREST
We certify that there is no conflict of interest with any financial organization regarding the material discussed in the manuscript.