Growth and physiological responses of broiler chickens to diets containing raw, full-fat soybean and supplemented with a high-impact microbial protease
Article information
Abstract
Objective
This study evaluated the change and function of the pancreas, and small intestine in relation to growth performance of broilers on diets supplemented with raw soybean meal (RSBM) and protease. Samples of test ingredients and diets, after mixing and prior to being used were also assessed on contents of anti-nutritional factors.
Methods
A 3×3 factorial study was used, with three levels of RSBM (commercial soybean meal [SBM] was replaced by RSBM at 0, 10%, or 20%) and protease (0.1, 0.2, or 0.3 g/kg). Each treatment was replicated six times with nine birds per replicate. Birds were housed in cages, in climate-controlled room and fed starter, grower and finisher diets.
Results
Levels of trypsin inhibitors in the diets, containing varying levels of RSBM ranged between 1,730.5 and 9,913.2 trypsin inhibitor units/g DM. Neither RSBM nor protease supplementation in diets significantly affected (p>0.05) the body weight of broilers in the entire periods (0 to 35-d). Increasing the level of RSBM in diets increased the weight of the pancreas at d 10 (p<0.000), d 24 (p<0.001), and d 35 (p<0.05). Increasing levels of RSBM in the diets reduced the apparent ileal digestibility of crude protein (CP), and amino acid (AA) at d 24. Increasing level of RSBM in the diets decreased (p<0.01) pancreatic protein content, but this was increased (p<0.05) when protease was added to the diets (0 to 10-d). Increasing the level of protease improved the pancreatic digestive enzymes, including trypsin (p<0.05), chymotrypsin (p<0.01), and general proteolytic enzymes (p<0.05).
Conclusion
The commercial SBM could be replaced at up to 20% by RSBM for broilers. Although protease supplementation slightly improved the digestive enzymes, and the ileal digestibilities of CP and AA, the CP and AA were negatively affected by increasing RSBM.
INTRODUCTION
Although soybean meal (SBM) is an excellent feed ingredient, it tends to fluctuate in supply and price in many parts of the world [1,2]. It is therefore more effective to use full-fat SBM to replace both commercial SBM and oil in the diets for broilers [3,4]. Full-fat SBM can be prepared either after being treated by heat or from the raw soybean seed although the latter contains anti-nutritional factors (ANF) [5,6].
Among the ANF, the most important one, in raw soybean meals (RSBM) is trypsin inhibitor (TI) [7,8]. The TIs in soybeans are a type of protein that can significantly reduce the digestibility and utilisation of proteins and amino acids (AAs) [9–11]. Protein digestibility could be reduced by a multifaceted action of ANF, such as by binding various nutrients and increasing the gut viscosity [12]. Due to the activity of TI, nitrogen retention can be negatively affected, and metabolic nitrogen excretion is also increased [8,13].
De-hulling the soybean seed or grinding could reduce the levels of ANF in the meals [2]. Treating the soybean seed by heat prior to feeding is also one of the most common approaches to reduce the risks of ANF [14]. However, heat treatment, depending on the temperature, pressure and the duration, may negatively influence the quality of the product [7,15].
Research scholars [16,17] have suggested that supplementation of poultry diets with exogenous enzymes may be an optional and effective strategy in utilizing the nutrients in soybean for non-ruminant animals. Although the concept of using exogenous microbial enzymes in the animal feed industry has already been established to improve the nutritive value of feed ingredients [2], use of selected feed enzymes to reduce the negative impact of protease inhibitors and lectin on non-ruminant animals is a recent phenomenon [12,18]. Microbial proteases are protein-digesting enzymes that are used in pig and poultry feed to break down the stored proteins and proteinaceous anti-nutrients in various plant materials [12,19]. The objectives of this study were therefore to analyse the contents of ANF in samples of RSBM and diets, with varying levels of RSBM, and to evaluate the effect of supplementing these diets and microbial protease on relative pancreas weight in relation to that of growing performance, digestive functions and histological morphometry of broiler chickens.
MATERIALS AND METHODS
The experiment was conducted at the Animal House of the University of New England. It was approved by the Animal Ethics Committee (Authority No: AEC14-005) prior to commencement.
Experimental diets
After purchasing the grain of raw, full-fat soybean, at harvest from a local supplier in northern New South Wales, Australia, the seeds were cleaned and hammer-milled to pass through 2 mm sieve. Then the meal (RSBM) was directly used to partially replace commercial SBM while preparing the experimental diets.
A 3×3 factorial study, involving three levels of RSBM (SBM was replaced by RSBM at 0, 10%, or 20%, equivalent to 0, 30, and 60 g/kg diet) and three levels of mono-component protease, derived from Nocardiopsis prasina (Ronozyme ProAct) (DSM Nutritional Products, Australia Pty. Ltd, Wagga Wagga NSW, Australia) was added at 0.1, 0.2, or 0.3 g/kg, equivalent to ~7,500, 15,000, and ~22,500 protease units/kg diet, respectively. However, because of the potential risks on birds and obligation of animal ethics, this experiment had no control (enzymes-free) group. Each diet was replicated six times with nine birds per replicate.
The potential efficacy of Ronozyme ProAct has been demon strated at dose level of 15,000 PROT/kg feed in chickens for fattening [20].
Experimental diets (Table 1), containing varying levels of RSBM were formulated, mixed and pelleted (enzymes were added on top before pelleting the diets at a temperature of about 65°C). Sub-samples of the starter diets were then collected and ground with a coffee grinder. Samples of these diets nd RSNM as well as SBM were analysed to determine the quality attributes, including TI, protein solubility in KOH, urease activity, (UA) and nitrogen solubility index (NSI).

Ingredient and nutrient composition of starter (0 to 10 d), grower (10 to 24 d) and finisher (24 to 35 d) diets
Animal husbandry and sampling
A total of 486-day-old Ross 308 male broiler chicks, with an average body weight (BW) of 40.24±0.097 g, were obtained from a local commercial hatchery (Baiada Poultry Pty. Ltd., Tamworth, Australia). Average BW and uniformity were considered when weighing and allocating the nine chicks into every cage (600×420 ×23 cm), which contained randomized dietary treatments.
The temperature of the rooms was set at 33°C for the first two days with relative humidity ranged between 49% and 60%. This temperature was then gradually reduced to 24°C at 19 days of age and this was maintained for the remaining study period. For the first two days, 24 h of light (20 lux) was provided. This was then reduced to 23 h for the next six consecutive days, followed by 20-h light (10 lux) for the remaining days. Feed was provided ad libitum (crumble only for starters), and the birds had free access to water. The birds were provided with starter (0 to 10 d), grower (10 to 24 d), and finisher (24 to 35 d) diets (corn-soybean based) formulated to Aviagen standards for Ross 308 [21]. The leftover feed and live BW of the birds were recorded at 10, 24, and 35 days of age (at the times of sampling). Mortality was recorded whenever it occurred.
On days 10th, 24th, and 35th, one bird per replicate was ran domly selected and killed by cervical dislocation and the weight of the pancreas was recorded to evaluate the magnitude of change in weight over the study period under the effect of dietary TI. All sample collection was completed between 0900 and 1200 h.
Pancreatic and jejunal tissue sampling
On day 10th and 24th, the entire pancreas was collected from the sampled birds (one birds per cage), then snap-frozen in liquid nitrogen and stored in a freezer (−20°C) until analysis for tissue protein content and the activities of digestive enzymes. The pancreas was also collected from another sampled bird per cage on the 24th and 35th d (sampling days), snap-frozen in liquid nitrogen and stored in the freezer to be used in evaluating the DNA concentration.
Samples (approximately 2 to 3 cm) from the proximal part of the jejunum, approximately 3 to 5 cm distance from the duodenum were collected, snap-frozen in liquid nitrogen and then transferred into a freezer (−20°C) and used for analysis of the tissue protein content and the activities of digestive enzymes. Another tissue sample was also collected from the same position (proximal) of the jejunum, just next to the previous samples (at 10 and 24 d) and fixed in formalin solution for the analysis of histological parameters.
Ileal digesta sampling
On day 24, samples of the ileal digesta were collected from at least 2 birds (depending on the amounts of digesta obtained per bird) per cage. The digesta were pooled in a bottle and placed in ice, and later stored in a freezer (−20°C) until analysis for nutrient contents, which were then used to calculate digestibility.
Growth performance response
On days 10, 24, and 35, the live weights of both the sampled and remaining birds (on each sampling day) were recorded per cage.
Chemical analysis
The total nitrogen content of diets was determined by the Dumas combustion technique (LECO, St. Joseph, MI, USA) [22]. The crude protein (CP) content of the sample was calculated by multiplying N content by 6.25. Available lysine was measured using method [22]. The value of available lysine was determined as the fraction of lysine which reacts with fluorodinitrobenzene.
The contents of some feed quality parameters were analysed using appropriate methods, such as the protein solubility (KOH) [23], TI (Official Method 22-40) [24], UA (Official Methods Ba, 9-58) [25], and NSI (method Ba 11-65) [26].
Tissue processing and analysis of the titanium contents in the samples and the ileal crude proteins and amino acid digestibilities
The concentration of titanium (Ti) in the ileal digesta and diets was determined using the method described by Short et al [27].
The values of the nutrient and the Ti marker were used to calculate the ileal digestibility as follows:
Tissue processing was conducted by cutting the entire pancreas, into small pieces, and then transferring it into a centrifuge tube containing cold Ringer’s solution, pH 7.4, at a ratio of 15.0 mL of Ringer’s solution to 1.0 g of tissue [28]. The sample was homogenized at a speed of 4 for approximately 60 s using a homogenizer (Ika Ultra Turrax T25, Königswinter, Germany). The homogenate was then centrifuged at a speed of 30,000×g for 10 min and then supernatant was taken in the duplicates of Eppendorf tubes and stored in a freezer (−20°C) for subsequent analyses.
Tissue protein contents and endogenous enzyme activities
The protein concentrations in the pancreas and jejunum were determined using the Bradford [29] method. The activities of the pancreatic enzymes, including trypsin, chymotrypsin, as well as general proteolytic (GP) activity, were determined using methods of Susbilla et al [28] with slight modifications [30]. The activity of pancreatic lipase was determined using the procedure described by Winkler and Stuckmann [31].
The activity of alkaline phosphatase (AP) was determined using the procedure described by scholars [32,33]. Sucrase activity in the jejunum was determined using the procedure described by Iji et al [34]. Approximately 25 μL of the homogenate was incubated in a solution (100 mg of sucrose [mw 342.2]+4 mM sodium succinate [1.08 g]+90 mM NaCl [5.26 g]/L of Milli-Q water, pH 6.0). The reaction was terminated with 2.5 mL of another solution (0.2% Triton X-100 w/v [approximately 0.2 g] and 0.5 M Tris-HCl buffer [78.8 g Tris/L], pH 7.02 at 37°C). Approximately 0.4 mL of this mixture was then added to 2.5 mL of GoPoD solution and then further incubated at room temperature before the absorbance was read at 610 nm. The maltase activity in the jejunum was determined using the same procedures described for sucrase, except that maltose was used as substrate.
Mucosal morphometry of the jejunum
The mucosal morphometry was measured using the method described by Iji et al [35]. Briefly, the samples were excised from the proximal part of the jejunum. After flushing with saline water, the samples were immediately fixed in formalin solutions and then in 70% ethanol alcohol for storage. Two pieces of tissue were excised from each sample and enclosed in tissue cassettes (Bayer Diagnostics Pty Ltd, Adelaide SA, Australia) containing ethanol solution. The tissue samples were then processed in an automatic tissue processor (Shandon, Pittsburgh, PA, USA) over 17 h during which the tissue samples were passed through a series of baths of increasing concentrations of ethanol, followed by xylene solutions. The cassettes containing the samples were then immersed in 2 separate baths of a 100% solution of paraplast. The samples were then embedded in a single mould containing paraffin wax. Sections were cut from the tissue using a microtome equipped with a feather blade. After the sections were floated on warm water, they were mounted on microscopic slides, checked for quality, and then allowed to dry on a hotplate.
Before staining, the sections were deparaffinised by immersing the slides in three consecutive solutions of SOLV21C (United Biosciences Pty Ltd, Brisbane QLD, Australia) and then dehydrated by passing them through a series of alcohol concentrations. The sections were stained with Harris’ haematoxylin and eosin solutions. These stained sections were immersed in a series of solutions containing increasing concentrations of alcohol, followed by three separate baths of SOLV21C, and then mounted in LEICACV (Leica Biosystems, Nussloch GmbH, Nuβloch, Germany).
The slides with stained tissue were viewed on an Olympus BH-2 microscope and digitized using video image software (Video Pro, Leading Edge, Bedford Park, South Australia). The images were viewed to measure the muscle depth, crypt depth, basal width, villus height, and villus apical width. The apparent villus surface area was calculated as: [(apical width+basal width)/2] ×villus height. The mucosal depth was derived by adding the villus height and crypt depth.
Determination of DNA contents of the pancreas
The concentration of DNA in the pancreas was determined following the procedure described in the kit (Isolate II Genomic DNA kit, Bioline, Pty Ltd, Alexandria, NSW, Australia). The eluted DNA was then determined by the ratio of spectrophotometric absorbance of the sample at 260 nm to that of 280 nm (NanoDrop ND-1000, Waltham, MA USA). The DNA content was calculated as follows:
Statistical analysis
Descriptive statistics was used to analyses values of nutritional compositions. One-way analysis of variance and general linear model of Minitab software version 17 (Minitab Inc., State College, PA, USA [36] were used to compare the mean values of treatments, and main factors (RSBM level and enzyme supplementation as well as their interactions) of the feeding trail. The differences between the mean values were considered to be significant at p<0.05, and these mean values were also separated using Duncan’s test.
RESULTS
Composition and quality of diets
As shown in Table 2 and 3, the concentration of TI in the diets containing graded levels of RSBM ranged between 1,747 and 9,913.2 trypsin inhibitors units (TIU)/g. The highest TI value was found in the diets containing 20% RSBM. The UA in the diets ranged between 0.16 and 1.4 ΔpH. The value of NSI proportionally increased in the diets with increasing level of RSBM, but there was no consistency in KOH across the dietary treatment groups.

Analysed values of nutrient composition and quality measuring parameters of raw soybean meal in comparison to the commercial soybean meal
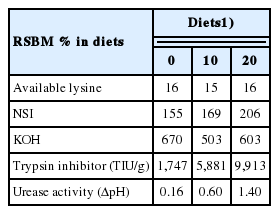
Effect of supplementing graded levels of raw soybean meal on quality (g/kg) of broiler diets
Growth response of birds and relative weight of pancreas
Results of the gross response of the birds, in terms of BW and weight of pancreas are shown in Table 4. There was no interaction effect between the main factors (RSBM×protease) on the BW and relative weights of pancreas of birds (at d 10, d 24, or d 35). With increasing levels of RSBM, the BW was significantly influenced at 10 d (p<0.001) and at 24 d (p<0.01), but had no significant effect (p>0.05) at d 35. Increasing levels of microbial protease in diets significantly influenced the BW at d 10 (p<0.01) and at d 24 (p<0.05) and tended at d 35 (p = 0.06) to increase.
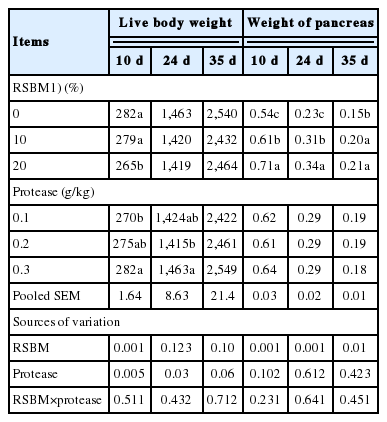
Main effects of raw soybean meal and protease supplementation on live body weight (g/bird) and weight of pancreas (g/100 g body weight)
Increasing the level of RSBM in the diets increased the weight of the pancreas by approximately 24% (p<0.001), 32% (p<0.001), and 26% (p<0.01) at d 10, 24, and at d 35, respectively.
When increasing the replacement of commercial SBM by RSBM from 0 to 20%, the BW was reduced by 6.0% (10 d) and similarly reduced by 3.0% in both at d 24 and 35, whereas, the relative weight of pancreas was increased by 23.9% (at d 10), 32.4% (at d 24), and 28.6% (at d 35). There was no consistent relationship observed between the BW and relative weight of pancreas due to supplementation of protease in diets containing RSBM.
Although not statistically different (p >0.05), increasing the level of microbial protease in the diets containing RSBM decreased the weight of the pancreas by 0.7% and 4.2%, respectively at d 24 and 35. The weight of the pancreas was not, however, significantly (p>0.05) affected by the interaction between the main factors (protease×RSBM) in the diets at any point of assessment.
Ileal nutrient digestibility
As shown in Table 5, there was no significant interaction between increasing levels of RSBM and protease supplementation on apparent ileal digestibility (AID) of CP and AA. Increasing the amount of RSBM in the diets statistically (p<0.05) decreased the AID of CP at d 24. The AID of most indispensable AA, for example arginine, histidine, lysine, methionine and threonine was significantly decreased with rising level of RSBN in the diet.
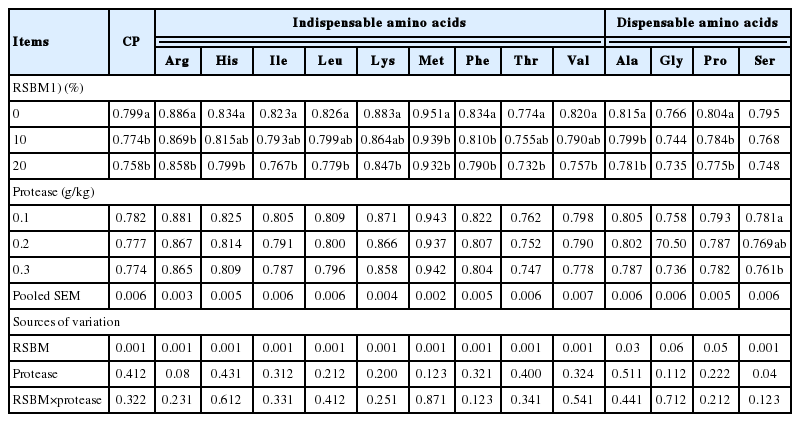
Main effects of graded levels of raw soybean meal and protease supplementations on coefficient of digestibility of CP and AA digestibilities at d 24
The AID values of dispensable AA, for example, serine, and glycine, were significantly decreased (p<0.05) with increase in inclusion rate of RSBM. However, the digestibility of indispensable and dispensable AA was not statistically affected (p>0.05) by supplemental levels of protease at d 24. The AID value of methionine was 94.1%, which is the highest value, compared to the other indispensable AA; for example, threonine (75.4%).
Glycine had the lowest value of AID among the dispensable AA (74.8%) measured at d 24. The AID of gross energy (GE) at d 24 was not affected by RSBM level of supplementation or microbial protease. There were no significant effects (p>0.05) on the AID of the CP, GE, or any AA due to interactions between the main factors (protease×RSBM) during the assessed period from 0 to 24 d. The digestibility of indispensable and dispensable AA, in general, followed the same trend as that of the CP.
Tissue protein contents, activities of digestive enzymes and mucosal morphometry
Except AP, the interaction between the main factors (protease× RSBM) had no effects (p>0.05) on protein concentration and the activity of any digestive enzymes, including trypsin, chymotrypsin, GP activity, lipase, maltase, or sucrase at d 10 (data are not shown). Birds fed diets containing RSBM-free and 0.2 mg protease/kg had significantly higher activities of AP than others at d 24. Increasing the level of RSBM reduced (p<0.05) the concentration of protein in the pancreas at d 10, but the concentration was increased (p<0.01) when the diets were supplemented with microbial protease, particularly at 0.2 g/kg. The activities of trypsin and lipase similarly tended (p = 0.06) to improve at low (0.1 g/kg) levels of protease supplementation.
The analysed tissue protein contents and activities of digestive enzymes at d 24 are shown in Table 6. Increasing the inclusion rate of RSBM reduced the activities of chymotrypsin (p<0.05) and AP (p<0.05) but had no effect (p>0.05) on the activities of trypsin, GP, lipase, maltase, and sucrase. Although the concentration of the jejunal tissue protein was not affected (p>0.05), pancreatic tissue was increased (p<0.05) due to supplementation with protease. The activities of most pancreatic enzymes, including trypsin (p<0.05), chymotrypsin (p<0.01), GP (p<0.05) and lipase (p = 0.06) were influenced by protease supplementation. Except for AP (p<0.05), there was no significant effect of interaction between RSBM and protease on tissue protein concentrations or other enzymatic activities at d 24.

Main effects of graded levels of raw soybean meal in diets and protease supplementation on tissue protein concentration, and pancreatic and jejunal enzyme activities of broiler chicks at 24 days of age
The results of tissue protein and DNA contents, and the ratio between the two are shown in Table 7. The interaction between the main factors (protease×RSBM) had no significant effects (p>0.05) on protein or DNA concentration or their ratio (protein: DNA). The pancreatic tissue protein content was increased (not significant) at d 24, but it was decreased (p<0.05) at 35 d with increase in inclusion rate of RSBM. Increasing the level of RSBM or protease had no influence (p>0.05) on the DNA concentrations of the pancreas at d 24 or 35. The ratio of protein to DNA at d 35 tended (p = 0.08) to increase at low (0.1 g/kg) level of protease supplementation, but this effect was absent at d 24.
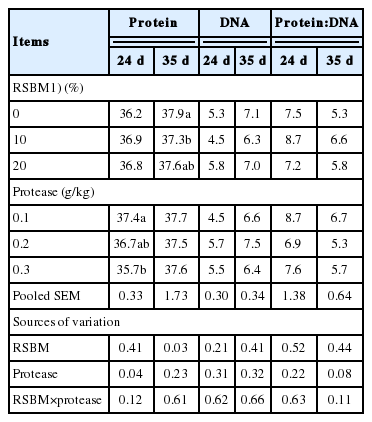
Main effects of graded levels of raw soybean meal in diets and protease supplementation on protein and DNA concentration (mg/g), and ratio of protein to DNA in pancreas at 24 and 35 days of age
As shown, in Table 8, the interactions between RSBM and protease significantly increased the length of the villi (p<0.05) and the depth of the mucosa (p<0.05) and tended (p = 0.06) to increase the apparent surface area of the villus. Birds fed diets containing RSBM-free and 0.2 mg protease/kg had both highest villus length and mucosal depth as compared to others at d 10. Birds fed on diets containing RSBM-free and 0.2 mg protease/kg tended to had highest crypt depth as compared to the others.
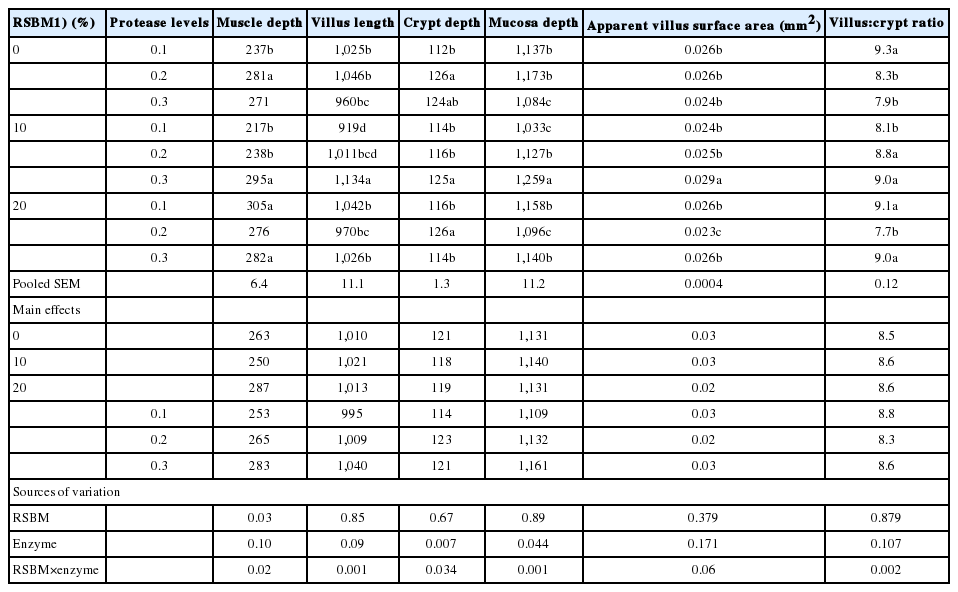
Effects of graded levels of raw soybean meal in diets and protease supplementation on mucosal morphometry (μm) of the jejunum at 10 days of age
The interaction between levels of RSBM and protease tended (p = 0.08) to be significant (Table 9) for crypt depth and villus length at d 24. Birds fed diets containing 20% RSBM and 0.2 g protease/kg had the highest villus length and mucosal depth as compared to the other at d 24.
Main effects of graded levels of raw soybean meal in diets and protease supplementation on mucosal morphometry (μm) of the jejunum at 24 d of age
DISCUSSION
Gross response to the diets
The values of TI, UA, and NSI increased in line with increase in contents of RSBM in the diets. These results agree with Frikha et al [37] who reported that protein solubility and UA, and TI contents are correlated with the amounts of unheated soybeans in the diet.
Although the BW was reduced at d 10 or at d 24 by increasing levels of RSBM, it was significantly unaffected by increasing levels of RSBM or protease supplementation, over the entire feeding period (0 to 35-d). In general, this result agrees with other scholars [38,39]. Although not significant, increasing the level of microbial protease in the diets tended to improve the BW during the entire period (0 to 35-d). Other scholars [40,19] similarly reported that microbial protease can break down both stored proteins and proteinaceous anti-nutrients in diets. These current results are indicating that younger birds (chicks) are more susceptible for ANF and exogenous enzymes may not be physiologically assimilated to break down and anti-nutrients in diets. Or, indigenous digestive functions at early age of birds may not be helpful for supplemented protease to reduce negative impacts of ANF.
Physical and physiological response of pancreas
Increasing the inclusion rate of RSBM in the diets resulted in an increase in the weight of the pancreas compared to the birds fed the RSBM-free diet, and this was highly pronounced in young birds. This proportional increment of pancreas weight, against to that of increasing levels of TI in diets might be an indicator of the physiological mechanism to coping the negative impacts of ANF on birds by enlarging the surface area of pancreas and thereby to produce more of indigenous enzymes, particularly protease. The concentration of DNA or the ratio of tissue protein to DNA was not affected by increasing the levels of RSBM or protease in the diets of the broilers.
The magnitude of change in the weight of the pancreas also decreased with age. These results agree, with Mirghelenj et al [41] who reported that the relative weight of pancreas of chickens fed extruded full-fat SBM was higher than that of birds fed control diets at 21 d, but no effect was observed at 42 d. The reasons for the reduction in the weight of the pancreas, in the birds fed RSBM with age might be linked to the use of exogenous microbial protease in the current study or adaptation of birds to the ANF. The current results are shown the relationship of relative weight of pancreas and BW. When the age of the bird advanced the relative weight of pancreas started declining in contrast to the BW, which might be due to reduction of the negative impact of ANF on the weight of pancreas as well as on its digestive functions. These findings might be the outcome of both contribution of microbial protease and adaptation of birds to ANF because of age advances.
Ileal nutrient digestibilities, tissue protein content, activities of digestive enzymes, and mucosal morphometry
Although increasing the level of RSBM in the diets decreased the AID of CP, it was not significantly improved by increasing the level of supplemental protease. This result agrees with Marsman et al [42] who reported that protease and carbohydrase supplementation in diets had no significant influence on the AID of CP.
The AID values of most of the indispensable and dispensable AA decreased with increasing level of RSBM in the diets. These results agree with those of de-Coca-Sinova et al [43] who reported that the ileal AA digestibilities were greater for diets with low dietary TI concentrations. The response of AID of CP and AA to protease supplementation in this study appears to be insignificant mainly because the data are being compared against a diet that contains a low level of protease. No negative control (no protease) was tested in this study due to animal welfare concerns.
The content of pancreatic tissue protein was reduced with increase of protease but the reason for this change is not clear. There are no reports on the effects of protease on tissue protein synthesis. The activities of chymotrypsin and AP decreased with increasing levels of RSBM in the diets. This maybe an organ (pancreas) response to high levels of TI in the diets although the activities of the other enzymes were unaffected. However, most of the pancreatic digestive enzyme activities were improved by dietary supplementation with microbial protease. These results partially agree with those of Yuan et al [44], who reported that higher activities of amylase and trypsin were found when the diets were supplemented with enzymes. Results of this current study may have relationship with the time that the heaviest weight (hypertrophy) of pancreas was recorded. However, due to supplementation of protease, activities of digestive enzymes were improved, but these may not be sufficient to improve the AID of CP and AA of birds at 24 d.
There are no previous reports on the effects of TI on the muco sal morphometry of broiler chickens. In the current study only the villus height and mucosal depth were affected by the interaction effects between the main factors (protease×RSBM) in the diets. Yuan et al [44] had previously observed a positive effect of microbial enzymes on villus height and apparent surface area of the villus in birds. The relationship between values of morphometric parameters, growth of birds, visceral organ development and digestive enzyme functions are unclear.
CONCLUSION
Some dietary treatment groups contained TI beyond the safe threshold level for non-ruminant animals, but productivity was not greatly compromised by the partial replacement of commercial SBM with RSBM. Pronounced pancreatic hypertrophy was identified in the broilers fed diets containing high levels of RSBM. However, the response of the birds suggested that the pancreas remained functional. Although the ileal digestibility of CP and AA was reduced with increase in levels RSBM, the overall results of this study suggest that there is scope for higher inclusion levels of RSBM in broiler diets.
ACKNOWLEDGMENTS
This research was supported by funding from DSM Nutritional Products, Animal Nutrition and Health, Singapore and the University of New England, Australia.
Notes
CONFLICT OF INTEREST
We certify that there is no conflict of interest with any financial organization regarding the material discussed in the manuscript.