Genome-wide association study identifies 22 new loci for body dimension and body weight traits in a White Duroc×Erhualian F2 intercross population
Article information
Abstract
Objective
Growth-related traits are important economic traits in the swine industry. However, the genetic mechanism of growth-related traits is little known. The aim of this study was to screen the candidate genes and molecular markers associated with body dimension and body weight traits in pigs.
Methods
A genome-wide association study (GWAS) on body dimension and body weight traits was performed in a White Duroc×Erhualian F2 intercross by the illumina PorcineSNP60K Beadchip. A mixed linear model was used to assess the association between single nucleotide polymorphisms (SNPs) and the phenotypes.
Results
In total, 611 and 79 SNPs were identified significantly associated with body dimension traits and body weight respectively. All SNPs but 62 were located into 23 genomic regions (quantitative trait loci, QTLs) on 14 autosomal and X chromosomes in Sus scrofa Build 10.2 assembly. Out of the 23 QTLs with the suggestive significance level (5×10⁻⁴), three QTLs exceeded the genome-wide significance threshold (1.15×10⁻⁶). Except the one on Sus scrofa chromosome (SSC) 7 which was reported previously all the QTLs are novel. In addition, we identified 5 promising candidate genes, including cell division cycle 7 for abdominal circumference, pleiomorphic adenoma gene 1 and neuropeptides B/W receptor 1 for both body weight and cannon bone circumference on SSC4, phosphoenolpyruvate carboxykinase 1, and bone morphogenetic protein 7 for hip circumference on SSC17.
Conclusion
The results have not only demonstrated a number of potential genes/loci associated with the growth-related traits in pigs, but also laid a foundation for studying the genes’ role and further identifying causative variants underlying these loci.
INTRODUCTION
Pork is the largest source of meat production in the world [1]. Generally, improving economically important traits, e.g. production-related traits in pigs have greatly concerned both producers and breeders. Body dimension (e.g. body height, length and width) and body weight are important production traits. They are complex quantitative traits and show low to moderate heritability [2], so that the traditional selection for them may not be very efficient. In contrast, the use of genomics and molecular techniques can speed genetic improvement and increase levels of production quickly [3].
Thousands of quantitative trait loci (QTLs) for different traits have been identified since the first QTL study for growth and body composition in pigs was reported [4]. To date, 1,424 QTLs for production traits have been deposited in the PigQTLdb (http://www.genome.iastate.edu/cgi-bin/QTLdb/SS/index). However, most of QTLs span a very large chromosomal region identified by linkage analysis with low density markers. As a result, only a handful of quantitative trait nucleotides for complexed traits have been identified in agricultural animals [5,6]. Fortunately, the emergence of high-throughput genotyping platform and single nucleotide polymorphism (SNP) arrays have enabled
The Chinese Erhualian is one of the most prolific pig breeds in the world while its productive efficiency is much lower than that of White Duroc cultivated by PIC company [7]. Therefore, the genetic architecture of production traits must be distinct between the two breeds. We have constructed a three-generation resource population by crossing White Duroc boars and Chinese Erhualian sows, and a diverse set of phenotype traits including body dimension and body weight traits at 210 d have been recorded. The objective of this study was to identify QTL and positional candidate genes for body dimension and body weight traits at 210 d by genome-wide association studies (GWAS).
MATERIALS AND METHODS
All samples were collected according to the guidelines for the care and use of experimental animals approved by the State Council of the People’s Republic of China. The ethics committee of Jiangxi Agricultural University specifically approved this study.
Animals and phenotypic measurement
A White Duroc×Erhualian F2 resource population was used in this study. It was developed and managed as described previously [8]. Briefly, 2 White Duroc sires and 17 Erhualian dams were mated to produce F1 animals in 2001, from which 9 F1 boars and 59 F1 sows were intercrossed to produce 983 F2 males and 929 F2 females in 6 batches from 2003 to 2006. All F2 animals were raised at the experimental farm in Jiangxi Agricultural University (Nanchang, China). They were fed with similar diet under a standardized feeding and management regimen and given free access to water. All piglets were weaned at 46 days and the males were castrated at 90 days. At 210±6 days of age, a total of 124 castrated males from 1st batch were measured for body dimension traits and a total of 741 progeny including 340 females and 401 males in 6 batches were measured for body weight (BW). Body dimension traits consist of abdominal circumference (AC), body height (BH), body length (BL), cannon bone circumference (CBC), chest circumference (CC), chest depth (CD), chest width (CW), hip circumference (HC). The details of the measurement methods were described by Ma et al [9].
Genotyping and quality control
Genomic DNA was isolated from ear tissues using a routine phenol/chloroform extraction method. The DNA concentration of the samples was adjusted to 50 ng/μL using the Nanodrop ND-1000 (Peqlab Biotechnology, Erlangen, Germany) and DNA quality was assessed by gel electrophoresis using 1% agarose gels. Samples were genotyped with the Illumina PorcineSNP60 BeadChip, using the Infinium HD Assay Ultra protocol (Illumina, Inc., San Diego, CA, USA). Quality control was carried out using PLINK v1.07 [10]. Briefly, SNPs were removed if they had genotype-missing rates >0.1 or minor allele frequencies<0.05 or Hardy-Weinberg p≤10−5. Samples were removed on low (<95%) call rate. After that, all 125 individuals passed the filter and a final set of 43,517 SNPs were selected for subsequent analysis.
Statistical analysis
The association analyses were conducted using GenABEL in the R software [11]. A mixed linear model was used to test for the association between SNPs and the recorded traits by a two-stage approach. For body weight measured in 340 females and 401 males from 6 batches, sex and batch were fitted as fixed effects in the mixed model. Firstly, the phenotypic residual vector e* was calculated as follows:
Where y is the vector of phenotypes; b is the vector of fixed effects including sex and batch, and X is the incidence matrix for b; u is the vector of random polygenic additive effects with
Then, a family-based score test was explored to detect associations between SNPs and traits by the following regression model, each time one SNP:
Where a is the estimator of the SNP allele substitution effect, S is the incidence vector of a; e is the vector of residual errors following
As for body dimension traits which were only recorded in males in the 1st batch, sex and batch effects were excluded from the above model.
The association analysis of chromosome X was based on the assumption of complete and uniform X-inactivation in females and a similar effect size between males and females. Thus, females are considered to have 0, 1, or 2 copies of an allele as in an autosomal analysis; males are considered to have 0 or 2 copies of the same allele, i.e. male hemizygotes are considered equivalent to female homozygous states.
In this study, the genome-wide significance threshold was determined by the Bonferroni method [12], which was equal to 1.15× 10⁻⁶ (0.05/43517). The suggestive significance level was set to 5×10⁻⁴ [13]. GWA peaks with p<5×10⁻⁴ at a distance of more than 15 Mb were considered as different QTLs.
The influence of population stratification was assessed by examining the distribution of test statistics and assessing their deviation from the null distribution (that expected under the null hypothesis of no SNP associated with the trait) in a quantile-quantile (Q-Q) plot [14]. The Q-Q plot was constructed using R software.
Haplotype block analysis or linkage disequilibrium was performed in the region which contained multiple significant SNPs clusters around the peak SNP. The HAPLOVIEW V4.2 software with default settings was used to determine the haplotype blocks [15].
Bioinformatics analyses
SNP positions on chromosomes and the closest genes to tag (significant and suggestive) SNPs associated with traits were obtained by using Sscrofa 10.2 genome assembly from Ensembl website (http://www.ensembl.org/Sus_scrofa/Info/Index). The overlap between our GWAS data and previously mapped QTL data were assessed using the PigQTLdb (http://www.animalgenome.org/cgi-bin/QTLdb/SS/index). To identify the candidate genes, we queried the information about the associations between all candidate genes within 1 Mb bin size on either side of GWAS lead SNPs.
RESULTS AND DISCUSSION
Phenotype and correlations between traits
The description of traits, number of records, means, standard deviation, minimum and maximum are summarized in Table 1. Figure 1 shows that the correlation coefficients between BW and body dimension traits, which were positive and highly significant (0.55≤r≤0.86, p<0.01).
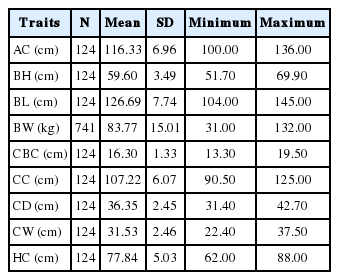
Descriptive statistics of 210 d body dimension and body weight traits from the White Duroc×Erhualian F2 intercross pig population.
Phenotypic correlation coefficients between body dimension and body weight traits. AC, abdominal circumference; BH, body height; BL, body length; BW, body weight, CBC, cannon bone circumference; CC, chest circumference; CD, chest depth; CW, chest width; HC, hip circumference. The dots indicate the significant (p<0.01) correlation coefficients between each pair of traits.Round shadow size and color depth represent the degree of the correlation coefficient.
Population stratification assessment
The Q-Q plots of the test statistics in GWAS are shown in Figure 2. The lambda values for all traits are close to 1 except CBC (λ = 1.33). The Q-Q plots and the λ value indicated that there are no very strong stratification existed.

The quantile-quantile (Q-Q) plots for (A) abdominal circumference, (B) body height, (C) body length, (D) body weight, (E) cannon bone circumference, (F) chest circumference, (G) chest depth, (H) chest width, (I) hip circumference. The horizontal axis indicates the expected −log10 (p-values) and the vertical axis indicates the observed −log10 (p-values). The diagonal line represents y = x, which corresponds to the null hypothesis.
GWAS signals for traits
We identified a total of 611 tag SNPs for the body dimension traits and 79 tag SNPs for body weight in this study (Table 2). Sixty-two SNPs were not assigned to any chromosome. There were 100 mapped SNPs reaching genome-wide significance level, including 95 SNPs for CBC on SSC7, 2 SNPs for BW on SSC7 and SSCX respectively, 1 SNP for HC on SSC17 (Figure 3). All the significant SNPs except for unmapped markers represented 23 QTLs, of which all but one on SSC7 have not been reported previously.
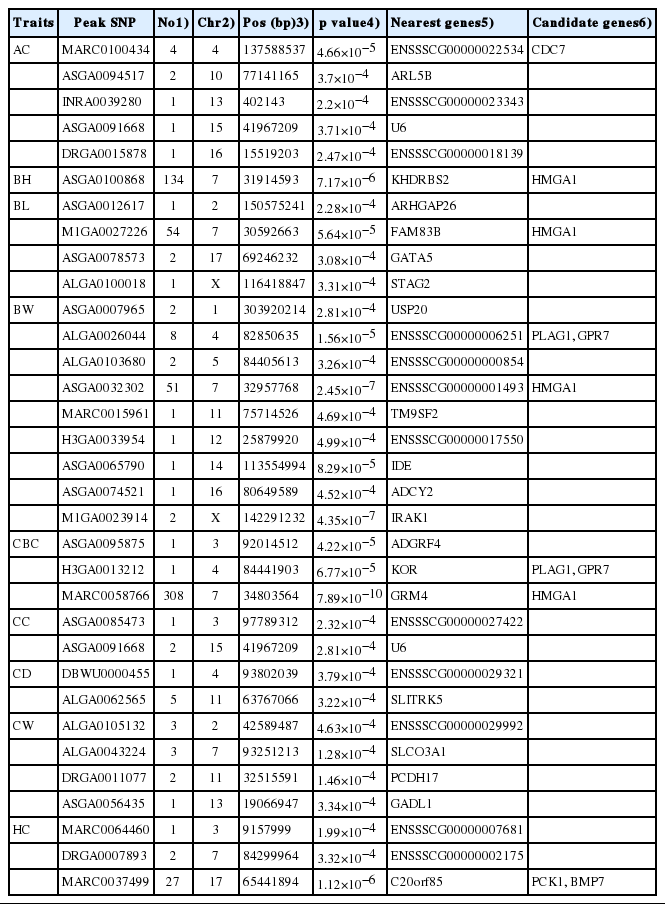
Description of SNPs significantly associated with the 210 d body dimension and body weight traits
Manhattan plot of the genome-wide association study (GWAS) result. Chromosomes 1–18 and 19 (X) are shown in different colors. The X-axis represents the chromosomes, and the Y- axis shows the −log10 (p-value). The horizontal, dashed line represents the chromosome-wide significance thresholds and the real line reflects the genome-wide significance thresholds.
As the lambda value of CBC (1.33) is a little inflated, we applied the GRAMMAR-GC method to re-evaluate the association between the three tag SNPs (i.e., ASGA0095875, H3GA0013212, MARC0058766) and CBC. The resulting p-values differed slightly from the previously reported p-values, indicating that the three SNPs represent reliable association signals.
Previous studies have shown that the SSC7 region from 35.0 Mb to 43.9 Mb contains multiple significant SNPs associated with CBC [16,17]. Recently, a GWA study performed by Wang et al [18] in a Large White×Minzhu pig population identified 138 SNPs significantly associated with BH, BL, CBC, and HC within a 36.9 Mb region from 20.8 Mb to 57.7 Mb. Coincidently, we also detected 134 SNPs for BH, 54 SNPs for BL, 308 SNPs for CBC and 51 SNPs for BW in the SSC7 region spanning from 13.0 Mb to 55.4 Mb. The most significant SNPs ASGA0100868 (at 31.91 Mb) for BH, ASGA0032302 (at 32.95 Mb) for BW and MARC0058766 (at 34.80 Mb) for CBC were in strong linkage disequilibrium (r2>0.8). We selected the top SNP ASGA0100868 for BH to estimate allelic substitution effects of the SSC7 QTL (Table 3). Pigs with AA genotype had statistically higher phenotypic values than pigs carrying the AG and GG genotypes. And the allelic substitution effect accounted for 2.13 cm of BH, 4.06 kg of BW and 1.18 cm of CBC (Table 3). This is consistent with our previous genome-wide linkage study that identified a QTL within the SSC7 region with large effect on growth traits in this F2 population [8].

The allelic substitution effect of the top SNP ASGA0100868 on BH, BW, and CBC
This is the first study to detect QTL for HC in pigs. There were 31 SNPs significantly associated with HC, of which 27 fall in the region from 61.6 Mb to 68.0 Mb on SSC17. The remaining two SNPs were detected on SSC7 and one on SSC3. Only one SNP was not assigned to pig chromosomes. The most significant SNP associated with HC was the SNP MARC0037499 at 65.44 Mb with the p value of 1.12×10⁻⁶ on SSC17 and it is near to the gene C20orf85. At this locus, the GG genotype had greater HC (79.45 ±4.58 cm) compared to the AG (76.05±4.35 cm) and the AA (71.50±4.66 cm) genotypes. The four highly significant SNPs MARC0037499, ASGA0078226, ALGA0096393, and M1GA 0022553 for HC on SSC17 were just in a constructed haplotype block that spans 79 Kb (Figure 4). No annotated genes are present in the haplotype block, indicating that the QTL effect may be caused by a regulatory mutation. Candidate genes phosphoenolpyruvate carboxykinase 1 (PCK1) and bone morphogenetic protein 7 (BMP7) are located adjacent to the block.
Haplotype block at linkage disequilibrium (LD) on a 508 Kb region on SSC17 associated with hip circumference. The block of 79 Kb, which contained the most significant single nucleotide polymorphism (SNP) being MARC0037499 (noted by a star).
Nine SNPs associated with AC at the suggestive significance level were found at five chromosome regions. The SNP INRA 0039280 on SSC13 was positioned within the gene ENSSSCG 00000023343. In addition we identified 22 SNPs associated with CC, CD, and CW. Eighteen out of the 22 SNPs indicated 8 QTLs on SSC2, 3, 4, 7, 11, 13, and 15. One SNP ASGA0085473 was mapped in the intron of gene ENSSSCG00000027422. The positions of the other 17 SNPs were close to the locations of 7 genes including U6, SLIT and NTRK like family member 5 (SLITRK5), solute carrier organic anion transporter family member 3A1 (SLCO3A1), protocadherin 17 (PCDH17), glutamate decarboxylase like 1 (GADL1), ENSSSCG00000029321 and ENSSSCG 00000029992.
Candidate genes for major QTLs
SSC4
Three QTLs were detected on SSC4: one for AC, one for BW and CBC and another for CD. The peak SNP MARC0100434 for AC (at 137.6 Mb) was located 650 Kb away from cell division cycle 7 (CDC7) gene. This gene can regulate the expression of the DNA unwinding element-binding protein in replication initiation and hypomorphic mutation in CDC7 reduced mouse growth rate [19]. Therefore, we regard CDC7 as a candidate for AC. The QTL effect on both BW and CBC may be due to the candidate gene pleiomorphic adenoma gene 1 (PLAG1) and/or neuropeptides B/W receptor 1 (GPR7). PLAG1 has been found to be associated with cattle height [20]. Moreover, PLAG1 variants were also associated with growth and fatness traits in an European Wild boar× Large White F2 intercross population [21] and the present F2 population, as well as our Chinese Sutai half-sib population [7]. In addition, GPR7 is important for maintaining long-term energy homeostasis and has been implicated to play a role in human obesity development [22].
SSC7
Chromosome 7 harbors one QTL for BH, BL, BW, and CBC. The top SNP MARC0058766 for CBC with the genome-wide significance level was close to the gene high mobility group AT-Hook 1 (HMGA1). HMGA1 is one member of the high mobility group A family. HMGA1/HMGA2 double knock-out mice is smaller than only the HMGA1 knock-out mice, implicating that HMGA1 has a determination on body size [23]. A study showed that HMGA1 can serve as a mediator of glucose disposal by regulating the activity of insulin-like growth factor 1 [24]. HMGA1 has been considered as a candidate gene for limb bone length in a Large White×Minzhu intercross population [25].
SSC17
On SSC17, we detected 2 and 27 SNPs in the region from 65 Mb to 70 Mb that were significantly associated with BL and HC respectively. The GWA top SNP MARC0037499 for HC resides at 65.44 Mb, nearby the PCK1 gene. PCK1 was found to be associated with diabetes and obesity [26]. It plays an important role in maintaining the lipid metabolism and glucose homeostasis and disease prevention [27]. Additionally, BMP7 is located 601Kb away from the peak SNP. This gene is a member of the transforming growth factor-β (TGF-β) family, which stimulates the differentiation of osteoblasts from mesenchymal stem cells both in vitro and in vivo [28]. It is also involved in the formation and development of numerous organs [29,30]. So we propose PCK1 and BMP7 as promising candidate genes for BL and HC.
CONCLUSION
This GWA study identified a total of 690 SNPs significantly associated with 8 body dimension traits and body weight. We confirmed the QTL for CBC on SSC7, for which HMGA1 has been considered as candidate gene. Another 22 QTLs for these traits have been reported for the first time. There were three QTLs reaching genome-wide significance including one QTL for both BW and CBC, one for BW and one for HC. In addition, a set of candidate genes adjacent to the GWA signals were proposed here due to their functional relationships with the corresponding traits. These results will advance our understanding of the genetic basis of body dimension and body weight traits in pigs.
ACKNOWLEDGMENTS
The study was supported by the Development Programs for Basic Research of China (973 Programs, No. 2014CB160311) and the Key Project of National Nature Science Foundation of China (No. 31230069).
Notes
CONFLICT OF INTEREST
We certify that there is no conflict of interest with any financial organization regarding the material discussed in the manuscript.