Evaluation of available energy and total tract digestibility of acid-hydrolyzed ether extract of cottonseed oil for growing pigs by the difference and regression methods
Article information
Abstract
Objective
The objective of this study was to determine the effect of inclusion level on the digestible energy (DE), metabolizable energy (ME), and total tract digestibility of acid-hydrolyzed ether extract (AEE) of cottonseed oil when fed to growing pigs.
Methods
Forty-two barrows (initial body weight = 35.51±2.01 kg) were randomly allotted to a completely randomized design with a corn-soybean meal basal diet, five levels of cottonseed oil (2%, 4%, 6%, 8%, and 10%) and a 10% soybean oil diet. Each diet was replicated six times with one pig per replicate. The experiment lasted 19 days, 7 d for cage adaptation, 7 d for diets adaptation and last 5 d for feces and urine collection. The energy values and apparent total tract digestibility (ATTD) of cottonseed oil and soybean oil were calculated by the difference method, and regression equations were established to predict the energy values of cottonseed oil. The apparent digested fat of the entire intestinal tract was also regressed against dietary fat intake to determine the true total tract digestibility (TTTD) and endogenous loss of fat for cottonseed oil.
Results
The results showed that the DE and ME contents of cottonseed oil were not different as the inclusion level increased. The DE and ME values determined by the regression equation were 36.28 MJ/kg and 34.96 MJ/kg, respectively, and the values were similar to the mean DE and ME values calculated by the difference method (36.18 and 35.56 MJ/kg, respectively). The ATTD of cottonseed oil was also not affected by the inclusion level of cottonseed oil, and the TTTD and EFL determined by the regression method were 92.40% and 13.83 g/kg of dry matter intake for corn-soybean basal diet. The DE, ME, and ATTD of AEE in soybean oil determined by the difference method were 35.70 MJ/kg, 35.20 MJ/kg and 92.31%, respectively. There were no differences in the DE, ME, and ATTD between cottonseed oil and soybean oil, although the ratio of unsaturated to saturated fatty acids for soybean oil was higher than for cottonseed oil.
Conclusion
The DE, ME, and ATTD values of cottonseed oil were not affected by its dietary inclusion level. The energy values of cottonseed oil determined by the difference and regression methods were similar. Furthermore, the ratio of unsaturated to saturated fatty acid for oils was not the decisive factor to influence the energy values and ATTD of oils.
INTRODUCTION
Lipids as an energy feed ingredient are widely used in livestock production, and their energy value is about 2.25 times higher than carbohydrates [1]. However, the various lipids had different energy values as a result of different ratio of unsaturated to saturated fatty acids [2]. Cottonseed oil is one of the alternative oil resources because it contains large amounts of essential fatty acids to meet nutrients requirement when provided to pigs. However, the published energy values of cottonseed oil for growing pigs differ between countries and areas of the world [3,4]. The digestible energy (DE) and metabolizable energy (ME) values for cottonseed oil ranged from 32.4 to 36.0 MJ/kg and from 31.6 to 35.3 MJ/kg respectively. These diverse results may result from different determination methods and inclusion levels of cottonseed oil in studies.
The addition of oils can improve the digestibility and utilization of other nutrients in diets [5–8]. Currently, the available energy of oils has been determined by the difference and regression methods because oils cannot be fed to pigs directly. However, the energy values of oil calculated from regression method can be influenced by the interaction between oils and basal diet at low or high inclusion levels [9–11]. According to the calculation formula of difference method, the increment of the determined energy values of diet, due to the improvement of the digestibility of nutrients in diet, can be added to the energy values of cottonseed oil. And if the addition of cottonseed oil is low, it will increase the coefficient of variation within repeated treatments [12]. Furthermore, in some previous studies, the apparent total tract digestibility (ATTD) of oils would change as the inclusion level increased [13,14]. This phenomenon may result from the endogenous loss of fat (ELF) in gastro-intestine, and it can be avoided by evaluating the true total tract digestibility (TTTD) of oils.
Accordingly, the inclusion level and determination methods might influence the energy values of cottonseed oil. Hence, the objective of the present study was to determine the effect of the inclusion levels on the DE and ME values of cottonseed oil using the difference method and evaluate the ELF and TTTD for cottonseed oil by the regression equation.
MATERIALS AND METHODS
The China Agricultural University Laboratory Animal Welfare and Animal Experimental Ethical Inspection Committee (Beijing, China) reviewed and approved all protocols used in this experiment.
Animals and housing
Forty-two barrows (Duroc×Landrace×Yorkshire; initial body weight 35.51±2.01 kg) were individually housed in stainless-steel metabolism crates (1.4×0.7×0.6 m) at the Fengning Swine Research Unit of China Agricultural University (Chengde). Barrows were provided ad libitum access to water and were fed a daily amount of feed equivalent to 4% of BW determined at the beginning of experiment, divided equally into 2 feedings provided at 0900 and 1600 h. The amount of feed provided was recorded at each feeding time. Leftover feeds were removed and weighed for each pig and daily feed consumption was calculated. The room temperature was maintained at 22°C±2°C to meet the environmental needs of the pigs.
Experimental diets
Cottonseed oil and Soybean oil that were used in the present study were food-grade three and four lipids respectively, and their fatty acid composition was analyzed (Table 1). Food grade three oils had more complex processing technology than grade four. Seven diets were formulated with replacing the portion of the basal diet providing energy (Table 2) [15]. The basal diet was based on corn and soybean meal. Five additional diets were formulated by replacing 2%, 4%, 6%, 8%, and 10% basal diet with cottonseed oil, and the last diet was formulated by replacing 10% of the basal diet with soybean oil. Vitamins and minerals were included in all diets to meet or exceed the nutrient requirements of growing pigs [3].

Fatty acid composition of cottonseed oil and soybean oil (% of total fatty acids; as-fed basis)
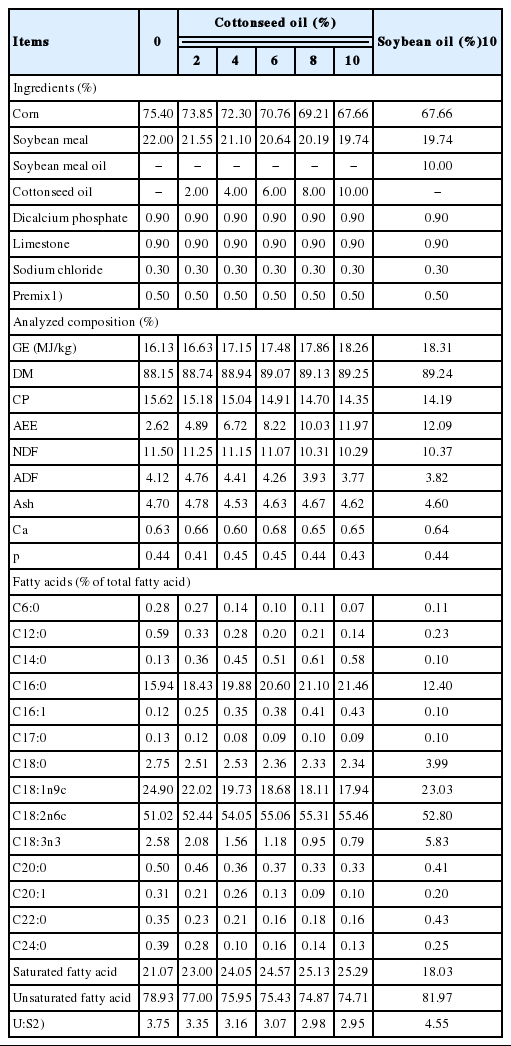
Ingredients and chemical analysis of experimental diets (% as-fed basis)
Experimental design and sample collection
Forty-two barrows were randomly allotted to a completely randomized design with 7 diets. Each diet was replicated six times with one pig per replicate. The experiment lasted 19 days, 7 days for cages adaptation, 7 days for diets adaptation and last 5 days for feces and urine collection using the time to time method.
Samples of diets and ingredients were collected and stored at −20°C until needed for analysis. During the 5-d collection period, all fresh feces were collected into plastic bags and stored at −20°C. At the end of experiment, the 5 d of fecal production from each pig was pooled and weighed and a 350 g sample was taken and dried in a forced-draft oven at 65°C for 72 h. After drying and grinding, subsamples were stored at −20°C for further chemical analysis. Total urine was collected into plastic buckets attached to funnels located under the metabolism cages at the same time as the fecal collection. Approximately 50 mL of 6 N HCl were added to the buckets to limit microbial growth and reduce loss of ammonia. Urine volume was recorded daily and a subsample of 10% of the urine excreted from each pig was collected and stored at −20°C. At the end of the collection period, urine samples were pooled for each pig and a subsample (about 45 mL) was saved for further analysis.
Chemical analyses
Cottonseed oil and soybean oil and all diets were analyzed for the content and type of fatty acid (6890 series, Agilent Technologies, Wilmington, DE, USA). All diets and fecal samples were analyzed for dry matter (DM; method 930.15; AOAC International, 2007), crude protein (CP; method 990.03; AOAC International, 2007), ash (method 942.15; AOAC International, 2007), acid-hydrolyzed crude fat extract ether (AEE; method 2003.06; AOAC International, 2007), acid detergent fiber (ADF; method 973.18; AOAC International, 2007), neutral detergent fiber (NDF; Van Soest et al., 1991). The concentration of gross energy (GE) in diets and in urine and fecal samples was determined using an isoperibol bomb calorimeter (model 6300, Parr Instruments, Moline, IL, USA).
Calculation
The ATTD of AEE, DM, organic matter (OM), NDF, ADF, and CP was calculated by total urine and feces collection method for each diet. The TTTD of cottonseed oil was calculated using the regression method. The apparent digested fat (g/kg of DM intake, DMI) of the entire intestinal tract was regressed against dietary fat intake (g/kg DM) for each pig. The slope of the regression line represented the TTTD of AEE, with the y-intercept of this regression equation being considered the ELF of AEE (g/kg of DMI). The DE, ME, and ATTD values of cottonseed oil were calculated according to the difference method [16]. Because the proportion of the energy-yielding ingredient (EYI) in basal diet was 0.974, the energy concentration of EYI was calculated by dividing the DE or ME of both the basal diets by 0.974 to calculate the DE and ME in the energy-contributing ingredients (corn and soybean meal) according to Widmer et al [17].
Statistical analyzed
Data were analyzed using the MIXED procedure of SAS (SAS Institute Inc., Cary, NC, USA). The individual animal and individual pig were the experimental units for analyzing the data from the digestibility trial. The UNIVARIATE procedure of SAS was used to check normal distribution of model residuals and equal variances. The residual versus the predicted plot procedure was used to identify outliers. The model included the inclusion level of cottonseed oil for all measurements. Orthogonal polynomial contrasts were used to detect linear and quadratic responses to inclusion level of cottonseed oil. The REG procedure of SAS was used to estimate the Y-intercept of the regression line for determining endogenous loss of AEE, and the slope was used to determine the TTTD for AEE for cottonseed oil. The level of significance adopted was 5% (p<0.05) to assess differences among means.
RESULTS
All pigs remained healthy and readily consumed their diets. Both feces and urine were successfully collected from all pigs.
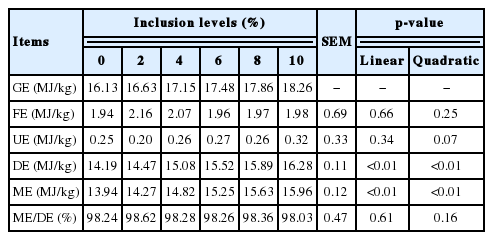
The DE and ME contents of experimental diets increased (linear and quadratic, p<0.01) with increasing cottonseed oil inclusion level (Table 3). There were no difference in the fecal energy, urine energy and the ratio of ME:DE in diets as the inclusion level of cottonseed oil increased.
The ATTD of AEE was significantly (p<0.01) affected by the inclusion level of cottonseed oil (Table 4). The ATTD of nutrients in diets containing a high inclusion level cottonseed oil were higher than that of diets containing the low inclusion level cottonseed oil. There was a trend (p = 0.07) for quadratic increase in the ATTD of GE with inclusion levels of cottonseed oil.

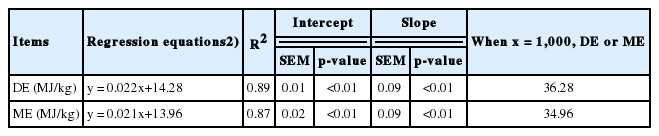
The DE and ME contents and ATTD of cottonseed oil determined by the difference method were not significantly affected by the inclusion level of cottonseed oil (Table 5). The mean of DE, ME, ME:DE ratio and ATTD of cottonseed oil were 36.08 MJ/kg, 35.48 MJ/kg, 98.34%, and 90.66%, respectively. The DE and ME contents of cottonseed oil determined by regression method were 36.28 MJ/kg and 34.96 MJ/kg respectively (Table 6). The intercepts and slopes were both significant (p<0.01) in DE and ME regression equations of cottonseed oil.

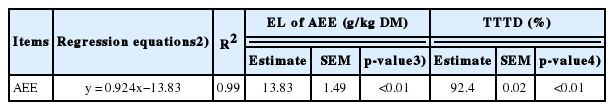
The regression of total tract digested fat (g/kg DM) against the intake of fat (g/kg DMI) was significant (p<0.01, R2 = 0.99). The intercepts and slopes were both significant (p<0.01) in regression equations of cottonseed oil (Table 7). The y-intercept that represented the endogenous loss of AEE for cottonseed oil was 13.83 g/kg of DMI for corn-soybean basal diet. The value of TTTD of cottonseed oil that calculated according to the slope of regression equation was 92.40%.
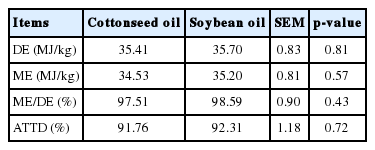
The ATTD of NDF and ADF for pigs when fed the diet containing 10% cottonseed oil (64.49% and 69.16%, respectively) were significantly higher (p<0.05) than those for pigs fed the diet containing 10% soybean oil (56.68% and 61.52%, respectively). There were no differences in the DE, ME, ME:ME ratio and ATTD of GE, CP, OM, and AEE between 10% cottonseed oil and 10% soybean oil diets (Table 8).

The DE, ME, ME:DE ratio and ATTD of soybean oil determined by the difference method were 35.70 MJ/kg, 35.20 MJ/kg, 98.59%, and 92.31% respectively (Table 9). There was also no difference in the DE, ME, ME:DE ratio, and ATTD of soybean oil and cottonseed oil when pigs were fed the diets containing either 10% soybean oil or 10% cottonseed oil.
DISCUSSION
Energy value of cottonseed oil
In the present study, the 2% inclusion level was not used to analyze the effect of inclusion level on the DE and ME contents of cottonseed oil determined by the difference method because at least two outliers were present in the 2% inclusion level treatment for DE and ME of cottonseed oil. The coefficient of variation of the DE and ME values of cottonseed oil ranged from 40% to 50% when pigs were fed the diet containing 2% cottonseed oil, which probably resulted from the difference method. The coefficient of variation of the DE and ME values within replications decreased inversely as the inclusion level of cottonseed oil increased. The result agreed with Villamied [12] and Su et al [4] who determined the energy values of soybean oil. Accordingly, it was irrelevant to determine the DE and ME of oils used the diet containing 2% cottonseed oil by the difference method. However, a high substitution rate can improve the accuracy of energy determination, but it can cause a nutrient imbalance and influence the nutrient digestibility in diet [12]. Consequently, it is necessary to conduct further studies to verify the optimal inclusion level of lipids in diets.
The mean of energy values calculated by the difference method were similar to the recommended values in NRC [3]. However, the energy values of cottonseed oil in this experiment were lower than previous study [3]. The reasons for these different results among experiments may be the type of basal diet and the inclusion level. Furthermore, the DE and ME values of the cottonseed oil decreased inversely as the inclusion level of cottonseed oil increased. However, Adeola et al [18] and Su et al [4] reported that the DE and ME values of soybean oil and palm oil increased as the inclusion level of soybean oil and palm oil. Those different results may be due to the different ratio of unsaturated to saturated fatty acids in various lipid sources. The concentration of unsaturated fatty acids in diets decreased as the inclusion level of cottonseed oil increased, and this may result in the energy values of cottonseed oil decreasing.
The DE and ME values of cottonseed oil derived from the regression equation were not different from the mean values determined by the difference method. Su et al [4] also showed a similar result for palm oil. However, some previous studies showed that the regression equation may overestimate the energy values of oils more than the difference method [19,20]. These different results may be caused by the different compositions and resources of oils among experiments.
The endogenous losses of AEE and total tract digestibility for cottonseed oil
In previous studies, the results of ELF for oils determined by the regression equation varied considerably and ranged from 3.77 g/kg to 22.4 g/kg, in corn oil [13,14,21], soybean oil [22] and palm oil [4]. In the present study, the total tract ELF value for cottonseed oil was 13.83 g/kg. The difference in ELF for single oils may not only be due to the oil sources, but also the type of basal diet [14]. Previous studies showed that fiber was beneficial to the synthesis of fat, produced by microflora in the hindgut [23,24]. Accordingly, dietary fiber may affect the total tract ELF for oils [25,26].
A decreasing tendency in the ATTD of AEE was observed with an inclusion level of cottonseed oil except for the 10% inclusion level. It indicated that ELF for cottonseed oil would increase as the inclusion level increased. The result was in agreement with research in palm oil [4]. However, the result was against with some studies in soybean oil [27], corn oil [13] and rapeseed oil [22]. The different observations may have resulted from the different ratio of unsaturated to saturated fatty acids in various lipids [28]. As same as palm oil, cottonseed oil has a low ratio of unsaturated to saturated fatty acids, and the concentration of unsaturated fatty acids in diets decreased as the inclusion level increased. This may be the reason that the ATTD of cottonseed oil decreased as the inclusion level increased.
It was a tendency that the digestibility of OM, GE, CP, and AEE increased as the inclusion level of cottonseed oil increased. A similar trend was found in the study of Su et al [4] and Jørgensen and Fernandez [6] where higher inclusion levels of soybean oil improved the digestibility of nutrients in diets. These results indicated that a high inclusion level of oils may reduce the rate of digesta passage, which may result in more complete digestion and utilization of the diet [29].
Energy values and ATTD of soybean oil
In the present study, the energy values of soybean oils determined by the difference method were consistent with the observation of Kerr et al [30], but were lower than the determined values by NRC [3], Su et al [4] and Wiseman et al [9]. Those different results may be caused by the different type of basal diet and the levels of soybean oil in the research.
Previous research showed that there was a positive correlation between the ratio of unsaturated to saturated fatty acids and the energy values of oils [9,10], and the DE and ME values increased as the ratio of unsaturated to saturated fatty acids increased. However, in this study, the ratio of unsaturated to saturated fatty acids in soybean oil was 5.11 and in cottonseed oil was 2.79, but there were no differences in the DE and ME values and the ATTD of oils determined by the difference method. The result was similar to previous studies [6,27,30]. These studies indicated that the energy values and ATTD of lipids are not only determined by the ratio of unsaturated to saturated fatty acids of oils. Some previous studies showed that the energy values and ATTD of palm oil [6] and soybean oil [10] decreased as the free fatty acid (FFA) increased. The soybean oil and cottonseed oil used in the present study were food grade three and four respectively, and the FFA level was higher in soybean oil than in cottonseed oil. This may be the reason that there was no difference in the energy values and ATTD between soybean and cottonseed oils, although the ratio of unsaturated to saturated fatty acids in soybean oil was higher than in cottonseed oil.
ACKNOWLEDGMENTS
This research was financially supported by the National Natural Science Foundation of China (31372316) and the 111 Project (B16044).
Notes
CONFLICT OF INTEREST
We certify that there is no conflict of interest with any financial organization regarding the material discussed in the manuscript.