Effect of dietary protein sources on production performance, egg quality, and plasma parameters of laying hens
Article information
Abstract
Objective
This study was conducted to evaluate the effects of dietary protein sources (soybean meal, SBM; low-gossypol cottonseed meal, LCSM; double-zero rapeseed meal, DRM) on laying performance, egg quality, and plasma parameters of laying hens.
Methods
A total of 432 32-wk-old laying hens were randomly divided into 6 treatments with 6 replicates of 12 birds each. The birds were fed diets containing SBM, LCSM100, or DRM100 individually or in combination with an equal amount of crude protein (CP) (LCSM50, DRM50, and LCSM50-DRM50). The experimental diets, which were isocaloric (metabolizable energy, 11.11 MJ/kg) and isonitrogenous (CP, 16.5%), had similar digestible amino acid profile. The feeding trial lasted 12 weeks.
Results
The daily egg mass was decreased in the LCSM100 and LCSM50-DRM50 groups (p<0.05) in weeks 41 to 44. The LCSM50 group did not affect egg production compared to the SBM group in weeks 41 to 44 (p>0.05) and showed increased yolk color at the end of the trial (p<0.05). Compared to the SBM group, the LCSM100 and LCSM50-DRM50 groups showed decreased albumen weight (p<0.05), CP weight in the albumen (p<0.05) and CP weight in the whole egg (p<0.05) at 44 weeks. Plasma total protein (TP) levels were lower in the LCSM100 group than in the SBM group at 44 weeks (p<0.05); however, TP, albumin, and globulin levels were not significantly different between the LCSM50 group and the SBM group or between the DRM50 group and the SBM group (p>0.05).
Conclusion
Together, our results suggest that the LCSM100 or DRM100 diets may produce the adverse effects on laying performance and egg quality after feeding for 8 more weeks. The 100.0 g/kg LCSM diet or the148.7 g/kg DRM diet has no adverse effects on laying performance and egg quality.
INTRODUCTION
Soybean meal (SBM) is the most widely used protein source in the formulation of laying hen diets. To decrease dependence on SBM, it is essential to explore potential SBM alternatives. Cottonseed meal (CSM) and rapeseed meal (RSM) have long been considered attractive alternative protein sources for poultry diets [1,2], but anti-nutritional factors (i.e., free gossypol [FG] and glucosinolate) and the relatively low digestibility of their essential amino acids (AAs) limit their utilization [1,3]. The concentration of nutrients and anti-nutritional factors in CSM and RSM depend on the type of meal, method of oil extraction, ratio of kernel to husk, lint, and seed coat [4,5]. Numerous studies have been conducted to evaluate the optimum levels of these plant protein ingredients as partial substitutes for SBM in poultry diets without adverse effects on layers. Previous studies found a different effect of dietary CSM level on laying hens. Panigrahi et al [6] reported that egg production (EP) was not reduced until CSM reached 300 g/kg (255 mg/kg FG), and Gilani et al [7] concluded that 200 g CSM/kg diet had negative effects on EP, egg weight (EW), daily egg mass (DEM) and yolk color.
Refined production of CSM, which is conducted without high-temperature heating, greatly reduces the levels of husk and maintains nutrient density. Moreover, de-gossypolization highly decreases FG levels [2]. Compared to traditional CSM, low-gossypol cottonseed meal (LCSM) contains higher levels of crude protein (CP) (43.5% and 51.1%), metabolizable energy (ME) (8.49 MJ/kg and 9.04 MJ/lg), Lys (1.97% and 2.26%), Thr (1.25% and 1.60%), Met (0.58% and 0.86%), Cys (0.68% and 1.04%), and Arg (4.65% and 6.08%) [8]. Double-zero rapeseed meal (DRM) contains low levels of anti-nutritional factors and has a well-balanced AA composition comparable to that of SBM, especially with regard to sulfur-containing AAs [4]. However, most studies on DRM have mainly focused on broilers [9]. LCSM and DRM might be attractive alternatives to SBM in laying hens’ diets. It is very important to understand how to improve the utilization of dietary nutrients formulated with these plant proteins. Therefore, the objective of this study was to investigate the effects of three plant proteins with the same digestible AA profile on EP, egg quality, and selected plasma characteristics.
MATERIAL AND METHODS
Animal care
This study was approved by the Animal Care and Use Committee of the Feed Research Institute of the Chinese Academy of Agricultural Sciences, Beijing. Four hundred and thirty-two laying hens 32 weeks of age were obtained from a commercial farm (Jinghong I laying hens, China) and housed in 144 metal cages (55 cm×40 cm×40 cm), with three birds each. Each replicate consisted of four adjoining metal cages, and 36 replicate hens were randomly allocated to one of six groups. Ambient temperature and humidity in the barn were maintained at 14°C±2°C and 50% to 65%, respectively. The lighting was consistent with conventional commercial operation. The hens were exposed to a 16-h photoperiod throughout the experiment. The animals had ad libitum access to feed and water.
Feed preparation
The SBM (Sanhe Hopefull Grain & Oil Group Co., Ltd., Hebei, China), LCSM (Shandong Futai Grain & Oil Group Co., Ltd., Shandong, China, FG: 302.54 mg/kg), and DRM (Fuzhou Jijia Oils & Fats Co., Ltd., Fujian, China, isothiocyanate: no detected; oxazolidine thioketone: 0.34 mg/g), were obtained from commercial suppliers. The FG, isothiocyanate, and oxazolidine thioketone were analyzed according to the method of AOCS [10].
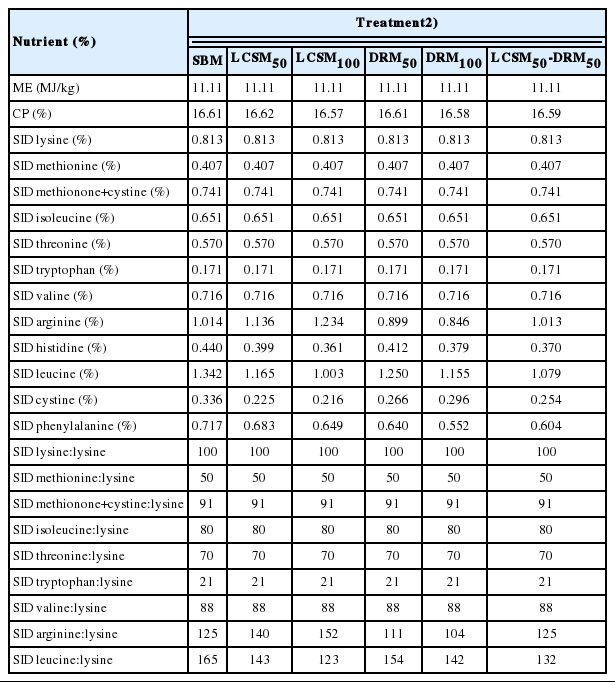
The treatment groups were given feed containing SBM, LCSM100, or DRM100 individually or in combination with equal CP content (LCSM50, DRM50, and LCSM50-DRM50). Briefly, four experimental groups were fed a basal diet supplemented with 100.0 g/kg LCSM, 187.0 g/kg LCSM, 148.7 g/kg DRM, or 292.0 g/kg DRM, which corresponded to 50% (LCSM50), 100% (LCSM100), 50% (DRM50), and 100% (DRM100), respectively, of the SBM dietary protein replaced by LCSM or DRM. A fifth experimental group was fed a diet containing 99.2 g/kg LCSM and 135.2 g/kg DRM (LCSM50-DRM50). The control group was fed a corn-SBM diet (SBM). The experimental diets, which were provided in mash form, were isocaloric (ME, 11.11 MJ/kg) and isonitrogenous (CP, 16.50%) to meet the NRC [11] recommendations. Each experimental diet was supplemented with crystalline methionine (Met), lysine (Lys), tryptophan (Trp), threonine (Thr), isoleucine (Ile), valine (Val), cystine (Cys), and arginine (Arg) to meet the digestible amino acids (Dig AAs) profile [12]. Corn, SBM, LCSM, DRM and experimental diets were analyzed for Ca, P, CP, and total AAs prior to feed preparation and prior to feeding trial, respectively. The levels of supplemental AAs were predicted based on standardized ileal digestible (SID) AA results, according to the SID AA coefficients provided by AminoDat 4.0 [13]. The CP, Ca, and P were analyzed according to the Association of Official Analytical Chemists methods [14]. The AA analysis was performed by Evonik Industries AG Laboratories (Beijing, China). Nutrient analyses (including total AAs and SID AAs) of protein ingredients are shown in Table 1, and the composition and nutrient levels of the experimental diets are presented in Table 2 and 3.

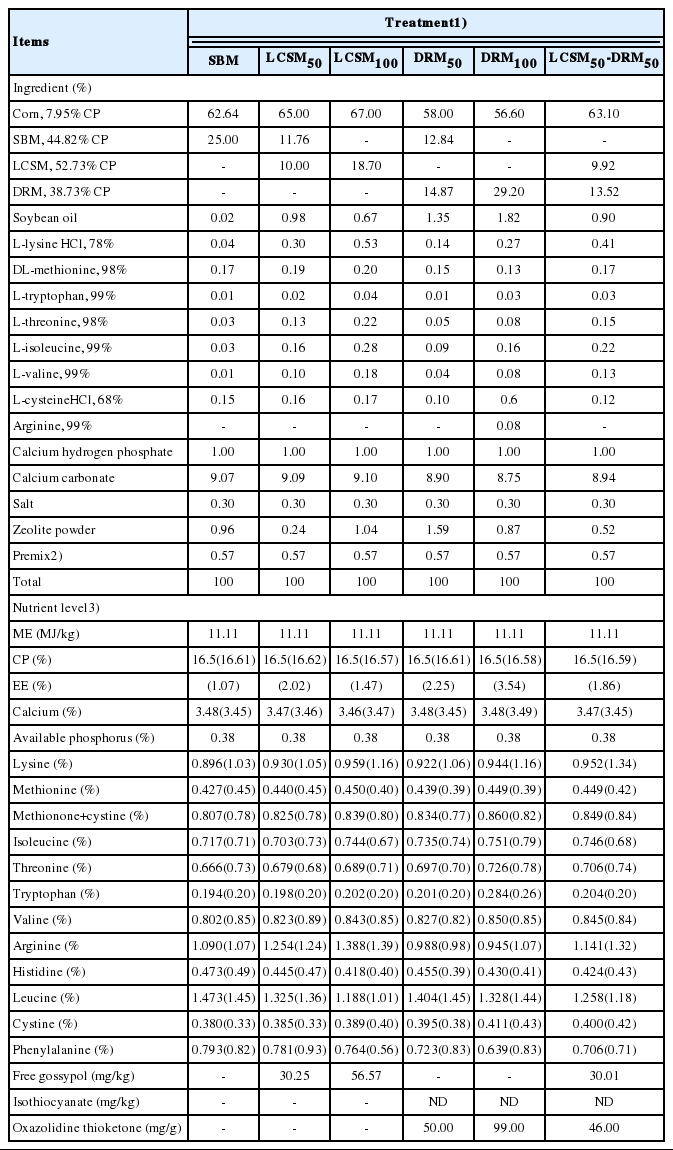
Composition and nutrient levels of the experimental diets for laying hens (as-fed basis)
Laying performance
Eggs were collected each day. The number and total weight of eggs, the number and weight of large eggs (>70.0 g) and small eggs (<50.0 g) and the number of broken and shell-less eggs (i.e., abnormal eggs) were recorded. Biweekly feed consumption was determined. The EW was calculated as the mean weight of total eggs except for oversized or subminiature eggs. The feed conversion ratio (FCR) was calculated as feed consumption (g) divided by egg mass (g). Daily feed intake (DFI) and DEM were adjusted by mortality rate and calculated as DFI = feed consumption (g)/(number of hens×d) and DEM = total EW (g)/(number of hens×d). In this study, EP, DFI, DEM, EW, FCR, and abnormal egg ratio (AER) were calculated in weeks 33 to 36, 37 to 40, and 41 to 44. The laying performance was evaluated starting at 33 weeks of age and continued for 12 weeks.
Egg quality
At the end of weeks 36, 40, and 44, three eggs from each replicate with EW close to the replicate average were collected for interior and exterior quality tests. The shape index was calculated according to the formula shape index = (height [mm]/width [mm])×100. Eggshell breaking strength was evaluated (Orka Technology Ltd, Ramat Hasharon, Israel). Eggshell thickness was measured at the large end, equator, and small end (ESTG-1, Orka Technology Ltd, Ramat Hasharon, Israel). Eggshell toughness was measured according to the methods reported by Ahmed et al [15]. Albumen height, Haugh unit (HU), and yolk color were determined (Orka Food Technology Ltd, Ramat Hasharon, Israel). After the yolk was separated from the albumen, albumen pH was measured with a pH meter (Testo 205, Lenzkirch, Germany) after thoroughly mixing both thick and thin albumen.
At the end of the feeding trial, two eggs from each replicate with EW close to the replicate average were collected for egg components tests. Briefly, each egg was individually weighed and broken, and the yolk was separated from the albumen. Yolk weight was determined after the chalaza was removed with forceps. Each yolk was rolled on a paper towel to remove adhering albumen. The eggshells were washed, air-dried, and weighed. Albumen weight was calculated by subtracting the yolk and shell weights from the whole EW. The yolk and albumen were thoroughly mixed, and the yolk and albumen total solid contents were measured according to the Association of Official Analytical Chemists methods [14]. In addition, the other two eggs were collected from each replicate at the end of week 12 to measure whole liquid egg. The whole liquid egg was thoroughly mixed, and the liquid egg solid content was measured as reported above. The CP in the dried sample (albumen, yolk, and whole egg) was determined by the Kjeldahl method [14], and the nitrogen-to-protein conversion factor was 6.25. The CP content in albumen (yolk or whole egg) was calculated according to the following formula: CP in albumen (yolk or whole egg) (g) = albumen (yolk or whole egg) weight×CP (%).
Plasma biochemistry
At the end of weeks 36, 40, and 44, blood was collected from the wing vein of one laying hen per replicate and centrifuged at 3,000×g for 10 min. The resulting plasma was stored at −20°C. Total protein (TP), creatinine (CRE), uric acid (UA), albumin (ALB), alanine aminotransferase (ALT), and aspartate aminotransferase (AST) levels in plasma were analyzed in an automatic biochemical analyzer (Model 7020, Hitachi, Tokyo, Japan). Globulin (GLB) was calculated by subtracting the ALB from TP.
Statistical analysis
Data were analyzed by one-way analysis of variance using the general linear model procedure in SPSS 19.0 (SPSS Inc., Chicago, IL, USA) in a complete randomized design. The model included only dietary protein sources. Four cages were considered to be one experimental unit. When significant differences were found a 5% of variance average was used, with a Duncan’s multiple range tests for comparisons among the groups. Data are presented as the mean±standard error of the mean. Statistical significance was set at p<0.05.
RESULTS
Laying performance
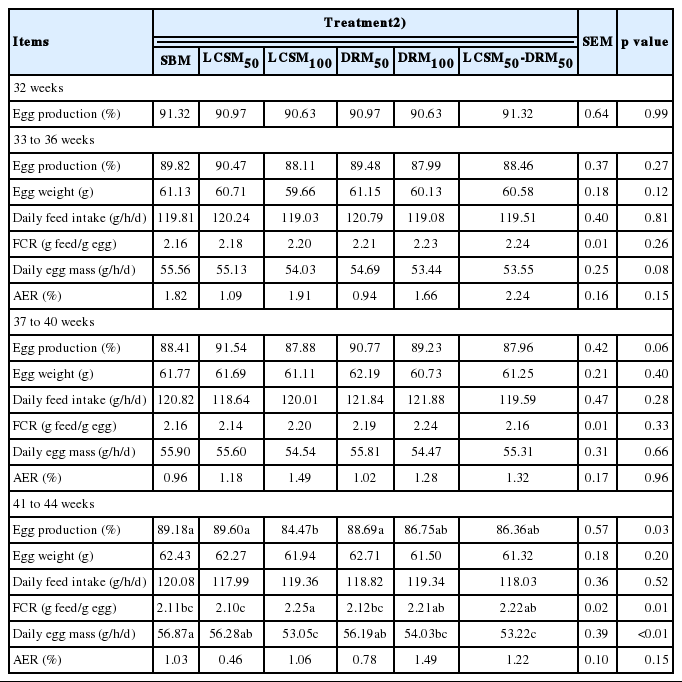
During the feeding trial, no animal displayed obvious signs of clinical illness. The effects of different dietary proteins on laying performance are presented in Table 4. At the beginning of the experiment, there were no significant differences in EP among the groups (p>0.05). The replacement of SBM by LCSM or DRM did not affect the EP, EW, DFI, FCR, DEM, or AER in weeks 33 to 36 or weeks 37 to 40 (p>0.05). In weeks 41 to 44, dietary protein significantly affected EP (p = 0.03), FCR (p = 0.01), and DEM (p<0.01). The LCSM50 and DRM50 groups had EP, FCR, and DEM values similar to those of the SBM group (p>0.05). Compared to SBM, LCSM100 had lower EP (p<0.05), FCR (p<0.05), and DEM (p<0.05) values.
Egg quality
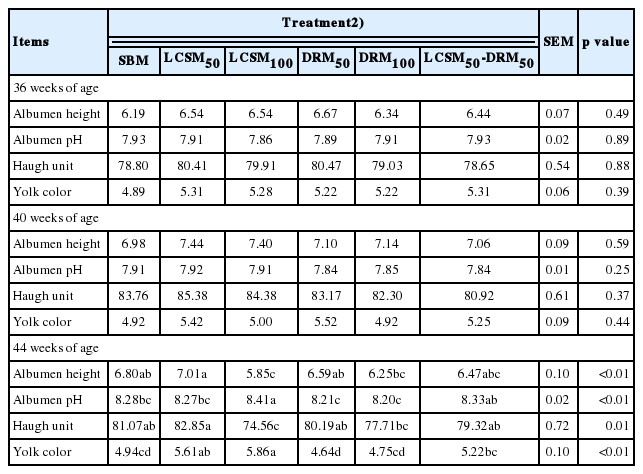
In weeks 36, 40, and 44, there were no significant differences in eggshell quality among the groups (p>0.05, Table 5). The overall egg internal quality was not significantly different among the groups in weeks 36 and 40 (p>0.05, Table 6). However, at the end of the feeding trial, there were distinct differences in albumen height (p<0.01), albumen pH (p<0.01), HU (p = 0.01), and yolk color (p<0.01) among the groups. Compared to LCSM100, LCSM50, and DRM50 improved albumen height (p<0.05) and HU (p<0.05) and decreased albumen pH (p<0.05). The LCSM100 group had lower albumen quality (i.e., albumen height, albumen pH, and HU, p<0.05) than the SBM-containing groups. The yolk color values in the LCSM100 and LCSM50 groups were increased than that of the SBM group (p<0.05).

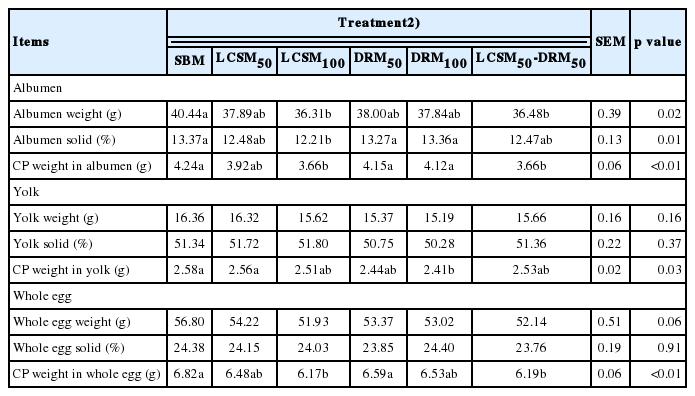
There were also significant differences in albumen weight (p = 0.02), albumen solid content (p = 0.01), and CP weight in albumen (p<0.01) among the groups (Table 7). Compared with the SBM group, LCSM100 treatment decreased albumen weight, albumen solid, and CP weight in albumen (p<0.05). The LCSM50 and DRM50 groups had similar albumen components as those in the SBM group (p>0.05). The dietary protein sources did not affect yolk weight or yolk solid content (p>0.05) but did affect the CP weight in yolk (p = 0.03, Table 7). Compared to the SBM and LCSM50 groups, the DRM100 group had reduced CP weight in the yolk (p<0.05). There was no significant difference in CP weight in the yolk between the LCSM50 and SBM groups (p>0.05). The CP weight in the whole egg was affected by the dietary protein sources (p<0.01, Table 7). The LCSM50 and DRM50 groups had whole egg components similar to those in the SBM group (p>0.05). Compared to the SBM treatment, the LCSM100 and the LCSM50-DRM50 groups had decreased CP weight in the whole egg (p<0.05).
Plasma biochemistry
As shown in Table 8, plasma parameters were determined in weeks 36, 40, and 44. Plasma levels of AST, ALT, TP, ALB, GLB, UA, and CRE were not different among the groups in weeks 36 and 40 (p>0.05). At the end of week 44, there were significant differences among the groups in TP (p = 0.02), ALB (p = 0.04), and GLB (p = 0.03) levels. Plasma TP levels were lower in the LCSM100 group compared to the SBM group at the end of week 44 (p<0.05, Table 8); however, plasma levels of TP, ALB, and GLB were not significantly different between the LCSM50 and the SBM groups or between the DRM50 and the SBM groups (p>0.05).

DISCUSSION
LCSM is a deep-processed product of CSM with slightly better nutritional value (i.e., CP and total AA) than that of SBM has [8]. Compared to ordinary RSM, DRM is low in erucic acid and glucosinolate. Additionally, DRM has been used in livestock and poultry feed in Canada, UK, Australia, and USA [4]. No animal from any group displayed clinical signs during the trial period. It was reported that low dietary protein levels decrease egg mass [16]. However, supplementation with crystalline AAs could eliminate this adverse effect on egg mass [17]. Therefore, the negative effect of low protein diets on egg mass may be due to a shortage of the certain AAs. In this study, the diets were supplemented with crystalline Met, Lys, Trp, Thr, Ile, Val, Cys, and Arg [12]. The complete replacement of SBM with LCSM caused adverse effects on egg performance after feeding of 8 weeks. However, at CP contents similar to those of SBM, LCSM, and DRM may be beneficial for egg performance. Our current study was consistent with previous study, which suggested that the EW was decreased when layers were fed 189.0 g/kg LCSM with 28.11 mg/kg FG under the same Dig AA profiles [2]. One reason for the egg mass reduction was likely due to the difference in the content of SID Arg, phenylalanine (Phe), histidine (His), and leucine (Leu) between certain diets (i.e., LCSM100, DRM100, and LCSM50-DRM50) and the SBM group (Table 3). AA profile may alter the expression of AA transporters [18]. Dietary AAs reach extra-intestinal tissues after being absorbed by the small intestine, and the transport of these nutrients is a key regulatory step in utilization of dietary protein [19,20]. The SID Arg:Lys ratio in the LCSM100 group was higher than that in the SBM group (152 and 125), and excessive Arg could not be eliminated in the LCSM group given the CP level. An antagonism between Arg and Lys is well documented in poultry [21]. The SID Leu:Lys ratio in the LCSM100 group was lower than that in the SBM group (123 and 165), and Leucine, as a branched-chain AA, plays a critical role in protein synthesis and degradation [22]. The shortage of Leu in the LCSM diet might adversely affect protein synthesis in this study. Additionally, the other anti-nutritional factors or the combination of fiber types [23] may contribute to egg mass reduction. Tannins may form complexes with proteins and proteolytic enzymes in the gastrointestinal tract, thereby reducing the digestibility of protein [4], and phytic acid can reduce the digestion and utilization of protein [24].
The complete replacement of SBM by LCSM (FG, 56.57 mg/kg) did not lead to yolk discoloration, our study agrees with those of previous studies [2,25]. Nelson [25] reported that yolk discoloration was not observed in eggs from hens fed diets containing 125 g/kg CSM (FG, 100 mg/kg), suggesting that 56.57 mg/kg FG is below the FG level that causes yolk discoloration. However, egg yolk color tended to increase with higher levels of LCSM in diet [25], this is agreement with the results of our current study.
Numerous studies indicated that CSM could be used in the diets of laying hens at 100 g/kg (FG level 72 mg/kg) or less without negatively impacting consumer acceptance of the produced eggs, but this diet reduced the Haugh unit (HU) and albumen height of the eggs [26,27]. The HU is important for evaluating internal egg characteristics. The HU, which is calculated from the height of the inner thick albumen and the weight of the egg, reflects the thick ALB content of the egg. The viscosity of the thick white is attributed to the presence of the ovomucin [28], and the HU value is mainly influenced by the egg ovomucin content. Eggs consist of eggshell (9.5%), albumen (63%), and yolk (27.5%) [29]. It was reported that low dietary protein decreased albumen weight and albumen solid due to a reduction in albumen synthesis [16]. There was a remarkable reduction in HU and albumen weight in the LCSM100 group compared to HU and albumen weight in the other groups (except for the DRM100 group) after 12 weeks on experimental feed. This result was consistent with that of a recent study, which suggested that the HU and albumen height were decreased when hens were fed 189.0 g/kg CSM with 28.11 mg/kg FG for 12 weeks [2]. Nevertheless, the reduced HU resulting from the LCSM100 diet was partially ameliorated by SBM. The negative effect of non-traditional plant proteins on albumen quality may be due to an excess or insufficiency of certain Dig AAs (such as Arg, Phe, His, and Leu) or the presence of anti-nutritional factors (i.e., phytic acid and tannin) that affect the digestion of protein and their deposition into albumen (especially ovomucin) in vivo [16,30].
In this study, we measured plasma CRE and UA levels to evaluate kidney function and ALT, AST, GLB, ALB, and TP levels for liver function. Adeyemo [3] reported that 12.97 g/kg cottonseed cake (FG>100 mg/kg) did not affect TP or ALB levels. He et al [2] showed that the reduction in EP and egg quality with LCSM100 diets was not associated with feed containing 28.11 mg/kg FG. In this study, the LCSM100 group (FG, 56.57 mg/kg) had lower plasma TP levels than the SBM group at 44 weeks of age. The TP consists primarily of ALB and GLB. It is possible that LCSM100 altered protein and free amino-acid metabolism [18,22].
CONCLUSIONS
In conclusion, our results yielded important information on the replacement of SBM by LCSM or DRM on laying performance of laying hens and egg quality. Dietary LCSM supplementation of 100.0 g/kg or DRM of 148.7 g/kg is recommended. This supplementation had no adverse effects on laying performance or egg quality, and it may benefit producers to choose alternate sources of dietary protein for laying hens. The use of LCSM or DRM as the sole dietary protein source for laying hens decreased EP and adversely affected on albumen quality after 8 week feeding.
ACKNOWLEDGMENTS
This study was financed by the earmarked fund for Modern Agro-industry Technology Research System (CARS-41-K13), the Agricultural Science and Technology Innovation Program (ASTIP), the China Agriculture Research System – Beijing Team for Poultry Industry, and the National Key Technology Research and Development Program (2014BAD13B04).
Notes
CONFLICT OF INTEREST
We certify that there is no conflict of interest with any financial organization regarding the material discussed in the manuscript.