Genome-wide Association Study (GWAS) and Its Application for Improving the Genomic Estimated Breeding Values (GEBV) of the Berkshire Pork Quality Traits
Article information
Abstract
The missing heritability has been a major problem in the analysis of best linear unbiased prediction (BLUP). We introduced the traditional genome-wide association study (GWAS) into the BLUP to improve the heritability estimation. We analyzed eight pork quality traits of the Berkshire breeds using GWAS and BLUP. GWAS detects the putative quantitative trait loci regions given traits. The single nucleotide polymorphisms (SNPs) were obtained using GWAS results with p value <0.01. BLUP analyzed with significant SNPs was much more accurate than that with total genotyped SNPs in terms of narrow-sense heritability. It implies that genomic estimated breeding values (GEBVs) of pork quality traits can be calculated by BLUP via GWAS. The GWAS model was the linear regression using PLINK and BLUP model was the G-BLUP and SNP-GBLUP. The SNP-GBLUP uses SNP-SNP relationship matrix. The BLUP analysis using preprocessing of GWAS can be one of the possible alternatives of solving the missing heritability problem and it can provide alternative BLUP method which can find more accurate GEBVs.
INTRODUCTION
Pork is the most widely consumed meat, accounting for 50% of daily meat protein intake, globally (Davis and Lin, 2005). Genetic selection using best linear unbiased prediction (BLUP) methodologies, so far, have resulted in a number of successes in improving different pork quality parameters (Leeds, 2005; Sellier, 1998). Various studies have been devoted to the estimation of genetic parameters for pork quality traits to use in selection programs (Leeds, 2005). C.R. Henderson around 1950 developed the mixed model equations involving BLUP (Henderson, 1975; Jiang, 1997).
Genomic selection aims at making selection decisions based on breeding values predicted using genome-wide marker data (Meuwissen et al., 2001). There are two general categories of BLUP methods: GRM-based genomic-best linear unbiased prediction (G-BLUP), and single nucleotide polymorphism (SNP)-best linear unbiased prediction (SNP-BLUP). Genomic relationship matrix (GRM) exploits the elements of the realized proportion of the genome that two individuals share (Legarra et al., 2009; Goddard et al., 2011). The big compromise of G-BLUP and SNP-GBLUP is single nucleotide polymorphism-genomic best linear unbiased prediction (SNP-GBLUP) (Lee et al., 2014b). The breeding values of the SNP-GBLUP are nearly identical to the G-BLUP. However, it predicts the SNP effects of the given traits. It is an approach unlike the single step BLUP (SS-BLUP) which finds the SNP effects iteratively (Fernando et al., 2014).
Genome-wide association study (GWAS) uses genetic variants with traits of interest and it can estimate the p-value of each SNP in a given complex trait (Bolormaa et al., 2013; Lee et al., 2014a). For the analysis of each SNPs’ P-value, we used the PLINK linear regression model (Purcell et al., 2007). Then we used the SNP-GBLUP (Lee et al., 2014b).
The missing heritability has been the problem which must be solved in GWAS and BLUP analyses (Eichler et al., 2010). It indicates that the narrow-sense heritability cannot be achieved satisfactorily in complex diseases and traits with a complex inheritance such as human height (Eichler et al., 2010; Yang et al., 2010). BLUP traditionally uses total genotyped SNPs. However, it has not yet solved the missing heritability problem. We tried to combine the GWAS and BLUP method to complement it. We analyzed the BLUP by using only SNPs with p-value under 0.01 in GWAS.
MATERIALS AND METHODS
Ethics statement
The study protocol and the standard operating procedures (No. 2009-077, C-grade) of Berkshire pigs were reviewed and approved by National Institute of Animal Science’s Institutional Animal Care and Use Committee.
Data preparation
We used data from 702 (365 male, 204 female, 133 castrated male) Berkshire pigs. Animals were raised with the same commercial diet from the Dasan experimental farm in Namwon, Korea. The genomic DNAs of 702 individuals were genotyped using Illumina Porcine 60 K SNP Beadchip (Illumina, San Diego, CA, USA) following the standard protocol. A total number of 44,345 genotyped SNPs were filtered using quality-control processes with MAF (minor allele frequency (MAF) (<0.05), Hardy-Weinberg equilibrium (HWE) (p<0.001) and missing data (>0.01 missing) which resulted 36,896 autosomal SNPs.
A total of 8 meat quality traits were used for the analysis. The traits included carcass weight (CWT), back fat thickness (BF), intramuscular fat content (fat), protein content, Shear force (SF), water holding capacity (WHC) and color (L* and A*). Carcass weight was measured immediately after slaughter. BF and color were measured from the longissimus dorsi muscle between 10th and 11th rib. Intramuscular fat content was measured using chemical fat extraction procedures. WHC (%) was measured as a difference between moisture content (%) and expressible water (EW; %). General indication of lightness and degree of green-redness of meat color were measured referred to Minolta L (MC_L, Commission Internationale de I’Eclairage [CIE] L* color space) and Minolta A (MC_A, CIE a* color space), respectively. Shear force was measured using the Warner-Bratzler shear force meter (G-R Elec. Mfg. Co., Manhattan, New York, USA). In each sex group (365 male, 204 female, and 133 castrated male), we standardized the values to z-score separately for GWAS.
Data analysis
Linear regression GWAS
We used the linear regression model in PLINK software (additive option) for the genome-wide association (GWA) analysis with the sex adjusted data. The P-value less than the stringent level of 0.01 was selected for genome-wide significant autosomal SNPs.
The BLUP solution and SNP-GBLUP
The mixed model used to estimate the breeding values includes BLUP and best linear unbiased estimation. These models estimate the fixed effects such as sex and predicts the random effects such as SNPs for a given quantitative phenotype. The solution of the model usually can be found by using the maximum likelihood estimation (MLE) of the probability density function (pdf) of the model. The mixed model and its solution used are presented as follows:
Where y is the vector of phenotypic values, X and Z are the design matrices, b and u are vectors of fixed and random effects, respectively. The random effects and residual errors are assumed to be normally distributed. These multivariate normal distributions usually are notated as u ~ MVN(0,Gu) and e ~MVN(0,R) where MVN are denoted as multivariate normal distribution.
The identical solution of MLE of mixed model is the generalized least squares (GLS). To compare the estimated breeding values (EBV) of the total SNPs with trimmed SNPs (unadjusted cutoff p-value 0.01), we used the G-BLUP which adopts the genomic relationship matrix (GRM) with total pruned SNPs (36,896 SNPs) and SNP-GBLUP which utilizes the SNP-SNP relationship matrix with trimmed SNPs (Lee et al., 2014b). The GRM was obtained using R package “rrBLUP” (Endelman, 2011). For the GRM of the trimmed SNP’s analysis, we used the highly significant SNPs (p<0.01). The GLS solution is as follows:
Where b̂ is the estimated fixed effects and û is the estimated random effects.
The SNP-SNP relationship matrix and its inverse
The inverse of the SNP-SNP relationship matrix is depicted as in the below (Lee et al., 2014b):
Where G matrix is the genomic relationship matrix. To calculate the Gu matrix, i.e., SNP-SNP relationship matrix, we applied the Sherman-Morrison-Woodbury lemma (Sherman and Morrison, 1950; Woodbury, 1950).
Where G and A are both be invertible, and A+YGZ* are invertible if and only if G−1 + Z* A−1 Y are invertible. This formula reduces the computation time to calculate the SNP-SNP relationship matrix. We used A as identity matrix (I matrix) and the formula we used was as follows:
RESULTS
We first performed GWAS and identified the significant SNPs (p<0.01) associated with the phenotypic traits of interest (Table 1). The 859 (MC_L), 1,028 (CWT), 2,014 (Protein), 1,478 (BF), 2,580 (SF), 3,659 (Fat), 5,830 (WHC) and 3,210 (MC_A) SNPs were extracted and finally involved in the BLUP analysis.

The table of the fixed effects (male, female, and castrated male), heritability and number of SNPs used
In general, the results of SNP-GBLUP analyzed with trimmed SNPs mentioned above have higher heritability than those of G-BLUP with total SNPs as shown in Table 1. On the contrary, SF, fat, WHC and MC_A cases did not achieve satisfactory results and showed a small increase of heritability. We considered that the reason was failing to find the appropriate number of SNPs. The traits may have more quantitative trait loci (QTL) regions than those predicted as p-value <0.01. Because the most important part of our analysis was the number of SNPs, we regarded that the criteria of P-value in GWAS can be modified in the cases of SF, fat, WHC, and MC_A for a better performance of BLUP.
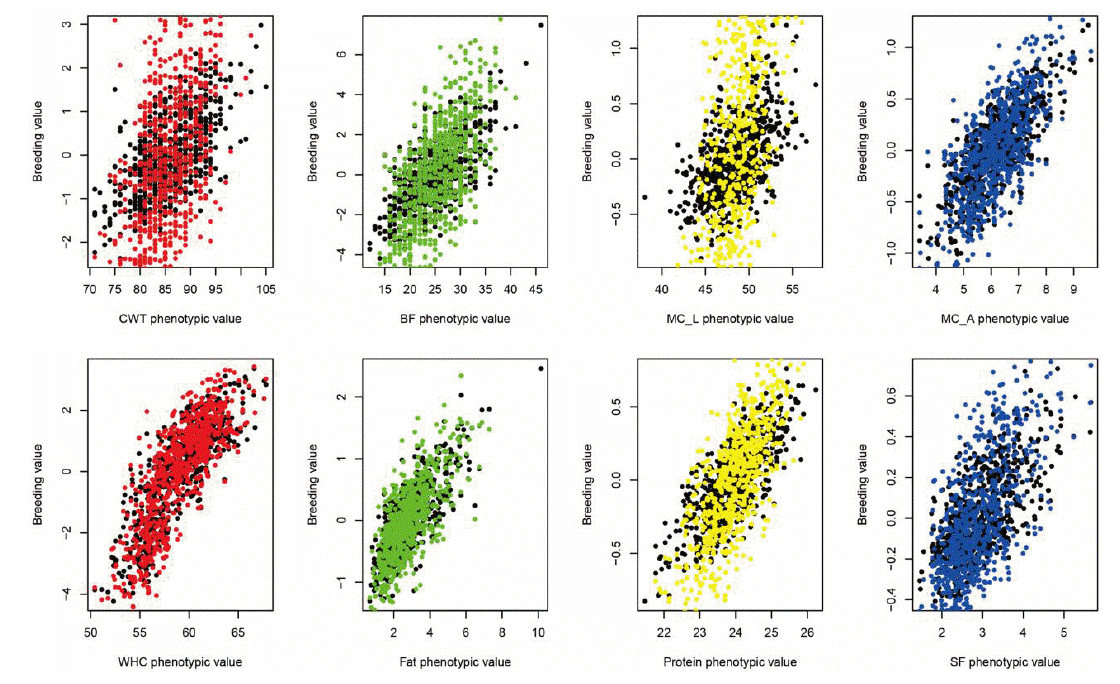
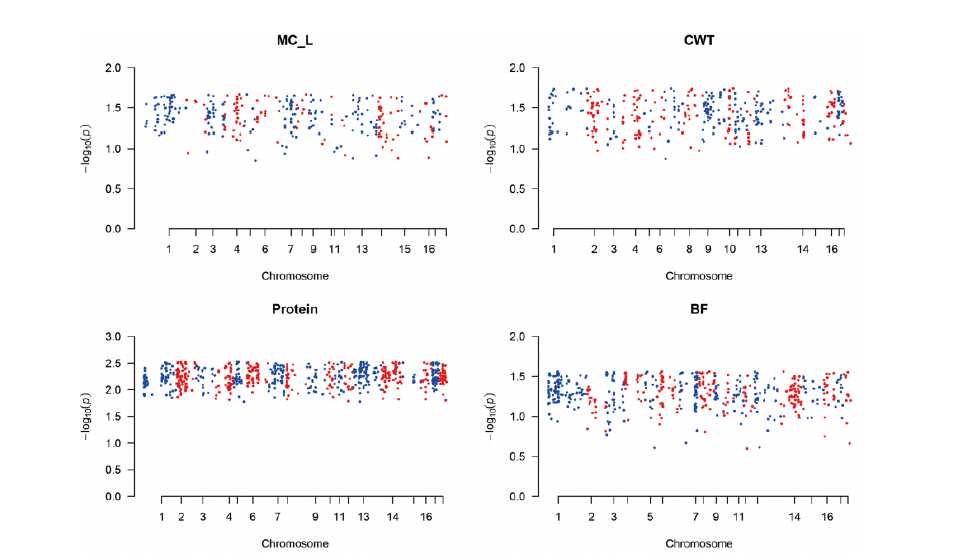
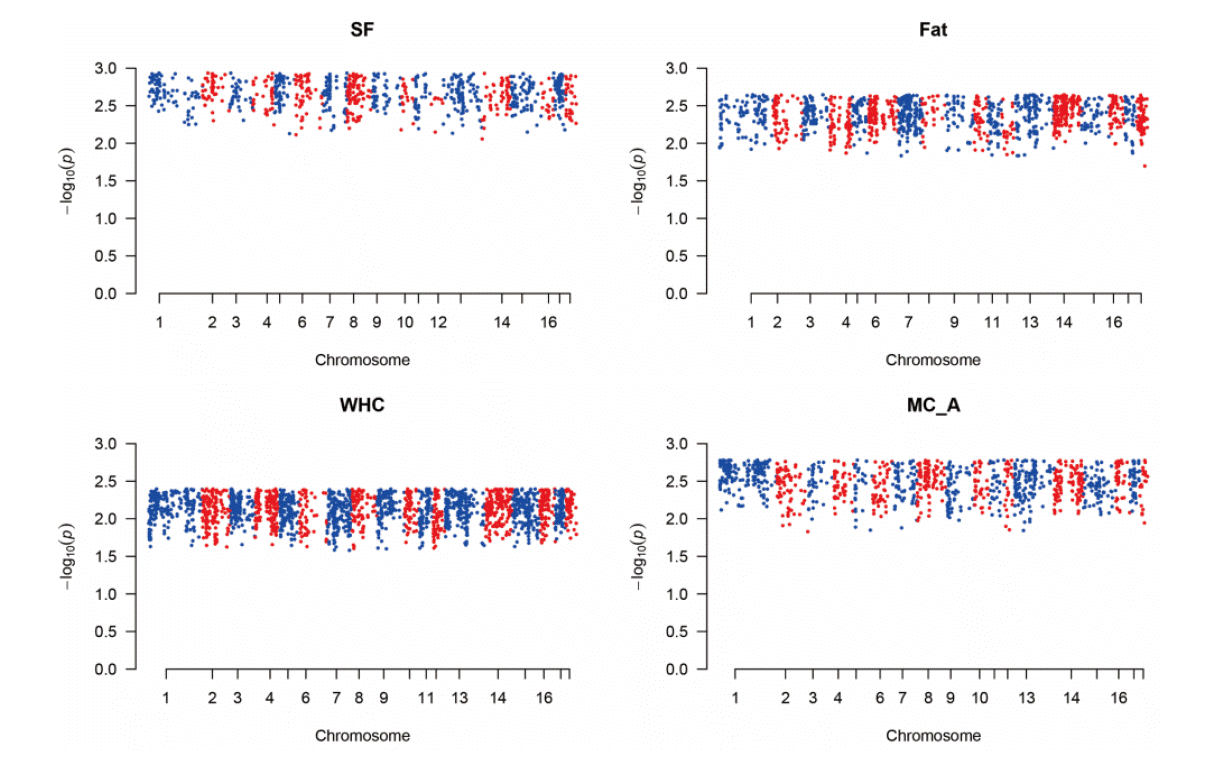
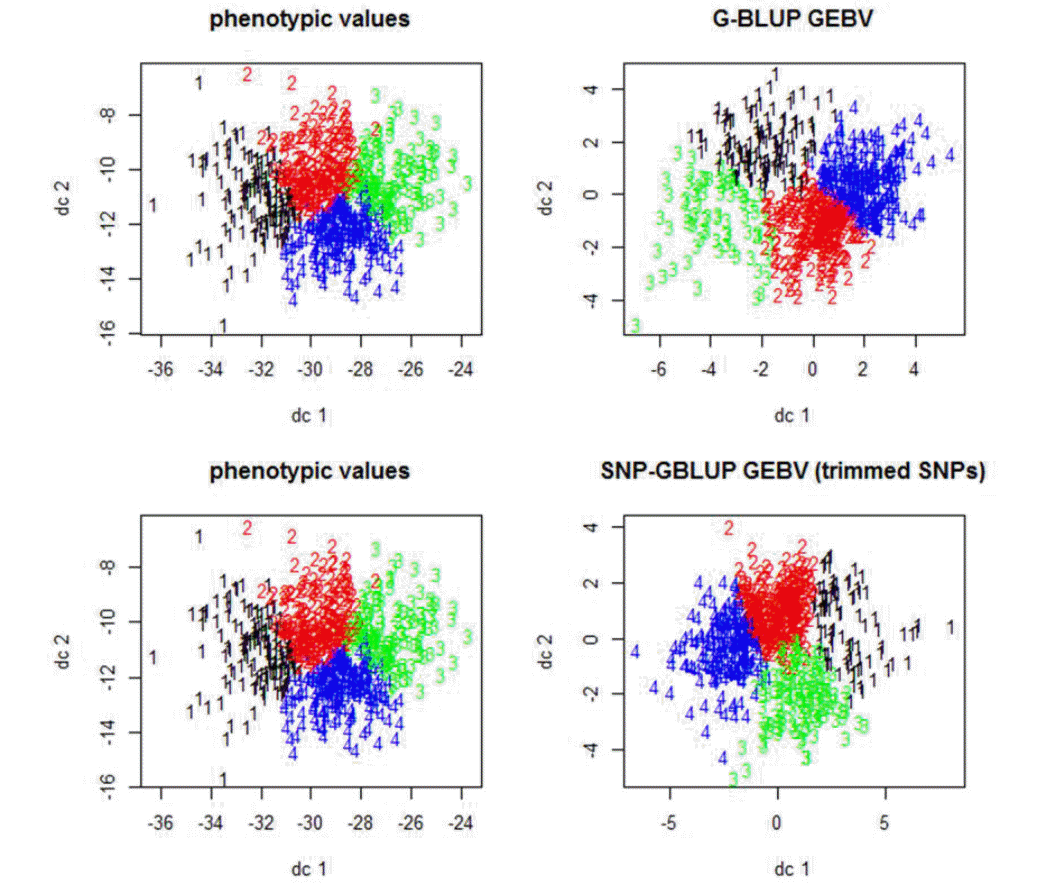
Figure 1 shows the plot of genomic estimated breeding value (GEBV) and phenotypic values for quality traits. In the plot, the colored ones refer to the trimmed SNPs’ cases while the black dots refer to the total SNPs. It shows that the slopes of the colored ones (trimmed SNPs’ cases) were higher than those of the black ones, which indicated the higher heritability and better performances in trimmed cases. Figure 2 and 3 show the Manhattan plot of −log 10 of absolute values of SNP effects across chromosomes. The plots indicate the aggregates of SNPs and SNP effects on each chromosome. The aggregates may imply the putative QTL regions. Specifically, Figure 2 shows the MC_L, CWT, protein, BF traits cases and Figure 3 shows the SF, fat, WHC and MC_A traits cases which showed the great and small increases of heritability, respectively. Figure 4 indicates K-means clustering (K = 4) of the phenotypic values and BLUP results of the analyzed Berkshire eight pork quality based on the 1st and 2nd discriminant functions. We used the R package “fpc” (Hennig, 2010). The plot of the trimmed SNPs’ was closer than that of the total SNPs when compared with the plot of phenotypic values. These kinds of plots can assist the breeders in selecting better-performed Berkshire pigs.

Plot of Berkshire genomic estimated breeding values (GEBVs) against to the phenotypic values. Black spots refer to total SNPs’ cases and colored spots refer to the trimmed SNPs’ cases. Because the slopes of colored ones were higher than black ones, the genomic estimated breeding values (GEBVs) of the trimmed cases can be more accurate than those of total SNPs’ in terms of heritability. CWT, carcass weight; BF, back fat thickness; MC_L, Minolta L Commission Internationale de I’Eclairage L* color space; MC_A, Minolta Commission Internationale de I’Eclairage a* color space; WHC, water holding capacity; Fat, intramuscular fat content; SF, Shear force; SNP, single nucleotide polymorphism.

The Manhattan plot of –log10 of absolute values of SNP effects across chromosomes. It indicates the aggregates of the SNPs and SNP effects as predicted in GWAS. Each dot can represent the SNPs in the putative quantitative trait loci (QTL) regions. The method was single nucleotide polymorphism-genomic best linear unbiased prediction (SNP-GBLUP). SNP-GBLUP can predict the SNP effects. GWAS, genome wide association study; MC_L, Minolta L Commission Internationale de I’Eclairage L* color space; CWT, carcass weight; BF, back fat thickness.

The Manhattan plot of –log10 of absolute values of SNP effects across chromosomes. It shows the aggregates of the SNPs and SNP effects as predicted in GWAS. Each dot can represent the SNPs in the putative QTL regions. The method was single nucleotide polymorphism-genomic best linear unbiased prediction (SNP-GBLUP). GWAS, genome wide association study; SF, Shear force; Fat, intramuscular fat content; WHC, water holding capacity; MC_A, Minolta Commission Internationale de I’Eclairage a* color space.

The plot of the 1st and the 2nd discriminant functions of Berkshire eight port quality traits and corresponding genomic estimated breeding values (GEBVs) of total SNPs (genomic-best linear unbiased prediction; G-BLUP) and trimmed SNPs (single nucleotide polymorphism-genomic best linear unbiased prediction; SNP-GBLUP). These plots represent the similarity between phenotypic values and GEBVs of the trimmed SNPs (p<0.01) as compared to those of the total SNPs. To classify individuals using the GEBVs can be an aid to the Berkshire breeders.
DISCUSSION
The features of the genome-wide association study
In the field of livestock science and animal breeding, mapping of QTL has been widely used to detect genetic variation responsible for economically important traits. However, due to the low density of markers and the confidence interval of QTL mapping studies, it has been difficult to identify genetic variation affecting complex traits (Soller et al., 2006). GWAS, also known as common-variant association study, typically focuses on the association between genomic variants and phenotypic traits especially developed in human disease study (Feero et al., 2010). GWAS has been extended for use in domestic animal genetics since genomic sequences of livestock have become available, and the large scale of genomic variants (SNPs, Indel and CNV) were discovered. Using sequence variation, GWAS can detect the causal mutation responsible for the economic traits underlying in QTL (Zhang et al., 2012a). This was the basis of our study because GWAS could detect the putative QTL regions and it could improve the BLUP.
Genome-wide association study and its application to the best linear unbiased prediction
Zhang et al. reported that GWAS improved the accuracy of genomic selection (GS) (Zhang et al., 2014). They asserted the superiority of BLUP|GA model over G-BLUP, which used the QTL counts and obtained p-value from GWAS. BLUP|GA model requires prior knowledge about which SNPs belonged to QTL regions. We further assert that results of GWAS can contain the information about the QTL regions’ SNPs. Otherwise, it can contain the information about the QTL regions via linkage disequilibrium. Specifically, the estimated heritability of MC_L and CWT were highly improved with 3 to 5 fold increase. This may arise because of the detection of putative QTL regions by GWAS. The combination of GWAS and SNP-GBLUP can make it possible to estimate the QTL-related SNP effects and GEBVs.
The number of analyzed SNPs was 2% to 10% of the total SNPs. We considered that as the number of QTL varies, the analyzable SNPs varies. Thus, we adopted the criteria as P-value of GWAS results. BLUP of trimmed SNPs were better than that of total SNPs in terms of heritability and GEBVs.
Missing heritability and trimming of single nucleotide polymorphisms
The missing heritability problem can occur in the association of the traits and genetic markers. In GWAS, the difficulty in analyzing complex diseases and genetic traits such as human height have emphasized the missing heritability problem (Manolio et al., 2009; Yang et al., 2010). Furthermore, there has been the missing heritability in the BLUP analysis. Many BLUP analyses have not fulfilled the narrow-sense heritability. Thus, the GEBVs could not be predicted accurately. The application of GWAS to the BLUP was a success in MC_L, CWT, protein, BF analyses and partly a success in MC_L, CWT, protein BF analyses. However, the number of SNPs required to predict the GEBVs better, can be a controversy.
The genomic relationship matrix, GRM statistically a variance-covariance matrix, uses the whole SNP information. On the contrary, partial GRM which uses the SNP information in part was a major concern in our study. We used the partial GRM because it can be variance-covariance matrix. The partial GRM which was constructed by using the SNP information in part (p<0.01 in GWAS) cannot matter because it can be a variance-covariance matrix.
IMPLICATIONS
We applied the Genome-wide Association Study (GWAS) to complement the best linear unbiased prediction (BLUP). The criteria of selected SNPs in the BLUP analysis was p-value with SNPs (p-value etter performance than that of total SNPs in terms of narrow-sense heritability. However, whether the criteria of p-value can predict GEBVs better, remains a controversy for the future.
ACKNOWLEDGMENTS
This work was supported by a grant ‘Researcher capacity-building project for R&D on biological resources to prepare for the Nagoya Protocol’ from the National Institute of Biological Resources (NIBR), funded by the Ministry of Environment (MOE) of the Republic of Korea (NIBR No. 2013-02-071).
Notes
CONFLICT OF INTEREST
We certify that there is no conflict of interest with any financial organization regarding the material discussed in the manuscript.