Effect of Lactobacillus mucosae on In vitro Rumen Fermentation Characteristics of Dried Brewers Grain, Methane Production and Bacterial Diversity
Article information
Abstract
The effects of Lactobacillus mucosae (L. mucosae), a potential direct fed microbial previously isolated from the rumen of Korean native goat, on the rumen fermentation profile of brewers grain were evaluated. Fermentation was conducted in serum bottles each containing 1% dry matter (DM) of the test substrate and either no L. mucosae (control), 1% 24 h broth culture of L. mucosae (T1), or 1% inoculation with the cell-free culture supernatant (T2). Each serum bottle was filled anaerobically with 100 mL of buffered rumen fluid and sealed prior to incubation for 0, 6, 12, 24, and 48 h from which fermentation parameters were monitored and the microbial diversity was evaluated. The results revealed that T1 had higher total gas production (65.00 mL) than the control (61.33 mL) and T2 (62.00 mL) (p<0.05) at 48 h. Consequently, T1 had significantly lower pH values (p<0.05) than the other groups at 48 h. Ammonia nitrogen (NH3-N), individual and total volatile fatty acids (VFA) concentration and acetate:propionate ratio were higher in T1 and T2 than the control, but T1 and T2 were comparable for these parameters. Total methane (CH4) production and carbon dioxide (CO2) were highest in T1. The percent DM and organic matter digestibilities were comparable between all groups at all times of incubation. The total bacterial population was significantly higher in T1 (p<0.05) at 24 h, but then decreased to levels comparable to the control and T2 at 48 h. The denaturing gradient gel electrophoresis profile of the total bacterial 16s rRNA showed higher similarity between T1 and T2 at 24 h and between the control and T1 at 48 h. Overall, these results suggest that addition of L. mucosae and cell-free supernatant during the in vitro fermentation of dried brewers grain increases the VFA production, but has no effect on digestibility. The addition of L. mucosae can also increase the total bacterial population, but has no significant effect on the total microbial diversity. However, inoculation of the bacterium may increase CH4 and CO2 in vitro.
INTRODUCTION
Direct fed microbials (DFM) are live naturally occurring microorganisms used as microbial based feed additives that include cultures of bacteria and fungi (Seo et al., 2010). According to Krehbiel et al. (2003), the beneficial effects of DFM are primarily attributed to their ability to attach to the intestinal wall and compete with intestinal pathogens, as well as their antibacterial properties. Although the beneficial effects of DFM are seen to be post-ruminal, there is also evidence suggesting that DFM has beneficial effects in the rumen such as preventing the occurrence of acidosis (Nocek et al., 2002). Nollet et al. (1998) reported that the addition of cell-free supernatant of L. plantarum to ruminal samples during short-term batch experiments led to significant increases in volatile fatty acid (VFA) production and significant decreases in methane (CH4) production, which were accompanied by H2 accumulation. Some strains of Lactobacillus are also known producers of bacteriocin and protease resistant antimicrobial substance that have inhibitory effects on methanogenesis (Takahashi, 2013). These findings suggest that selected species of Lactobacillus have the ability to manipulate rumen fermentation.
However, to be effective, DFM used to improve rumen function must have essential characteristics such as the ability to remain viable during delivery and the capability to survive in the rumen. The use of organisms isolated from the rumen itself as DFM can therefore be considered advantageous as these microbes are readily adapted to the rumen environment. For instance, Mitsuokella jalaludinii isolated from the rumen of Korean native goat (Capra hircus coreanae) was shown to possess fumarate reductase A gene (frdA) (Mamuad et al., 2012a) and was able to reduce CH4 production from in vitro rumen fermentation by diverting hydrogen (H2) utilization from methanogenesis to reduction of fumarate to succinate. Previously, Mamuad et al. (2012b) isolated Lactobacillus mucosae from the rumen of Korean native goat. Preliminary evaluation of its cultural characteristics revealed that this organism is facultative anaerobe and capable of producing propionic acid when cultured in deMan, Rogosa and Sharpe (MRS) broth medium. The isolate is 98% homologous with its type strain, L. mocosae S32T (Roos et al., 2000), while the species most related to the isolate having probiotic properties are L. fermentum (a rumen Lactobacillus) and L. reuteri (a natural inhabitant of the gut of humans and other animals). Both species are known to be heterofermentative and capable of producing bacteriocins such as hydrogen peroxide (Wells et al., 1997) and reuterin (Morita et al., 2008), respectively. Bilkova et al. (2011) isolated the strain L. mucosae D from lamb stomach and its culture supernatant showed antimicrobial activity against Staphylococcus aureus, while L. mucosae (LM1) was recently isolated from the feces of piglets by Valeriano et al. (2014) and shown to be capable of producing a putative bacteriocin that exerted an inhibitory effect on the growth of Escherichia coli (E. coli) K88 and Salmonella enteric serovar Typhimurium KCCM 40253.
This study was conducted to investigate the possible effects of L. mucosae on rumen fermentation in vitro with emphasis on its possible role in increasing VFA production and the ability of its culture supernatant to reduce CH4 production. Meanwhile, brewer’s grain is an important by-product of barley processing during the production of beer. Large amounts of this by-product are generated by the brewing industry in many countries worldwide, hence alternative methods for its utilization should be developed so that it can be recycled and not cause disposal problems and pollution. Brewer’s grain has long been used as an alternative feedstuff for animals, especially ruminants, owing to its being rich in protein and fiber and high rumen bypass potential (Pereira et al., 1998). Considering the year round availability of brewers’ grain and its potential for use in ruminant feeding, this industrial by-product was used as the fermentation substrate in the present study.
MATERIALS AND METHODS
Experimental design and in vitro rumen fermentation technique
Table 1 shows the chemical composition of brewers grain used as an in vitro rumen fermentation substrate. To reduce the high moisture content of the experimental substrate, fresh brewers’ grain was oven dried at 80°C for 12 h prior to the in vitro experiment. The dried sample was then sieved using a 1 mm screen, after which 1 g dry matter (DM) of substrate was put in each serum bottle. To maintain its low moisture content, the dried sample was kept inside desiccators until use. Meanwhile, stock culture of L. mucosae previously isolated from Korean native goats (Mamuad et al., 2012b) was prepared and used as experimental inoculum. Briefly, MRS broth was anaerobically dispensed to serum bottles under continuous purging with N2, closed with a rubber stopper and sealed with an aluminum crimp, then autoclaved and cooled. Frozen stock culture was thawed and inoculated into bottles containing the cooled medium (1%) by injection. Samples were then incubated in a shaking incubator (100 rpm) at 37°C. Twelve hour broth culture was subcultured three times on the same medium to ensure full activity of the organism. Additionally, cell-free supernatant was prepared by centrifugation of a sufficient volume of the same broth culture at 10,000 rpm for 20 minutes at 4°C as described by Enitan et al. (2011).
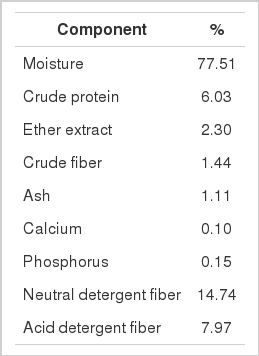
Chemical composition of wet brewers grain
The experimental design was a complete randomized design with three replications per treatment. One mL of either sterile distilled water (control), 24-h broth culture of L. mucosae at 1.70×10⁹ CFU/mL (T1), or culture supernatant (T2) prepared as previously described was added to each serum bottle containing one gram DM of brewers’ grain substrate. Each of the bottles was then subjected to in vitro rumen fermentation. Briefly, ruminal contents were collected from three ruminally cannulated Holstein Friesian cattle fed a ration of concentrated feed and rice straw (2:8 ratio). Samples were squeezed and strained through 4-layered cheese cloth. Ruminal fluid was pooled in prewarmed amber bottles, sealed and immediately transported to the laboratory while maintaining the temperature at 39°C. Additionally, buffer solution was prepared according to the procedure described by Asanuma et al. (1999) with the following composition in mg/L: dipotassium phosphate (K2HPO4), 450; monopotassium phosphate (KH2PO4), 450; magnesium sulfate heptahydrate (MgSO4·7H2O), 190; calcium chloride dehydrate (CaCl2·2H2O), 120; sodium chloride (NaCl), 900; cysteine hydrochloride (C3H7NO2S·HCl), 600; ammonium sulfate ((NH4)2SO4), 900; trypticase peptone (BBL; Becton Dickinson, Cockeysville, MD, USA), 1000; and, yeast extract (Difco Laboratories, Detroit, MI, USA), 1000. The prepared medium was then autoclaved and maintained in a 39°C water bath and flushed with N2. The pH of the buffer was adjusted to 6.9 using 10 N NaOH, after which the particle-free rumen fluid was added (1:3 rumen fluid:buffer ratio). Next, 100 mL of buffered rumen fluid were anaerobically transferred to each of the serum bottles containing the substrate. The bottles were subsequently sealed with rubber septum stoppers and aluminum caps and incubated at 39°C for 0, 6, 12, or 24 h with shaking (100 rpm) as described by Hattori and Matsui (2008).
Analysis of in vitro rumen fermentation parameters
Fermentation parameters were monitored at the end of each incubation time set. To measure the total gas (TG), a press and sensor machine was used (Laurel Electronics, Inc., Costa Mesa, CA, USA). Briefly, a needle channel connected to the machine was extended into the sealed fermentation bottle to measure the positive pressure created by the gas build up in the headspace of the bottle. A gas flow regulator was subsequently opened, allowing the gas to flow inside a syringe barrel. The plunger was pulled gradually until the pressure reading in the machine display red zero and the volume of gas trapped inside the barrel was recorded as the TG produced in milliliters. Cumulative gas production data were fitted using the formula y = a+b(1−e(−ct)), where a = the gas production from the immediately soluble fraction, b = the gas production from the insoluble fraction, c = the gas production rate constant for the insoluble fraction (b), t = the incubation time, and y = gas produced at time “t” as described by Chanthakhoun and Wanapat (2012). Gas samples were also collected into vacuum tubes from the fermentation bottles and stored in a refrigerator until use for gas chromatography (GC).
pH was determined using a Pinnacle series M530p meter (Schott Instruments, Mainz, Germany) after opening each serum bottle. Samples of fermenta were also put in 1.5 mL cryotubes and deep frozen at −80°C until VFA and ammonia-N analyses. Additionally, 1 mL fermenta from each of the serum bottles was immediately centrifuged at 10,000 rpm for 10 minutes at 4°C. The supernatant was discarded while the resulting pellet was stored frozen until use for DNA extraction and molecular biological analysis.
Samples contained in cryotubes were thawed at room temperature, after which they were centrifuged for 10 minutes at 13,000 rpm and 4°C using a Micro 17TR centrifuge (Hanil Science Industrial, Incheon, Korea) and the resulting supernatant was used for determination of ammonia-N and VFA concentrations. The ammonia-N concentration was measured according to the methods developed by Chaney and Marbach (1962) using a Libra S22 spectrophotometer (Biochrom Ltd., Cambridge CB4 0FJ, England) at an absorbance of 630 nm. High performance liquid chromatography (Agilent Technologies 1200 series, Tokyo, Japan) was used to analyze VFA with a UV detector set at 210 nm and 220 nm and a Metacarb87H (Agilent Technologies, Minnetonka, MN, USA) column using 0.0085 N H2SO4 solvent as a buffer at a flow rate of 0.6 mL/min and a column temperature of 35°C. Furthermore, 1 mL of gas sample contained in vacuum tubes was used to determine the CH4 and CO2 concentration through GC (Agilent Technologies HP 5890, Oak Ridge, TN, USA) using a thermal conductivity detector with a Column Carboxen 1006PLOT 30 m×0.53 mm capillary column (Supelco). Total CH4 and CO2 produced in each fermentation bottle in milliliters was calculated as concentration in parts per million (ppm) multiplied by the TG produced in milliliter (Zafarian and Manafi, 2013).
Determination of in vitro dry matter digestibility and organic matter digestibility
Prior to the in vitro rumen fermentation experiment, the DM and organic matter (OM) of brewers grain substrate was determined by drying at 105°C for 16 h and ashing at 550°C for 12 h, respectively. The resulting percent DM and percent OM was used to calculate the initial DM (DMi) and initial OM (OMi) of the substrate in grams. Fermenta samples from each serum bottle after the specified incubation period were drained in dried, pre-weighed nylon bags and tied shut using nylon string, then washed with flowing water for 15 minutes or until the turbidity of water resulting from washing disappeared. The final DM (DMf) and OM (OMf) of the substrate were determined using the same conditions applied when determining the initial values (DMi and OMi). The DM and OM digestibilities (%) were calculated as ([DMi − DMf]/DMi)×100 and ([OMi − OMf]/OMi)×100, respectively.
Polymerase chain reaction-denaturing gradient gel electrophoresis
Genomic DNA (gDNA) from stored pellets of centrifuged fermenta samples collected after 0, 12, 24, and 48 h of incubation were extracted using Wizard Genomic DNA Purification Kits (Promega, Madison, WI, USA). Polymerase chain reaction (PCR) amplification of the 16S rDNA was conducted using universal 27F and 1492R primers for bacteria, while the 341F-GC and 518R primers (Nubel et al., 1996) were used to amplify the bacterial 16S rRNA gene V3 region of the 16s rDNA amplicons. The resulting amplicons of the V3 region of 16S rDNA were then used for sequence-specific separation by denaturing gradient gel electrophoresis (DGGE) according to the method described by Muyzer and Smalla (1998) using a D-Code Universal Mutation Detection System (BioRad, Hercules, CA, USA). The DGGE gel was scanned at 400 dpi and similarity indices were calculated from the densitometric curves of the scanned DGGE profiles using the Molecular Analyst 1.12 software (BioRad, USA) and the Pearson product-moment correlation coefficient (Hane et al., 1993, Simpson et al., 1999) by the Central Microbiology Laboratory of Sunchon National University (SCNU) in Korea. Bands of interest were excised from the gel and eluted in 30 μL sterile distilled water overnight at 4°C. DNA from eluted gels was amplified using the bacteria and methanogen non-GC forward and reverse primers. The PCR products were purified with a QIAquick PCR purification kit in accordance with the manufacturer’s instructions, after which PCR products were sent to Macrogen (Seoul, Korea) for sequencing. The results were compared to those in the GenBank database using the basic local alignment search tool of the National Center for Biotechnology Information (NCBI) and EzTaxon.
Quantitative real-time polymerase chain reaction
External standard was prepared using a mixture of gDNA extracted from pure cultures of total bacteria. The concentration of DNA in the gDNA extracted from each sample was determined using an Epoch Microplate Spectrophotometer (Biotek, Seoul, Korea). The PCR primers used were 1114f and 1275r for total bacteria. Amplification was conducted using an Opticon Monitor 3.1.32 (MJ Geneworks, Inc., BioRad Laboratories, Inc., USA) with a total volume of 20 μL per reaction mixture containing 10 μL of iQ SYBR Green supermix, 1.0 μL each of forward and reverse PCR primers, and 8 μL template DNA of 50 ng/μL in sterile distilled water.
Statistical analysis
The results obtained from the experiment were analyzed by one-way analysis of variance using the general linear model procedure of the SAS (2005) 9.1 Software Package, and authorized synonymy between averages was determined by Duncan's multiple range test. A p<0.05 was considered to indicate significant differences.
RESULTS
In vitro rumen fermentation parameters
Total gas production, pH, and total CH4 and CO2 production, pH, NH3-N and fermentation kinetics at different times of incubation are shown in Table 2. The volumes of total gas produced were comparable between groups, except at 48 h, when inoculation with 1% L. mucosae resulted in higher gas production (65.00 mL) than the control (61.33 mL), and with the addition of supernatant (62.00 mL) (p<0.05). Consequently, T1 had a significantly lower pH at 48 h (p<0.05) compared to the other groups. The observed increasing volume of total gas produced was inversely related to decreasing pH values observed as the incubation time was prolonged. The resulting total CH4 and CO2 produced was shown to have increased consistently relative to the increase in total gas production. However, T1 produced the highest total volume of CH4 and CO2 at 24 h and 48 h, although the values only differed significantly at the former time (p<0.05). Moreover, the addition of cell-free culture supernatant resulted in a comparable volume of CH4 with the control at all times of incubation (p>0.05). Similarly, CO2 was produced at the highest levels in T1, followed by T2 and the control, with significant differences occurring at 24 h. The NH3-N concentration was significantly higher in T1 (29.17 mmol/L) than that of the control (25.88 mmol/L) but comparable to that of T2 (28.07 mmol/L). Gas production from the immediately soluble fraction (a) and gas production rate constant for the insoluble fraction (c) between treatments was comparable, while gas production from the insoluble fraction (b) and potential extent of gas production (a+b) was significantly higher in T1 than the control and T2.
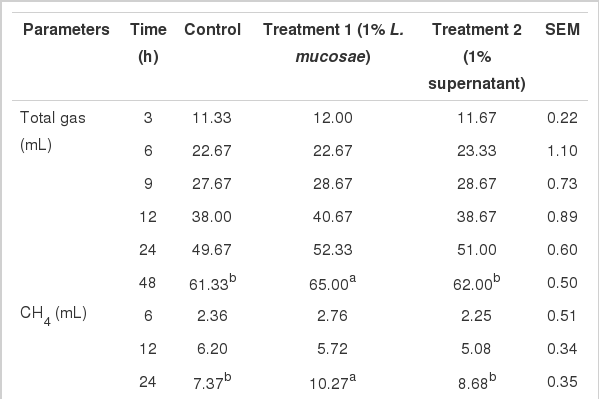
Total gas, CH4, and CO2 production, pH, NH3-N and fermentation kinetics as affected by the addition of L. mucosae or culture supernatant
Volatile fatty acid production
The addition of L. mucosae and culture supernatant resulted in higher production of individual and total volatile fatty acid (TVFA) than the control (Table 3). Acetic acid was consistently produced at higher concentrations in T1 and T2 than the control at all times of incubation (p<0.05). Similarly, propionic and butyric acid concentrations were at higher levels in the same groups relative to the control, but only at 3 and 24 h, as well as higher TVFA concentrations at all times of incubation except 9 h (p<0.05). However, the VFA concentrations obtained in T1 and T2 were found to be comparable. The higher propionic acid concentration in T1 and T2 at 12 h and 24 h coupled with relatively higher acetic acid production has resulted in higher acetate:propionate (A:P) ratios in the treated groups relative to the control.

Volatile fatty acid concentration as affected by the addition of L. mucosae or culture supernatant
Dry matter and organic matter digestibility
As shown in Figure 1, the in vitro percent dry matter digestibility (DMD) and organic matter digestibility (OMD) values of brewers grain were comparable for the control, T1 and T2 at all incubation times. At the final incubation time of 48 h, the DMD observed for the control, T1 and T2 were 55.38%, 54.44%, and 54.55%, while the OMD values were 55.07%, 53.82%, and 54.17%, respectively.
In vitro DMD and OMD of brewers grains as affected by the addition of L. mucosae and culture supernatant. Control = 1% sterile distilled water; T1 = 1% L. mucosae; T2 = 1% supernatant. Means in the same incubation time with different letter superscripts are significantly different (p<0.05). DMD, dry matter digestibility; OMD, organic matter digestibility; L. mucosae, Lactobacillus mucosae.
Total bacterial population and diversity
The results of the qPCR revealed that the group inoculated with T1 had significantly higher total bacterial DNA copies than the control and T2 (Figure 2) at 24 h. However, an abrupt decline in the number of copies in T1 to levels comparable to those of the control and T2 was observed at 48 h. Figure 3 shows the similarity index and negative image of the bacterial 16s rDNA amplified DGGE band profile obtained using the total genomic DNA extracted from in vitro fermenta samples at 0, 12, 24, and 48 h. Amplification and subsequent sequencing of dominant bands from the DGGE gel revealed eight bacterial species under the genera Lachnospiraceae, Saccharofermentans, Clostridium, Cellulosibacter, Lactobacillus, Prevotella, and Butyrivibrio, with percent similarities ranging from 91 to 100 (Table 4). At the same incubation time, each group appeared to have close similarities, with some differences. For example, the control and T1 had comparable bands at 12 and 48 h, while T1 was more similar to T2 at 24 h. Band 7, representing the bacterial inoculum L. mucosae, was only found in T1 at all incubation times. At the beginning (0 h), all groups had about 90% similarity with those in the subsequent incubation time (12 h), while about 80% similarity remained among groups at the remaining two incubation times (24 and 48 h). Additionally, a lower similarity of bands (<60%) was observed between groups at 0 and 12 h and groups at 24 h and 48 h.
Total bacterial DNA copies as affected by the addition of L. mucosae and culture supernatant. Control = 1% sterile distilled water; T1 = 1% L. mucosae; T2 = 1% supernatant. Means in the same incubation time with different superscript letters are significantly different (p<0.05). L. mucosae, Lactobacillus mucosae.
Similarity index and negative image of amplified total bacteria DGGE band profiles as affected by the addition of L. mucosae and culture supernatant. Control = 1% sterile distilled water; T1 = 1% L. mucosae; T2 = 1% supernatant. DGGE, denaturing gradient gel electrophoresis; L. mucosae, Lactobacillus mucosae.
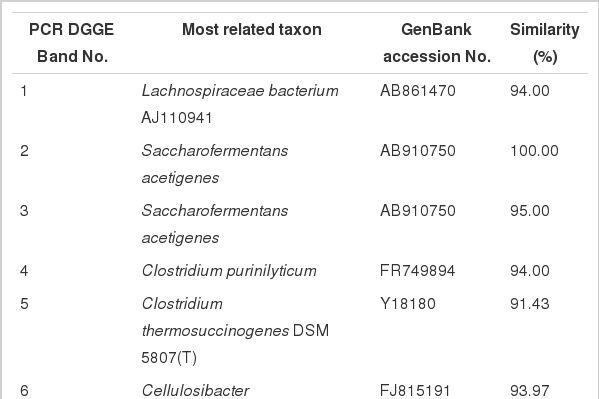
Identified dominant bands from amplified methanogen DGGE bands as affected by the addition of L. mucosae or culture supernatant
DISCUSSION
Although the inoculation of L. mucosae into fermentation bottles (T1) resulted in a lower pH than the control and T2 at 48 h, there were still no detectable levels of lactic acid observed. These findings imply that occurrence of ruminal acidosis due to accumulation of this acid in the rumen owing to the addition of this lactic acid bacteria (LAB) is unlikely. As reported by Nocek et al. (2002), lactobacillus facilitates the growth of ruminal microorganisms adapted to the presence of lactic acid in the rumen, which in turn reduces diurnal ruminal acidity, thereby preventing the occurrence of ruminal acidosis in dairy cows.
According to Getachew et al. (1998), the relative proportions of soluble, insoluble but degradable, and undegradable particles of feed determine the kinetics of gas production. In this study, the addition of L. mucosae increased the gas production from the insoluble but potentially degradable fraction of the brewers’ grain substrate as well as the potential extent of gas production, which is the sum of gas production from the soluble and slowly fermentable portion of the substrate. Although there was no significant difference between treatments, negative values were obtained for gas production from the soluble fraction, similar to the levels reported by Blummel and Becker (1997) and Chanthakhoun and Wanapat (2012) in their in vitro gas production studies when the same mathematical model was used to fit gas production kinetics. They attributed these findings to a delay in fermentation caused by delayed microbial colonization or occurrence of a lag period after the soluble part of the substrate had been consumed but before fermentation of the cell walls had started (Blummel and Becker, 1997).
Individual and TVFA concentrations were also significantly increased via the addition of L. mucosae. However, a comparable increase in VFA was also observed when equal amounts of culture supernatant were added (T2). As a known LAB, L. mucosae is expected to increase lactic acid production in T2, which may stimulate the growth of lactate utilizing microorganisms, leading to the production of propionic acid. No detectable increase in lactic acid was observed in T1 after 3 h, which may suggest possible utilization of this acid led to the higher propionic acid concentration that was observed. However, the comparable concentration of propionic acid and other VFAs, as well as TVFA, in T1 and T2 implies that this improvement in VFA production in T1 is not directly associated with the addition of L. mucosae, but rather due to the metabolism by rumen microbes of nutrients or metabolites that were present in the cell-free supernatant.
Addition of L. mucosae or cell free supernatant resulted in higher NH3-N concentrations, indicating greater catabolism of protein and non-protein N (NPN) in T1 and T2 than the control. However, the DMD and OMD observed in these groups did not differ significantly from the control. Additionally, the comparable NH3-N concentration between T1 and T2 suggests that proteolytic microbes may catabolize the proteinaceous substances in the MRS medium added to these treatment groups. Ruminal microbes utilize both dietary protein and NPN, as well as N recycled to the rumen, for protein synthesis. NH3-N can be used by most ruminal bacteria as an N source, while some species require the addition of N compounds from intact protein or carbon chains of certain amino acids for most efficient and rapid growth (Owens and Zinn, 1988). The amount of NH3-N derived from the dietary and salivary sources and the amount of fermentable energy available for microbial growth are the factors that determine the total amount of NPN that can be utilized by an animal (Satter and Slyter, 1974).
The preliminary results obtained by Mamuad et al. (2012b) during characterization of metabolites and gas production of L. mucosae showed that this bacterium is capable of producing CO2 and H2 when grown in MRS medium, basically as gas products from the anaerobic fermentation of glucose contained in the medium. These gases are the main substrates for methanogens to produce CH4 (Guglielmelli et al., 2010) and could therefore have led to the higher CH4 production in groups amended with L. mucosae. In addition, the reports of Kim et al. (2013) and Zicarelli et al. (2011) showing the positive correlation of individual and TVFA concentration with CO2 production support the higher VFA and CO2 production in groups treated with either L. mucosae or its culture supernatant compared with the control. Meanwhile, the L. mucosae LM1 isolated by Valeriano et al. (2014) from piglet feces has been shown to be capable of producing putative bacteriocin, which can significantly inhibit the growth of E. coli K88. Should L. mucosae used in this study also produce the same bacteriocin, the insignificant difference in the CH4 production in T2 may indicate that the possible presence of an antimicrobial agent did not cause an inhibitory effect on methanogenic activity.
Aside from the L. mucosae inoculum, other bacteria identified from the DGGE bands with 100% similarity to strains found in GenBank included Saccharofermentans acetigenes and Butyrivibrio fibrisolvens. S. acetigenes was first described by Chen et al. (2010) as an organism isolated from the sludge of an up-flow anaerobic sludge blanket reactor treating brewery wastewater. Acetate, lactate and fumarate are the main products of fermentation from glucose, while trace amounts of CO2 and H2 are also generated. Bryant and Small (1956) established B. fibrisolvens (strain D1) as the type strain for this butyric acid-producing bacteria. Repeated isolation in high numbers from the ruminal ingesta of B. fibrisolvens, its occurrence in animals from many geographic locations, and its fermentative activities indicate the importance of this bacterium in ruminal fermentation (Brown and Moore, 1960). Additionally, this organism also has proteolytic activity (Cotta and Hespell, 1986) and capability to degrade hemicellulose (Kamra, 2005) and pectin (Marounek and Dušková, 1999).
Based on the results gathered from the experiments, addition of L. mucosae cultured in MRS and its cell-free supernatant can alter in vitro rumen fermentation of dried brewers’ grain by increasing the VFA production, but cannot significantly affect its DMD and OMD or total bacterial diversity. Additionally, inoculation of the bacterium increases the levels of CH4 and CO2. However, these results must be further verified since the possible confounding effects on the in vitro rumen fermentation process of complex compounds and nutrients present in the MRS culture medium must be elucidated
ACKNOWLEDGMENTS
This research was supported by Bio-industry Technology Development Program, (Project No. PJ0091562014) Ministry of Agriculture, Food and Rural Affairs, and Cooperative Research Program for Agriculture Science and Technology Development, Rural Development Administration and with support of “Cooperative Research Program for Agriculture Science and Technology Development (Project No. PJ009156022014)”, Rural Development Administration, Republic of Korea.