Effect of Lysine to Digestible Energy Ratio on Growth Performance and Carcass Characteristics in Finishing Pigs
Article information
Abstract
This experiment was performed to investigate the effects of lysine (Lys) to DE ratio on growth performance, and carcass characterics in finishing barrows. Ninety six cross-bred finishing barrows ((Landrace×Yorkshire) ×Duroc, average BW 58.25±0.48 kg) were assigned as a randomized complete block design by 2 energy levels and 4 Lys:DE ratios on the basis of BW to one of 8 treatments with 3 replications with 4 animals per pen. The levels of DE and Lys:DE ratio for each treatment were i) DE 3.35 Mcal/kg, 1.5 g Lys/Mcal DE, ii) DE 3.35 Mcal/kg, 1.8 g Lys/Mcal DE, iii) DE 3.35 Mcal/kg, 2.1 g Lys/Mcal DE, iv) DE 3.35 Mcal/kg, 2.4 g Lys/Mcal DE, v) DE 3.60 Mcal/kg, 1.5 g Lys/Mcal DE, vi) DE 3.60 Mcal/kg, 1.8 g Lys/Mcal DE, vii) DE 3.60 Mcal/kg, 2.1 g Lys/Mcal DE, viii) DE 3.60 Mcal/kg, 2.4 g Lys/Mcal DE. During finishing period from 58 kg to 103 kg of BW, increased energy density in the diet increased (p<0.05) ADG and gain:feed ratio, but did not influence ADFI. As Lys:DE ratio was increased, ADG, ADFI and gain:feed ratio were improved in finishing barrows (p<0.05). There were positive interactions (p<0.05) between carcass weight, grade, and backfat thickness and energy density and Lys level (p<0.05). In conclusion, data from our current study suggest that maximum yields including ADG, gain:feed ratio, carcass weight and grade can be achieved by administrating finishing pigs with an ideal Lys:DE ratio, Lys 2.1 g/DE Mcal.
INTRODUCTION
Lysine (Lys) is considered as a reference of other indispensable amino acids due to the fact that Lys is the limiting amino acid in cereal-soybean meal diets for growing pigs (Southern, 1991; Kerr, 1993). Furthermore, Lys plays an important role in protein accretion and growth performance. Although a large amount of data for estimating Lys requirements is available, there are considerable variations due to numerous factors including genotype (Stahly, 1991), gender (Stuewe et al., 1992), balances with other limiting- (Schutte and Van Weerden, 1985; Yen et al., 1986a,b; Wang and Fuller, 1989) and non-limiting amino acids (Henry et al., 1992).
Many trials have been conducted to examine the effects of various levels of Lys:energy ratios on the growth performance. Increase in Lys:energy ratio in diet leads to significant improvements in ADG and gain:feed ratio (Batterham et al., 1985; Rao and McCracken, 1990; Chiba et al., 1991). When the Lys:energy ratio was increased from 1.35 to 2.59 g Lys/Mcal DE, growth rate and lean content are improved but there is a concomitant reduction in marbling and backfat thickness (Castell et al., 1994). In a trial conducted with barley-based diets, Campbell et al. (1988) observed maximum growth when gilts were fed with diet containing 2.97 g Lys/Mcal DE. Van Lunen and Cole (1996) showed that increase in the Lys:energy ratio decreased back-fat thickness in high-lean-growth pigs without affecting the growth rate. However, Wahlstrom and Libal (1983) did not observe differences in carcass traits at 100 kg in pigs fed protein-deficient diets during the first 4 wk of growth period.
Amino acid:energy ratio determines the rate of protein and lipid deposition in the pig’s body. Castell et al. (1994) and Blanchard et al. (1999) demonstrated that administration of pigs with feed containing low amino acid:energy ratio improved carcass and intramuscular fat level. Others reported that marginal efficiency of Lys utilization was decreased as the Lys intake approached to the amount required for maximum growth performance (Heger and Frydrich; 1985; Batterham et al., 1990; Gahl et al., 1991; 1995). This discrepancy might be attributed to animal variation. Due to inter-animal variation, the mean efficiency of nutrient utilization determined in groups of animals would be lower than that in individual animal, especially when nutrient intake level approached to the requirements of maximum performance (Baker, 1986).
Therefore, the objective of this experiment was to determine the optimum energy density and Lys:DE ratio for growth performance by analyzing carcass characteristics in finishing barrows.
MATERIALS AND METHODS
Animal and experimental design
Ninety six cross-bred finishing barrows ((Landrace×Yorkshire) ×Duroc) with an average of 58.25±0.48 kg of BW were assigned as a randomized complete block (RCB) design by 2×4 factorial arrangement. Barrows were allotted to 1 of 8 dietary treatments with low and high DE and 4 levels of Lys:DE according to a 2×4 factorial arrangement, with 3 replicates for each dietary treatment. Piglets were blocked on the basis of BW. The levels of DE and Lys:DE ratio for each treatments were i) DE 3.35 Mcal/kg, 1.5 g Lys/Mcal DE, ii) DE 3.35 Mcal/kg, 1.8 g Lys/Mcal DE, iii) DE 3.35 Mcal/kg, 2.1 g Lys/Mcal DE, iv) DE 3.35 Mcal/kg, 2.4 g Lys/Mcal DE, v) DE 3.60 Mcal/kg, 1.5 g Lys/Mcal DE, vi) DE 3.60 Mcal/kg, 1.8 g Lys/Mcal DE, vii) DE 3.60 Mcal/kg, 2.1 g Lys/Mcal DE, viii) DE 3.60 Mcal/kg, 2.4 g Lys/Mcal DE. The formula and calculated nutritional values of experimental diets were presented in Table 1. Pigs were housed in partially slotted concrete floored pen, equipped with a feeder and nipple waterer and allowed to freely access to water throughout the experiment. Pigs were fed twice daily at 08:00 and 16:00.
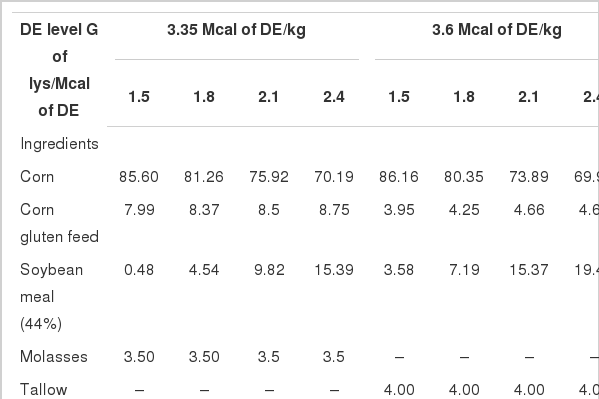
Formula and chemical composition of the experimental diets
Growth performance
Body weight was measured 2 wk interval and body weight gain was calculated by the difference between the initial body weight and final body weight. Body weight was measured individually. Feed efficiency was calculated by dividing corresponding body weight gain with total amount of feed consumed.
Carcass characteristics
Backfat thickness during growing period was measured 2 wk interval using Lean-Meater (Renco Corp., Minneapolis, MN, USA). All pigs were slaughtered when they reached to an average body weight of 110 kg. After slaughter, backfat thickness was measured at the 5 to 8 cm off midline between 10th to 11th rib. After 24 h of postmortem, loin muscles between the 10th and 11th ribs were harvested, vacuum packed and stored at 5°C until chemical analysis.
Meat samples were mixed and homogenized with distilled water at a 1:10 (wt/vol) ratio and pH was measured using an Orion Research 601A Ionalyzer (Orion Research Inc., USA). Color values were analyzed by a chroma meter (Minolta Co. CR 301) for lightness (L), redness (a) and yellowness (b) of CIE (Commision Internationale de I’eclairage) and Hunter. The purge loss was measured based upon the amounts of drip loss during vacuum packing. Filter papers (diameter 150 mm; Whatman NO. 1, Japan) were used to absorb water on the meat surface. Proximate analysis for carcass samples was analyzed according to the methods of AOAC (1995).
Statistical analysis
For statistical analyses, pigs were blocked by DE and body weight and carcass characteristics were compared by means using Duncan’s multiple range test by GLM procedure of SAS (1985) program. The pen was considered as the experimental unit for performance data.
RESULTS AND DISCUSSION
Growth performance
Table 2 shows the effect of dietary Lys:DE ratio on the growth performance in pigs. Increase in energy density improved (p<0.05) ADG and gain:feed ratio, but ADFI was not affected. Similarly, Lee et al. (2002) reported that finishing barrows fed with high energy diet containing 3.5 Mcal of DE/kg increased both ADG and gain:feed ratio but decreased feed intake. Smith et al. (1999) demonstrated that increased dietary energy density improved ADG and gain:feed ratio, but ADFI was decreased in gilts from 29.5 to 72.6 kg. For barrows weighed from 44.5 to 104 kg, ADG was not changed but ADFI was decreased resulting in improved gain:feed ratio. Other studies have also shown increased growth performance when pigs were administrated with diets with increased Lys content (Yen et al., 1986a; Rao and McCracken, 1990; Hansen and Lewis, 1993). Friesen et al. (1994) showed improved ADG, FE and ADFI with increased Lys:DE ratio in growing pigs (34 to 72 kg) fed with digestible Lys levels ranging from 0.54 to 1.04% (2.14 to 3.65 g Lys/Mcal ME). Pigs fed with diets containing low Lys level (1.88 to 3.33 g Lys/Mcal DE) showed decreased growth rate (Chiba, 1994).
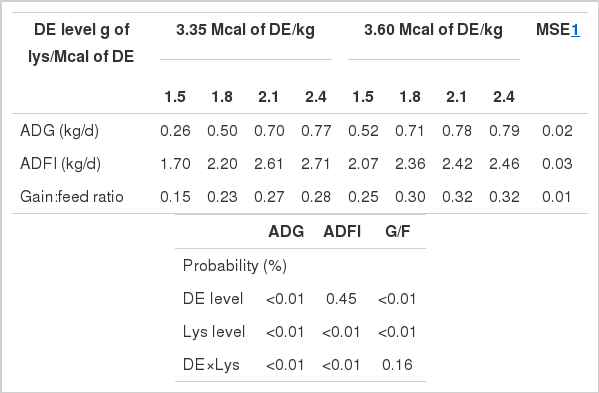
Effects of dietary energy level and lys:DE ratio on growth performance of finishing barrows
TMV (Technical Model for Pig Nutrition, 1994) model predicted 794, 734 and 658 g daily gain with 358, 332 and 299 g/kg feed efficiency in pigs fed with high, medium, and low Lys:DE diets, respectively. Witte et al. (2000) demonstrated that the high Lys diet improved gain:feed ratio, but did not affect feed intake and ADG in finishing pigs (90 to 120 kg BW). King et al. (2000) found that ADG increased but feed intake and gain:feed ratio decreased exponentially as Lys level increased from 4.8 to 9.7g Lys/kg feed (1.38 to 2.80 g Lys/Mcal DE) in pigs from 80 to 120 kg BW, and anticipated the optimal level of Lys to energy ratio was at approximately 1.67 g Lys/Mcal DE. Smith et al. (1999) observed that increase in Lys:DE ratio did not affect gain:feed raio but increased ADG and ADFI in gilts from 29.5 to 72.6 kg. Bae et al. (1998) showed the optimal growth rates occurred at 3.18 g Lys/Mcal for gilts and at 3.62 g Lys/Mcal for boars. Jung et al. (1999) suggested that optimal growth could be achieved when growing pigs fed diets with 3.5 g Lys/Mcal DE. Chang et al. (2000) reported that the optimal Lys:DE ratios was 3.2 and 3.8 g Lys/Mcal DE for barrows and gilts of 16 to 57 kg BW, respectively. Szabó et al. (2001) reported that ADG and gain:feed ratio were increased (p<0.05) by higher apparent ileally digestible Lys (0.42 g Lys/MJ DE) vs lower (Lys 0.30 g Lys/MJ DE) from 60 to 105 kg BW.
Therefore, based on the previous studies (Yen et al., 1986a; Cromwell et al., 1993; Hahn et al., 1995) and the present study, ADG, ADFI and gain:feed ratio in swine could be affected by gender, age, energy denstiy and Lys level. Our current study shows that the optimum Lys:DE ratio for growth of finishing barrows was 2.4 g Lys/Mcal DE. This value is slightly higher than estimated Lys:DE ratio suggested by NRC (1998) for 50 to 80 kg barrows with lean growth rates of 325 g/d of carcass fat-free lean (2.1 g Lys/Mcal DE).
Carcass characteristics
Table 3 showed the results of carcass quality of pigs administrated with different Lys:DE ratio in diets. Carcass weight was significantly influenced by energy concentration and Lys level resulting in significant interaction response. Carcass grade and backfat thickness were positively correlated with concentration of Lys and energy level and showed interactive effects (p<0.05, Table 3).
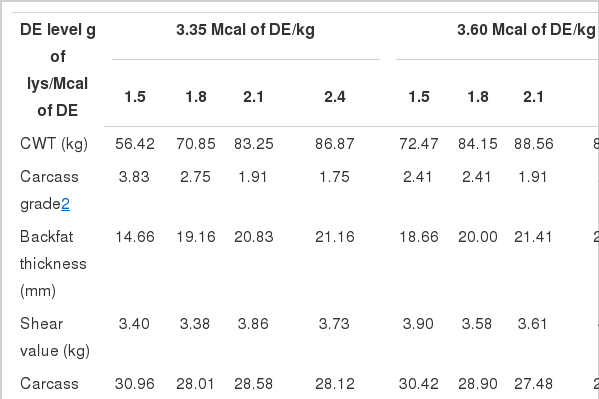
Effects of dietary energy level and lys:DE ratio on carcass characteristics of finishing barrows
Lean body mass rate is negatively correlated with backfat thickness in response to dietary energy density (Smith et al., 1999). Backfat thickness at slaughter was decreased by low energy and Lys levels which are contributed to reduced final weight. Chiba et al. (1999) found that backfat thickness at 10th rib was decreased but lean accretion rate was increased as dietary Lys content increased from 1.76 to 2.96 g/Mcal DE. These results clearly showed that the lowest energy and Lys level were not sufficient for maximal lean deposition rate of barrows. The Lys:energy ratio is the primary determinants of protein and lipid deposition rate in pigs.
Crude fat content in loin eye area was not affected by DE level. However, intramuscular fat content was increased but carcass lean content was decreased by feeding pigs with diets containing low Lys:DE ratio (Castell et al., 1994; Kerr et al., 1995; Cisneros et al., 1996; Blanchard et al., 1999; King et al., 2000; Witte et al., 2000; Szabó et al., 2001). Cisneros et al. (1996) showed increased intramuscular fat content in longismus muscle of pigs fed with Lys-deficient diets for 3 or 5 wks before slaughter. Therefore, these data suggest that intramuscular fat content and carcass lean content is determined by interactive effect of Lys:DE ratio but not by DE level.
The appropriate lightness and color of lean meat represented important criteria for the consumer. Meat color was not affected by treatments (p>0.05, Table 4). Other researchers also reported that neither the lightness nor hue values were affected by Lys:DE treatments (Witte et al., 2000; Szabó et al., 2001).
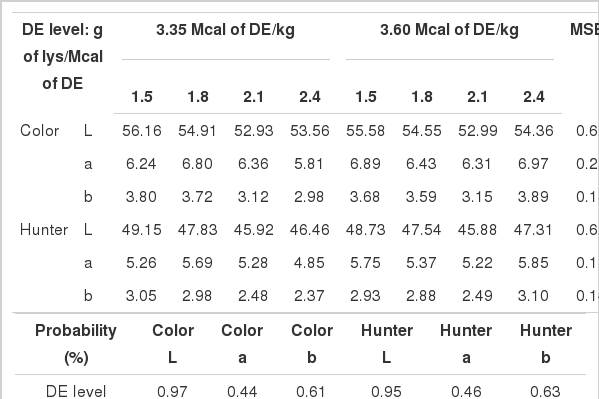
Effects of dietary energy level and lys:DE ratio on pork color of finishing barrows
In conclusion, data from our current study suggest that inadequate dietary Lys inhibits protein synthesis but increases available energy for fat deposition. Furthermore, maximum yields including ADG, gain:feed ratio, carcass weight and grade can be achieved when finishing barrows are administrated with diet containing Lys 2.1 g/DE Mcal.