Evaluation of BTA1 and BTA5 QTL Regions for Growth and Carcass Traits in American and Korean Cattle
Article information
Abstract
Previously identified QTL regions on BTA1 and BTA5 were investigated to validate the QTL regions and to identify candidate genes for growth and carcass traits in commercial cattle populations from the USA and Korea. Initially, a total of 8 polymorphic microsatellite (MS) markers in the BTA1 and 5 QTL regions were used for Chi-square tests to compare the frequencies of individual alleles between high and low phenotypic groups for the US (Michigan Cattleman’s Association/Michigan State University; MCA/MSU) cattle. For a subsequent study, 24 candidate genes containing missense mutations and located within the QTL regions based on bovine genome sequence data were analyzed for genotyping in the two commercial cattle populations. Re-sequencing analyses confirmed 18 public missense SNPs and identified 9 new SNPs. Seventeen of these SNPs were used for genotyping of the MCA/MSU cattle (n = 98) and Korean native cattle (n = 323). On BTA1, UPK1B, HRG, and MAGEF1 polymorphisms residing between BM1312 and BMS4048 were significantly associated with growth and carcass traits in one or both of the MCA/MSU and Korean populations. On BTA5, ABCD2, IL22 and SNRPF polymorphisms residing between BL4 and BR2936 were associated with marbling and backfat traits in one or both of the MCA/MSU and Korean cattle populations. These results suggested that BTA 1 and 5 QTL regions may be segregating in both Korean Hanwoo and USA commercial cattle populations and DNA markers tested in this study may contribute to the identification of positional candidate genes for marker-assisted selection programs.
INTRODUCTION
Quantitative trait loci (QTL) analyses have been performed for economically important quantitative traits in beef cattle, since such genomic technologies can provide genetic dissection of polygenic traits and help to understand the molecular mechanisms of the identified genes or genetic loci (Womack, 2006). However, effectiveness of these QTL must be validated in commercial populations before implemented into marker-assisted selection. Validation of such QTL effects in commercial populations includes i) the size of the effects should be sufficiently large to be detectable with a reasonable size of sample populations even under non-genetic or environmental influences; ii) the pattern of the effects should be predictable from the selection even in different genetic backgrounds (or lines),iii) the selection of the favorable allele for the trait of interest should not have a deleterious effect on other traits.
In an experimental population derived from a Bos indicus×Bos taurus cross, Kim et al. (2003) reported a QTL in the interstitial region of bovine chromosome 1 (BTA1) between BM1312 (61.85 cM) and SST (80.38 cM) affecting hot carcass weight, slaughter weight, and yearling weight. Later Morsci et al. (2006) reported the presence of QTL affecting marbling, ribeye muscle area and fat thickness in the vicinity of SST on BTA1 in Angus, but excluded SST as underlying the ribeye muscle area QTL. Also QTL for fat yield have been mapped to the intermediate region of BTA1 between BMS945 (51 cM) and ILSTS083 (67 cM) in a crossbred cattle population (Casas et al., 2003; Casas et al., 2004).
On BTA5, three chromosomal regions (0 to 30 cM, 55 to 70 cM and 70 to 80 cM) were identified as having significant associations with growth traits (Li et al., 2002), and two backfat QTL were mapped to the intermediate region of BTA5 (RM500 to BR2936 and BMS490 to ETH10) in a commercial Bos taurus line (Li et al., 2004). A QTL region of BTA5 influencing retail fat contents, fat yield and fat thickness in half-sib or full-sib progeny from different cattle breeds (Bos taurus) was also reported by Casas et al. (2000). According to these studies, both BTA 1 and 5 QTL were associated with several beef growth and carcass traits, including birth weight, yearling weight, slaughter weight, hot carcass weight, adjusted backfat thickness, average daily gain, marbling, texture and tenderness.
Therefore, the objectives of this study were i) to validate the segregation of the QTL on BTA1 and 5 in different commercial cattle populations without pedigree information and ii) to further characterize these QTL regions using microsatellite markers and single nucleotide polymorphisms (SNPs) from candidate genes for growth and beef quality traits.
MATERIALS AND METHODS
Animals and phenotypic data
Commercial cattle from the USA used for this study were a part of the Michigan Cattlemen’s Association (MCA)/Michigan State University (MSU) Farm to Fab Program that was a means for Michigan beef producers to obtain feedlot performance and carcass merit information for a portion of their calves. For the present study, steers (n = 100) representing eight breeds enrolled in the Farm-to-Fab Program in the fall of 1997 were used (Angus, Polled Hereford, Maine Anjou, MARC II, Salers, Shorthorn, Simmental and Tarantaise). End point was established as 0.89 cm of backfat, measured by ultrasound, or 635.2 kg live weight, whichever occurred first. Phenotypic traits recorded included birth weight (BW), average daily gain (ADG), back fat thickness (BF), slaughter weight (SW), marbling score (MAR), Warner-Bratzler shear force (WBSF), and ribeye area (REA). DNA was isolated from white blood cells using standard procedures.
Korean cattle phenotypic data for carcass and beef quality traits were obtained from 323 Hanwoo steers (30 months of age) slaughtered at Pyungnong slaughterhouses, Korea between October and December 2007. The measured phenotypes according to the Korean Beef Marbling Standard were carcass weight (CW), longissimus muscle area (LMA), backfat thickness (BFT), and marbling score (MS), but their feeding program, concentration and forage intake and fattening period were not available. Genomic DNAs were extracted using a QIAprep® Spin Miniprep Kit according to the manufacturer’s protocol (Qiagen, USA). A description of phenotypes measured for this study is shown in Table 1.
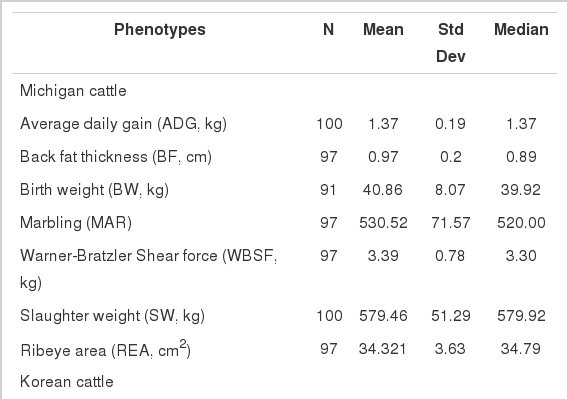
Means and standard deviations for growth, carcass and beef quality traits measured on MCA/MSU and Korean cattle populations
Genotyping of microsatellite markers
Bovine chromosomes 1 and 5 were chosen for their association with carcass and growth traits (Li et al., 2002; Kim et al., 2003). Four microsatellite (MS) markers spanning QTL regions on each chromosome were genotyped in the MCA/MSU cattle. Selection of the MS markers was based on the relative position and fragment size from the genomics database at the USDA, ARS, US Meat Animal Research Center (MARC) (http://www.marc.usda.gov/). Primer sequences and amplification conditions were also obtained from the MARC database. The BTA1 MS markers were BM1312, BMS4001, BM6506 and BMS4048. The BTA5 MS markers were BL4, BR2936, ETH10 and BMS1248. PCR products were separated by polyacrylamide gel electrophoresis with an ABI 373 Automated Laser Fluorescent DNA sequencer (PE Applied Biosystems, Foster City, CA, USA), and allelic sizes were determined with GeneScan® software.
Single nucleotide polymorphism detection
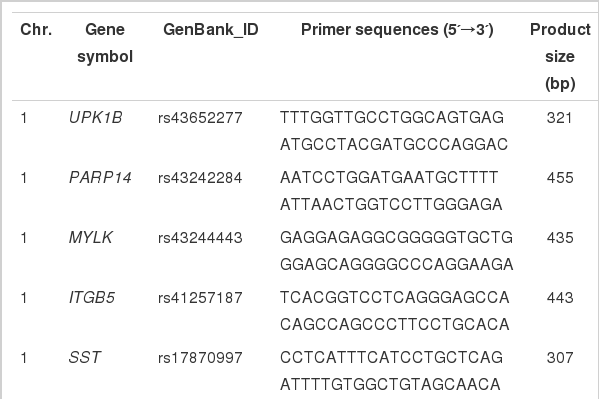
A total of 25 pairs of primers were designed for amplification and sequencing of missense SNPs in 24 candidate genes located in the growth and carcass trait QTL regions on BAT1 and BTA5. These genes included 11 genes on BTA1 spanning the region between the BM1312 and BMS4048 markers, and 13 genes on BTA5 spanning the region between the BL4 and BMS1248 markers. Primer information for PCR and sequencing is listed in Table 2. Polymerase chain reactions were performed in 10 μl volumes containing 12 ng of genomic DNA, 10 pmol of each primer, 200 μM of each dNTP, 2.5 units of HS-Taq DNA polymerase (Solgent™, Korea), and reaction buffer with 1.5 mM MgCl2. Thermocycling was performed in a PTC-200 thermocycler (MJ Research, Watertown, MA, USA) with a 10 min initial denaturation at 94°C, 35 cycles of 94°C for 30 s, 45 to 62°C for 40 s, 72°C for 30 s, and a final extension at 72°C for 10 min. The PCR products were identified by 2% agarose gel electrophoresis at 100 mV for 20 min and sequenced by Solgent (Taejeon, Korea) with an ABI PRISM 3730 DNA Analyzer (Applied Biosystems, Foster City, CA, USA) according to the manufacturer’s instructions. The sequencing results were analyzed for polymorphism detection using the Sequencher program (Gene codes, version4.7, Ann Arbor, MI, USA).
Identification of SNPs in MCA/MSU and Korean cattle
Genotyping by single-base extension (SBE) and electrophoresis
For genotyping SNP sites, amplification and extension primers were designed for the single-base extension (SBE) method (Vreeland et al., 2002). Primer extension reactions were performed with the SNaPshot ddNTP Primer extension Kit (Applied Biosystems). To clean up the primer extension reaction, one unit of SAP (shrimp alkaline phosphatase) was added to the reaction mixture, and the mixture was incubated at 37°C for 1 h, followed by 15 min at 72°C for enzyme inactivation. The DNA samples, containing extension products, and GeneScan 120 Liz size standard solution was added to Hi-Di formamide (Applied Biosystems) according to the recommendations of the manufacturer. The mixture was incubated at 95°C for 5 min, follow by 5 min on ice, followed by electrophoresis using the ABI Prism 3100 Genetic Analyzer. The results were analyzed using the ABI Prism GeneScan and Genotyper software (Applied Biosystems). Probe information is available in Table 3.
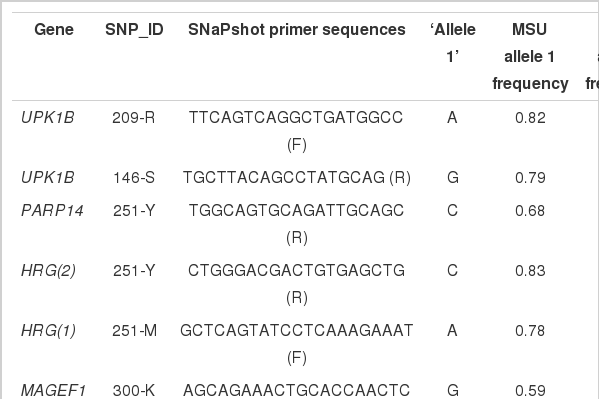
List of probe information and allele frequencies of 17 polymorphisms on BTA1 and BTA5 genotyped in MCA/MSU and Korean cattle
Statistical analysis
Evaluation of the QTL regions on BTA 1 and 5 for both the MCA/MSU and Korean cattle populations were performed with several statistical methods that would account for genetic associations of marker alleles within the QTL regions.
Significant differences of MS allelic frequencies were determined from 2×2 contingency tables (high vs low phenotypic groups×with vs without particular allele) in terms of Chi-square. Other tests of 2×2 contingency such as continuity-adjusted chi-square and Fisher’s exact test were also performed. To maximize the sample size for allelic frequency comparison, medium phenotypic values were used to divide the high and low phenotypic groups in the MCA/MSU cattle.
GLM procedures of SAS (Version 9.01; SAS, Inst., Inc., Cary, NC, USA) were used to examine associations between SNP and phenotypes for both the MCA/MSU and Korean data sets. The general linear model used for the MCA/MSU data was:
where μ = overall experimental mean, SBi = fixed effect of the ith sire breed, Gj = fixed effect of genotype, and e = residual error. For the Korean cattle population, Yij = μ+Gi+e, where Gi = fixed effect of the ith Genotype, and e = residual error. Depending on the trait under consideration, slaughter weight or birth month were included in both models as covariates.
RESULTS
SNP identification and genotyping
By direct DNA sequencing of 25 amplicons using random DNA samples from the MCA/MSU (n = 12) and Korean (n = 8) cattle, a total of 27 SNPs were identified from 12 primer sets, which included 18 public SNPs and 9 new SNPs (Table 2). Fifteen previously reported SNPs from 13 candidate genes in the BTA1 and BTA5 QTL regions were not detected to be segregating in either the MCA/MSU or Korean cattle (Table 2). Based on these sequencing results, SNPs that met the following criteria were selected for genotyping: i) location (non synonymous polymorphisms were preferred), ii) minor allele frequency (MAF freq. >0.05), and iii) linkage disequilibrium (LD, only one polymorphism was chosen if it was in complete LD (r2 = 1) with one or more other polymorphisms). Pairwise sequence analyses from the MCA/MSU and Korean cattle found that some polymorphisms within BTA1 or BTA5 were in complete LD (|D’ = 1| and r2 = 1).
As a result, six SNPs (UPK1B-146S and 209R, PARP14-251Y, HRG(1)-251M, HRG(2)-251Y and MAGEF1-300K) in the BTA1 QTL region, and eleven SNPs (ABCD2-251M, IL22-73R, SNRPF-113M, 138M and 258S, AMDHD1-304R, DRAM-324Y and CIQTNF6-168R, 229Y, 251R and 282W) in the BTA 5 QTL region were selected to genotype the MCA/MSU (n = 98) and Korean native cattle (n = 323) using the SNaPshot method.
Most genotyped SNPs had a MAF higher than 0.1 with the exception of the SNPs in the SNRPF (138M and 258S), DRAM (324Y), and CIQTNF6 (282W) genes detected in genes in the MCA/MSU cattle (Table 3). Allele frequencies of the 17 SNPs were similar between the MCA/MSU and Korean cattle populations, although frequencies for a few such as UPK1B-146S, PARP14-251Y and CIQTNF6-251R were found to be different between the Korean and MCA/MSU cattle (Table 3).
Phenotypic association of BTA 1 and 5 markers with growth and carcass traits for MCA/MSU and Korean cattle
Potential association of BTA 1 and BTA 5 QTL regions with growth and carcass traits in the MCA/MSU cattle population was initially assessed using MS markers. Individual allelic frequencies of MS markers were compared between high and low phenotypic groups in the MCA/MSU cattle (Table 4), and chi-square tests were performed to determine significance levels. The BTA1 MS markers exhibiting significant allelic frequency differences were BM1312 for Warner-Bratzler shear force and ribeye area (REA), and BM6506 for birth weight. Significant differences in allelic frequency for BTA5 markers were found with BL4 for average daily gain and birth weight, BR2936 for average daily gain, ETH10 for marbling and slaughter weight, and BMS1248 for average daily gain and slaughter weight. These results suggested that QTL for these growth and carcass traits were segregating in the MCA/MSU cattle.

Chi-square analyses of allelic frequency differences between high and low phenotypic groups
Association analyses were performed between SNP genotypes and growth and carcass traits using phenotypic data for the MCA/MSU and Korean cattle (Table 5). The association analysis revealed that the UPK1B-209R, HRG(1)-251M, and HRG(2)-251Y polymorphisms on BTA1 were significantly associated with ribeye area (REA), marbling (MAR), and backfat thickness (BF) in the MCA/MSU cattle. The 146S SNP genotypes of the UPK1B gene were significantly associated with REA and MAR.

Association of SNPs on BTA1 and BTA5 with growth and carcass traits for MCA/MSU and Koran cattle
Four polymorphisms (UPK1B-146S, MAGEF-300K, ABCD2-251M, and SNRPF-113M) were significantly associated with MAR in the Korean cattle. Interestingly, the UPK1B-146S and SNRPF-113M polymorphisms exhibited significant association with MAR in both the MCA/MSU and Korean cattle populations. The 251Y polymorphism of HRG was significantly associated with CW in the Korean cattle (p = 0.0167). The IL22-73R polymorphism was significantly associated with BF in the MCA/MSU cattle. No BTA5 SNP marker was associated with average daily gain (ADG) although BL4, BR2936, and BMS1248 MS alleles on BTA5 differed in frequencies between high and low ADG groups.
DISCUSSION
Finding genes responsible for economically important traits is difficult because such traits are controlled by quantitative genetic factors compounded with environmental influence. We hypothesized that major genetic factors for economically important traits in beef cattle would be detectable when investigating QTL regions across cattle breeds. Therefore this study evaluated genetic polymorphisms found in commercial cattle from both Korea and the USA. There has been no previous study directly comparing QTL regions between Hanwoo and other breeds, but it is already known that some of the genetic effects responsible for highly heritable traits like growth and carcass traits are found to be segregating across breeds as evidenced from several experimental crosses in beef cattle (Abe et al., 2008).
Bovine chromosomes 1 and 5 were chosen for evaluation because QTL regions on these chromosomes were detected in an experimental population derived from crossing Angus and Brahman (Kim et al., 2003), and segregation of these QTL has been validated in other cattle populations (Morsci et al., 2006; Li et al., 2004). In addition, microsatellite markers on BTA 1 have been associated with carcass traits in Hanwoo cattle (Choi et al., 2006). In this study, eight microsatellite markers spanning QTL regions on BTA 1 and 5 were genotyped in beef cattle from Michigan in the USA. Individual allelic frequencies were compared between high and low phenotypic groups and chi-square tests were performed to determine significant differences between the two groups. These initial results from the BTA 1 and 5 QTL regions were encouraging to suggest that these chromosomal regions might be associated with quantitative phenotypic variation for growth and carcass traits in commercial beef cattle populations. However, further analysis of the allelic association was problematic using microsatellite markers because some of the alleles had very low frequencies so sample size for an association study was reduced.
To develop genetic makers that were polymorphic in both populations, we screened candidate genes located in the QTL regions for polymorphisms using available cattle genomic data. A total of 25 fragments from 24 candidate genes were sequenced in both Korean and MCA/MSU cattle samples. Twenty-seven SNPs were identified and linkage disequilibrium was determined among the polymorphisms. Frequencies of these polymorphic markers were compared between the two populations and phenotype-genotype association analyses were conducted. Of the 17 SNPs for which association analyses were performed, 10 SNPs exhibited a significant association with at least one phenotypic trait. It was not feasible to construct haplotypes between the markers because physical distances of these markers were too large and the number of animals was relatively small for haplotype construction. Some of the associations were detected in both populations, although the directions of the genotypic effects were not consistent, which may indicate different linkage phase of the maker allele with the given trait of interest across populations. Also, due to different commercial sources for the phenotypic data in the two countries, the traits recorded were not consistent and even in cases where similar traits were determined, the measurements may have differed. Thus, this underscores the difficulty of comparing data across populations. However, the results support the observation that QTL for growth and carcass traits are segregating on BTA1 and 5 in both populations.
Currently high-density SNP genotyping platforms are available for several domestic species and genome-wide association studies have been completed in several cattle populations (Fan et al., 2010). In the future, for populations with similar genetic characteristics, QTL identification will utilize high-density SNP arrays. It is important to classify phenotypes compatibly across breeds, and validation of the identified QTL regions using smaller density SNP arrays may be cost-effective to use for local livestock breeds such as Korean cattle (Hanwoo). Our results in this study may contribute to the development of efficient approaches for evaluating DNA maker effects and their utilization for marker-assisted selection in local commercial breeds.
IMPLICATION
In summary, markers in BTA 1 and 5 chromosomal regions were genotyped in two commercial beef populations. These chromosomal regions were previously associated with growth and carcass traits in several cattle crosses. Significant allelic associations were observed with growth and carcass trait measurements in this study, which indicates that the QTL on these chromosomes may be segregating in multiple commercial beef populations. Based on the QTL locations, 24 genes were considered as positional candidate genes within the BTA 1 QTL region between 51.0 cM to 88.42 cM, and the BTA 5 QTL region between 61.85 cM to 99.16 cM. Comparative re-sequencing identified 27 SNP markers of which 17 SNP were evaluated for phenotypic associations in Korean and Michigan (USA) commercial beef cattle populations. More work is necessary with more genes and animals to utilize the DNA marker information on BTA1 and BTA5 for improved beef production, but the identified and verified SNPs from this study provide useful information for development of DNA marker panels for commercial application.
ACKNOWLEDGEMENT
This research was supported by the Korea Institute of Planning and Evaluation for Technology of Food, Agriculture, Forestry and Fisheries. Support was also provided by the Michigan Agricultural Experiment Station, USA. Samples and data provided by the Michigan Cattleman’s Association are gratefully acknowledged and the authors thank Dr. Steven Rust and Mr. Joel Cowley for data and sample collection.