Enhancing Mulberry Leaf Meal with Urea by Pelleting to Improve Rumen Fermentation in Cattle
Article information
Abstract
Four, ruminally fistulated crossbred (Brahman×native) beef cattle with initial body weight of 420±15 kg were randomly assigned according to a 4×4 Latin square design. The dietary treatments were mulberry leaf pellet (MUP) supplementation at 0, 200, 400 and 600 g/hd/d with rice straw fed to allow ad libitum intake. All steers were kept in individual pens and supplemented with concentrate at 5 g/kg of body weight daily. The experiment was 4 periods, and each lasted 21 d. During the first 14 d, all steers were fed their respective diets ad libitum and during the last 7 d, they were moved to metabolism crates for total urine and fecal collection. It was found that increasing MUP levels resulted in linearly increasing rice straw and total intakes (p<0.05). Ruminal temperature and pH were not significantly affected by MUP supplementation while NH3-N concentration was increased (p<0.05) and maintained at a high level (18.5 mg/dl) with supplementation of MUP at 600 g/hd/d. Similarly, viable total bacteria in the rumen and cellulolytic bacteria were enriched by MUP supplementation at 600 g/hd/d. However, the rumen microbial diversity determined with a PCR-DGGE technique showed similar methanogenic diversity between treatments and sampling times and were similar at a 69% genetic relationship as determined by a UPGMA method. Based on this study, it could be concluded that supplementation of MUP at 600 g/hd/d improved DM intake, ruminal NH3-N, and cellulolytic bacteria thus iimproving rumen ecology in beef cattle fed with rice straw.
INTRODUCTION
Mulberry (Morus alba) trees grow under varied climatic conditions, ranging from temperate to tropical, all over the world (Foiklang et al., 2011). The biomass yield of fresh leaves is often in the order of 25 to 30 tonnes/ha/yr with a cutting interval of about 9 to 10 wk, while leaves have high protein content (15.0% to 27.6% in DM) and high (75% to 85%) in vivo DM digestibility (Ba et al., 2005). Therefore, mulberry leaves have a high potential as a protein-rich forage supplement for animal production. The mulberry leaves can be used as the main feed for sheep and goats (Bakshi and Wadhwa, 2007). Moreover, they have been used to replace concentrates in dairy cattle, goat, sheep, and swamp buffalo diets (Anbarasu et al., 2004; Kandylis et al., 2009; Foiklang et al., 2011).
Ruminant production in many tropical regions is limited by poor-quality diets that are often deficient in nitrogen and have low digestibility which can limit the number of microbes (Orskov, 1994; Poungchompu et al., 2009). Dietary crude protein (CP) is the most costly nutrient and is generally divided into ruminally degradable protein (RDP) and ruminally undegradable protein (RUP). The RDP is considered essential for ruminal microbial growth (Yang et al., 2010). This not only improves the ruminal fermentation but also ensures an adequate supply of microbial protein to the host animal which supplies 700 to 800 g/kg of the required amino acids to ruminants (Chumpawadee et al., 2006; Wanapat et al., 2008). Therefore, supply of nitrogenous compounds to animals fed low-quality forages favors the growth of fibrolytic bacteria which increases digestion rates and microbial protein synthesis (Demann and McSweeney, 2006; Seo et al., 2010). Use of urea as a non-protein N (NPN) replacement is attractive in ruminant diets, because of its low cost compared with other protein feeds, such as SBM, with high rumen degradability (Wanapat, 2009; Xin et al., 2010; Cherdthong et al., 2011a,b,c;). Urea is converted via ruminal ammonia into microbial protein, thereby supplying additional microbial protein to the host (Calsamiglia et al., 2008; Cherdthong and Wanapat, 2010). Since urea is cheap it could be used for tropical ruminant production, providing it is controlled to enable slow release and/or synchronized with soluble carbohydrate in the rumen, and should be of great value in improving N utilization. Adding urea-calcium mixture to a concentrate diet in beef cattle increased NDF digestion and microbial protein formation in the rumen (Cherdthong et al., 2011a).
Making a combination of cassava hay, soybean meal, urea and some binding agent in a pellet may be a suitable method to control urea release and provide a good source of RDP and RUP (Wanapat et al., 2006). Pelleting of corn-soybean meal based diets improved digestibility of most nutrients and energy, which indicated that the nutrient digestibility could be improved by a pelleting process (Zhu et al., 2010). However, combining mulberry leaves and protein sources with urea in a pellet have not yet been trialed as a protein source in ruminants especially when fed on rice straw. Therefore, mulberry leaf pellets (MUP; the pellet mixture of mulberry leaf powder, urea and some binding agent) were formulated and were their effects on feed intake, rumen ecology, microbial protein synthesis, and microbial diversity in beef cattle fed with rice straw were investigated.
MATERIALS AND METHODS
Animals, diets and experimental design
Four, ruminally fistulated crossbred (Brahman×Thai native) beef cattle with 420±15 kg of body weight (BW) were randomly assigned to receive four dietary treatments according to a 4×4 Latin square design. The dietary treatments were as follows: supplementation with mulberry leaf pellets (MUP) at 0, 200, 400 and 600 g/hd/d, respectively. The mulberry leaf powder was prepared from whole fresh leaves that were chopped, sun-dried for 2 to 3 days, ground to pass a 1-mm screen using a Cyclotech Mill (Tecator, Hoganas, Sweden), and then mixed with other ingredients as shown in Table 1. The mixture was put through a pelleting machine and left to sun-dry for 2 to 3 days to reduce moisture.

Ingredients and chemical compositions of concentrate mulberry leaf pellet and rice straw
All animals were kept in individual pen and fed with concentrate (142 g/kg DM concentrate CP) at 0.5 g/kg of BW (DM), twice daily at 07.00 h and 16.00 h. The MUP was given to animals in two equal parts with each feeding by mixing well with the concentrate diets. Rice straw was fed to cattle ad libitum. The experiment was conducted for four periods, and each period lasted for 21 d. During the first 14 d, DM feed intake measurements were made while during the last 7 d, all cattle were moved to metabolism crates for total feces and urine collections. Chemical compositions of concentrates, rice straw and MUP are shown in Table 1.
Data collection and chemical analysis
Feeds were sampled and fecal samples were collected by total collection from each individual steer during the last 7 d of each period at the morning and afternoon feeding. Feeds, refusals and fecal samples were dried at 60°C and ground (1 mm-screen using the Cyclotech Mill, Tecator, Sweden) and analyzed using standard methods of AOAC (1995) for DM, CP and ash. Acid detergent fiber (ADF) and neutral detergent fiber (NDF) in samples were estimated according to Van Soest et al. (1991).
Rumen fluid and jugular blood samples were collected at 0, 2, 4, and 6 h post morning feeding on the last day of each period (The previous 6 days, all cattle were kept in metabolism crates for intake, total feces (to estimated nutrient digestibilities) and urine collections). Approximately 200 ml of rumen fluid was taken at each time from the middle part of the rumen using a 60 ml hand syringe. Ruminal pH and temperature were measured in the rumen using a portable pH temperature meter (HANNA, Instruments HI 8424 microcomputer, Singapore). Rumen fluid samples were then filtered through 4 layers of cheesecloth. Samples were divided into 4 portions; 1 portion was used for NH3-N analysis with 5 ml of 1 M H2SO4 added to 45 ml of rumen fluid. The mixture was centrifuged at 16,000×g for 15 min. The supernatant was stored at −20°C before NH3-N (Kjeltech Auto 1030 Analyzer) and VFA analysis. VFA analysis using high pressure liquid chromatography (HPLC, Instruments by controller water model 600E; water model 484 UVdetector; column novapak C18; column size 3.9 mm×300 mm; mobile phase 10 mM H2PO4 (pH 2.5)) according to Samuel et al. (1997). A second portion was fixed with 10 ml/100 ml formalin solution in sterilized 0.9 ml/100 ml saline solution. Rumen fluid was used for direct counts of bacteria, protozoa and fungal zoospores using methods of Galyean (1989) by haemacytometer (Boeco, Singapore) and counted under a electromicroscope. The third portion was cultured for groups of bacteria (i.e., cellulolytic, proteolytic, amylolytic, total viable count bacteria) and measured using the Hungate (1969) roll-tube technique. The last portion was kept in a plastic bottle and frozen (−20°C) for DNA extraction. Urine samples, collected during the last 6 days in metabolism crates, were analyzed for allantoin, and creatinine in urine by HPLC as described by Chen and Gomes (1995). The amount of microbial purines absorbed was calculated from purine derivative excretion based on the relationship derived by Chen and Gomes (1995).
Extraction of genomic DNA and real-time PCR
Rumen fluid was used 0.5 g for DNA extraction by the repeated bead beating plus column (RBB+C) method (Yu and Morrison, 2004). Genomic DNA was treated with RNase A and Proteinase K, and the DNA was purified using columns from the QIAGEN DNA Mini Kit (QIAGEN, Valencia, CA). The targeted bacteria were total bacteria and three predominant cellulolytic bacteria (Fibrobacter succinogenes, Ruminococcus albus and Ruminococcus flavefaciens). The primers used for the real time PCR are as follows: primers for F. succinogenes, Fs219f (5′GGT ATG GGA TGA GCT TGC-3′) and Fs654r (5′-GCC TGC CCC TGA ACT ATC- 3′), were selected to allow amplification (446-bp product) of all 10 F. succinogenes strains deposited in GenBank. For R. albus primers were Ra1281f (5′-CCC TAA AAG CAG TCT TAG TTC G-3′) and Ra1439r (5′ CCT CCT TGC GGT TAG AAC A- 3′) (175-bp product). R. flavefaciens primers, Rf154f (5′-TCT GGA AAC GGA TGG TA-3′) and Rf425r (5′-CCT TTA AGA CAG GAG TTT ACA A-3′), were also selected to allow species-species amplification (295 bp) of all seven R. flavefaciens strains deposited in GenBank. All these primer sets were previously published by Koike and Kobayashi (2001). Quantification of total bacteria population, primer and condition, was previously published by Kongmun et al. (2010). PCR primer use for methanogens was f5′-TTCGGTGGATCDCARAGRGC-3′ and r5′-GBARGTCG WAWCCGTAGAATCC-3′. Regular PCR conditions for F. succinogenes were as follows: 30 s at 94°C for denaturing, 30 s at 60°C for annealing and 30 s at 72°C for extension (48 cycles), except for 9 min denaturation in the first cycle and 10 min extension in the last cycle. Amplification of 16S rRNA for the other two species was carried out similarly, except an annealing temperature of 55°C was used. Regular PCR conditions for were as follows: 30 s at 94°C for denaturing, 30 s at 60°C for annealing and 30 s at 72°C for extension (48 cycles), except for 9 min denaturation in the first cycle and 10 min extension in the last cycle. Four sample-derived standards were prepared from the treatment pool set of community DNA. The regular PCR was used to generate sample-derived DNA standards for each real time PCR assay. Then the PCR product was purified using a QIA quick PCR purification kit (QIAGEN, Inc., Valencia, CA) and quantified using a spectrophotometer. For each sample-derived standard, copy number concentration was calculated based on the length of the PCR product and the mass concentration. Tenfold serial dilution was made in Tris-EDTA prior to real time PCR. In total, 4 real time PCR standards were prepared. The conditions of the real time PCR assays of target genes were the same as those of the regular PCR described above. Biotools QuantiMix EASY SYG KIT (B&M Labs, S.A., Spain) was used for real time PCR amplification and detection was performed using a Choromo4 detection system (Bio-Rad, Hercules, CA, USA). All PCRs were performed in duplicate.
DGGE conditions and gel analyses
The V3 region of eubacterial rrs genes was amplified using primers f5′-GC-clamp-ACGGGYGCAGCAGGCG CGA-3′ and r5′-GWATTACCGCGGCKGCTG-3′ (Bano et al., 2004). The PCR amplifications were conducted in a total volume of 50 μl containing 0.5 μM of each primer, 80 μM of dNTP mixed, 1.75 mM MgCl2, 1×PCR buffer and 1.25 U of Platinum Taq DNA polymerase. The DNA templates were first subjected to an initial denaturation at 95°C for 5min, 30 s at 95°C for denaturing, 30 s at 61°C and decrease 0.5°C per cycle, 1 min at 72°C (10 cycles), 30 s at 95°C for denaturing, 30 s at 56°C for annealing, 1min at 72°C for extension (25 cycles) and 72°C for 30 min. The products were resolved on 80 g/L polyacrylanide gel (37.5:1) with a 300–600 g/L denaturing gradient for 16 h at 85 voltages. The gel images were captured using Photo documentation (Vilber Lourmat, France).
The V3 regions of methanogenic and total bacteria genes from the DNA isolated from the rumen of different dietary treatments fed beef cattle were PCR amplified and resulting products were separated on DGGE gels.
Statistical analysis
The data were analyzed in a 4×4 Latin square design by analysis of variance run in the GLM Procedure of SAS (SAS, 1998). Data were analyzed using the model Yijk = μ+Mi+Aj+Pk+ɛijk where Yijk, observation from animal j, receiving diet i, in period k; μ, the overall mean; Mi, effect of MUP products (i = 1, 2, 3 and 4); Aj, the effect of animal (j = 1, 2, 3 and 4); Pk, the effect of period (k = 1, 2, 3 and 4); and ɛijk, the residual effect. The results are presented as mean values and standard error of the means. Differences between treatment means were determined by Duncan’s New Multiple Range Test (Steel and Torrie, 1980). Differences among treatment means with p<0.05 were accepted as representing statistically significant differences.
RESULTS
Chemical composition of feeds
The DM contents varied from 923 g/kg (MUP) to 960 g/kg (rice straw). Highest CP concentration (487 g/kg) was observed for MUP, while lowest CP concentration (39 g/kg) was noted for rice straw. The NDF contents varied from 174 g/kg (concentrate) to 759 g/kg (rice straw). Lowest ADF (115 g/kg) was observed for concentrate, while highest (473 g/kg) for rice straw. The OM ranged from 862 g/kg (rice straw) to 925 g/kg (concentrate). Highest (138 g/kg) ash contents were obtained for rice straw and lowest (75 kg) for concentrate, respectively.
Effects on feed intake
The average rice straw kg/hd/d intake increased with the levels of MUP supplementation and was significantly highest at 600 g/dh/d (7.3 kg/hd/d). The total DM intake was 8.6, 9.0, 9.4, 9.9 kg/hd/d, for supplementation levels of 0, 200, 400, and 600 g/hd/d, respectively.
Effects on ruminal pH, temperature and NH3-N
Ruminal pH and temperature, measured via rumen fistula, it was similar among treatments with averaged values at pH 6.3 and temperature of 38.6 to 38.8. No major differences were observed for pH values during the different collection times. Peak times for NH3-N in the rumen were at 2 and 4 h post feeding which could be explained by the high solubility of the protein sources used and the NH3-N levels were reduced extensively at 6 h post feeding. Rumen NH3-N concentration (analysis using the Kjeltech Auto 1030 Analyzer) tended to increase in a linear fashion with increasing MUP supplementation and the averages values were 10.7, 13.6, 16.6, and 18.5 mg/dl for 0, 200, 400, 600 g/hd/d of MUP supplementation, respectively (p<0.05).
Rumen microorganism population
Ruminal bacterial populations were influenced by MUP supplementation and was highest (1.5×10¹¹ cells/ml) at 600 g/hd/d (p<0.05) when compared to control, while protozoa and fungi were variable among treatments, the number ranged from 3.9 to 4.7×10⁵ and 7.7 to 9.1×10⁵ cells/ml, respectively and the number of protozoa was 3.9×10⁵ to 4.7 ×10⁵ cells/ml. As shown in Table 4, total viable, amylolytic bacteria, proteolytic bacteria and cellulolytic bacteria counts were enhanced by MUP levels and significantly higher (p<0.05) at 400 and 600 g/hd/d of MUP supplementation when compared to control treatment.

Effect of dietary treatment on ruminal microbes and viable bacteria in beef cattle
Real-time PCR analysis results are presented in Figure 1. The target DNA for real-time PCR was prepared as described above for rumen fluid. The methanogenic bacteria were not significantly different among treatments (p>0.05) and ranged from 1.4×10⁶ to 2.2×10⁶ copies/ml of rumen fluid. Predominant cellulolytic bacteria (R. flavefaciens, F. succinogenes and R. albus) were variable among treatments. F. succinogenes was found the most numerous bacteria across dietary treatments althouugh there were no significant differences between treatments it tended to increase by levels of MUP supplementation. R. flavefaciens was highest (p<0.05) in T3 (6.9×10⁸ copies/ml rumen fluid) while R. albus increased with levels of supplementation and was highest (p<0.05) when the cattle were fed with 600 g of MUP/hd/d. The results of this study demonstrated that cellulolytic bacteria groups were influenced by diets while the methanogenic bacteria were similar among treatments.
Effect of treatments on quantification of rumen bacteria using real-time PCR. The values were calculated from total DNA purified from 1 ml of rumen fluid. T1 = Supplementation 0 g MUP/h/d; T2 = Supplementation 200 g MUP/h/d; T3 = Supplementation 400 g MUP/h/d and T4 = Supplementation 600 g MUP/h/d.
Figure 2 and Figure 3 shows DGGE profiles for fragments amplified from specific gene sequences from cattle fed with different levels of MUP supplementation. It was found that, in total bacteria diversity, the distribution of DGGE bands in two treatments (T3 and T4) at 0 and 4 h post-feeding were almost identical. Cluster analysis of DGGE band polymorphism by the UPGMA method under 4 treatments was separated into two clusters (Figures 2 and 3). Cluster 1 was treatments T1, 2 in 0 h and T1 in 4 h post feeding while cluster 2 was for other treatments. The similar diversity between the two clusters was 69% genetic relationship. The cluster 2 of DGGE bands for other treatments (T3 and 4) at 0 and 4h post-feeding and T2 at 4 h post-feeding was supported similarly by a 75% genetic relationship (Figure 2).

Negative image of SYBR Gold stained denaturing gradient gel electrophoresis separation pattern of eight PCR samples from beef cattle in which the rumen total bacteria (T1 = Supplementation 0 g MUP/h/d; T2 = Supplementation 200 g MUP/h/d; T3 = Supplementation 400 g MUP/h/d and T4 = Supplementation 600 g MUP/h/d) are shown (a) along with the corresponding cluster analysis of the sample profiles (b).
Negative image of SYBR Gold stained denaturing gradient gel electrophoresis separation pattern of eight PCR samples from beef cattle in which the rumen methanogenic archaea V3 amplicon using GC-ARC344f and 519r primers (T1 = Supplementation 0 g MUP/h/d; T2 = Supplementation 200 g MUP/h/d; T3 = Supplementation 400 g MUP/h/d and T4 = Supplementation 600 g MUP/h/d) are shown (a) along with the corresponding cluster analysis of the sample profiles (b).
The gel images of V3 region of Archaea rrs are shown in Figure 3. Feeding time and diet treatments were not different among treatments. However, the similarity of methanogenic diversity between treatments and sampling time was 69% by UPGMA method.
Urinary excretion of purine derivatives and microbial nitrogen supply
The effect of dietary treatment on urinary excretion of purine derivatives and microbial nitrogen is shown in Table 5. The excretion of allantoin and purine derivative (PD) absorption were significantly increased (p<0.05) among treatments and ranged from 54.3, 92.1, 110.7, and 137.7; 63.0, 108.4, 130.3, and 162.0 for MUP 0, 200, 400, and 600 g/hd/d, respectively. There were significant differences between all treatments for purine derivative absorption with values of 59.0, 111.3, 137.3 and 174.4 mmol/d/kg W0.75, respectively.

Effects of dietary treatment on allantoin excretion, purine derivative excretion, purine derivative absorption and microbial protein synthesis
DISCUSSION
Effects on feed intake
Rice straw intake was increased by increasing the level of MUP supplementation. It could be influenced by levels MUP (487 g/kg CP) as a protein supplement for beef cattle in this study. Similar findings have been reported by Salisbury et al. (2004) who found that DM intakes were increased at a result of protein supplementation. As the result in Table 2, MUP supplementation levels had a dramatic positive influence on rice straw and total intake.

Feed intakes of cattle fed different level of mulberry leaf pellet
Effects on ruminal pH, temperature and NH3-N
In the present study, mean values of ruminal pH were 6.3, which could indicate a normal range though slightly lower. In addition, rumen pH in the current results was not affected by MUP supplementation levels. Similarly, Mathis et al. (2000) found that supplementation of degradable protein did not affect on rumen pH. Peak times for NH3-N in the rumen were at 2 and 4 h post-feeding which could be explained by the high solubility of the protein sources used and the NH3-N levels was reduced extensively at 6 h post feeding. As in the present study, Ribeiro et al. (2011) evaluated ammonia-N releasing in situ from urea protected with polymers and found a NH3-N peak during the first hour after supplementation, and was reduced after 4 h post-feeding. Rumen NH3-N concentration tended to be increased linearly with increasing MUP supplementation diets and the averages values were 10.7, 13.6, 16.6, and 18.5 mg/dl for 0, 200, 400, 600 g/hd/d of MUP supplementation, respectively. In addition, a linear increase in ruminal NH3-N concentration was due to increasing dietary rumen degradable protein (RDP) level. A positive correlation between ruminal NH3-N and RDP has been reported by Javaid et al. (2011). Moreover, increasing of NH3-N indicated higher levels of microbial activity or microbial protein synthesis (Table 5). Notably, ruminal NH3-N concentration was highest on diets treatment with supplementation of MUP at 400 and 600 g/hd/d due to higher level of crude protein. Ruminal NH3-N concentrations tended to be increased in the MUP diet and higher than control at 0, 2, 4, 6 h post-feeding and were similar to results reported by Javaid et al. (2011) who found that protein supplementation altered ruminal NH3. In addition, NH3-N concentrations with the MUP diet were maintained at 13.6 to 18.5 mg/dl and these concentrations were well above levels recommended for optimal ruminal digestion (Satter and Slyter, 1974). Animal intake could be increased by higher levels of NH3-N concentration as reported by Cherdthong et al. (2010); Wanapat et al. (2009a,b). During this period, all animals had increased feed intake, which could be explained the high levels of rumen NH3-N concentration (Table 3).
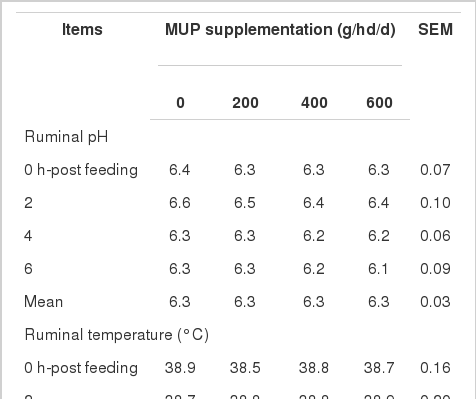
Ruminal pH, temperature, and NH3-N as affected by feeding different levels of MUP in cattle
Rumen microorganism population
Ruminal bacteria were influenced by MUP supplementation and were highest at 600 g/hd/d while protozoa and fungi were variable among treatments (Table 4). Numbers of protozoa (from 3.9×10⁵ to 4.7×10⁵ cells/ml) in the current study were lower than those reported by Moon et al. (2010), who noted that the number of protozoa in cattle was 55.0×10⁵ and 88.3×10⁵ cell/ml, respectively. As shown in Table 4, total viable, amylolytic bacterira, proteolytic bacteria and cellulolytic bacteria counts were enhanced by MUP and significantly higher at 400 and 600 g/hd/d, which indicated that MUP supplementation effectively changed the ruminal microbial population and thus increased total viable bacteria, amylolytic bacteria, proteolytic bacteria. Total viable bacteria in this study were increased and it could be related to improvement of total feed intake and this result was in agreement with the report by Cherdthong et al. (2011a,b). Increased microbial population in beef cattle by supplementation of MUP in the diets may be due to increased ruminal NH3-N (Table 3). In the current study, ruminal NH3-N levels ranged from 10.7 to 18.5 mg/dl and could be available for microbial synthesis and similar to that noted by Orskov (1994), who found that the maximum microbial count increased when ruminal NH3-N level ranged from 10 to 25 mg/dl.
Real-time PCR analysis of methanogenic bacteria populations indicated that MUP supplementation had no significant effect while predominant cellulolytic bacteria (R. flavefaciens, F. succinogenes and R. albus) populations were variable among treatments. F. succinogenes were found the highest across dietary treatments and tended to increase with increased levels of MUP supplementation. R. flavefaciens were significantly highest in T3 (6.9×10⁸ copies/ml rumen fluid) while R. albus increased with MUP supplementation and was significantly higher at 600 g of MUP. Wanapat and Cherdthong (2009) found that using real-time PCR techniques the rumen population of F. succinogenes was relatively larger than those of R. flavefacieus and R. albus (Poungchompu et al., 2009). Moreover, Koike and Kobayashi (2001) concluded that cPCR assays were recently established for three representative ruminal cellulolytic species: F. succinogenes, R. albus and R. flavefaciens. These assays showed high sensitivity and reproducibility, allowing enumeration of the three species from various sheep digestive sites in a quick and accurate manner. F. succinogenes was found to be the most dominant of the three species, with its ruminal distribution calculated to be 0.1% of the total bacterial population under the experimental dietary conditions. Denman and McSweeney (2006) also reported that the ruminal F. succinogens population was higher than those of R. flavefacieus and R. albus. The result of this study demonstrated that cellulolytic bacteria groups were influenced by diets while the methanogenes bacteria were similar among treatments.
Figure 2 and 3 shows DGGE profiles for fragments amplified from specific gene sequences from cattle fed with different levels of MUP supplementation. It was found that, the methanogenic bacteria diversity was slightly different among treatments which led to 7 separate bands of DNA morphology across all lanes of the gel. This indicated that in the present study, the predominant methanogenic bacteria in the rumen of cattle comprised 7 species. The result of cluster analysis by DGGE gel images, based on similarity, is presented in Figure 3. There are 7 distinct clusters on different MUP levels of supplementation and sampling times based on 69% genetic relationship. This result was similar to the report of Pilajun and Wanapat (2011) who found seven bands separated by DGGE amplification of specific DNA sequences in rumen fluid. However, 9–10 bands were found in lactating cows (Hristov et al., 2009) and 14 bands in sheep (Wright et al., 2007). PCR-DGGE technique is well established as a fingerprinting technique, intended for separation of same sized fragments to study diversity. However, there is still a need for identification of methanogenic bacteria by sequencing techniques which would provide more information on methanogenic bacteria diversity in the rumen.
Urinary excretion of purine derivatives and microbial nitrogen supply
There were significant differences between all treatments for purine derivative absorption. The microbial nitrogen supply (MNS) was estimated from the purine derivative absorption by the prediction equation of Chen and Gomes (1995). Diets had an effect (p<0.05) of increasing MNS with values 42.9, 80.9, 99.8, and 126.8 g/N/d, respectively. Thus microbial protein production calculated from MNS was significantly increased by increasing levels of MUP supplementation (p<0.05). The efficiency of rumen microbial nitrogen synthesis (EMNS) based on organic matter truly digested in the rumen was significantly (p<0.05) different among MUP supplementation levels. The results showed EMNS to be related to the DMI:BW ration that defines the ruminal digesta passage rate and hence outflow of microbial protein and this result is in accord with Chen and Gomes (1995). Urinary allantoin excretion was significantly increased by an increased proportion of increased level of intake. In the present study, dietary treatments had significant effects on intake, allantoin concentration, PD, yield of microbial protein, and efficiency of microbial nitrogen supply.
CONCLUSIONS
Mulberry leaf pellets (MUP) could be used as a protein source and supplementation up to 600 g/hd/d is recommended. The results revealed an improvement in dry matter intake, NH3-N concentrations, viable total bacteria, amylolytic bacteria, proteolytic bacteria, cellulolytic bacteria, microbial protein synthesis. The concentration of NH3-N was kept constant over time after infusion, which could improve microbial growth in the rumen. However, methanogenic and ellulolytic bacteria (R. flavefaciens, F. succinogenes and R. albus) were variable among treatments and highest at 600 g/hd/d. The real time PCR assay showed high sensitivity and reproducibility, allowing enumeration of the three species from various beef cattle rumen in a quick and accurate manner. F. succinogenes was found to be the most dominant of the three species under the experimental dietary conditions. However, the rumen microbial diversity was not changed as determined by the PCR-DGGE technique. Further supplementation of MUP in in vivo feeding trials should be undertaken.
ACKNOWLEDGEMENTS
The authors would like to express our sincere thanks to the Tropical Feed Resources Research and Development Center (TROFREC), Department of Animal Science, Faculty of Agriculture, Khon Kaen University, Thailand, The Norwegian Programme for Development, Research and Education (NUFU) for providing financial support for the research and the use of the research facilities. Special thanks are extended to the Agricultural Biotechnology Research Center, Faculty of Agriculture, Khon Kaen University and Queen Sirikit Sericulture Center, Khon Kaen for the use of equipment and supply of mulberry.