Estimation of Weaning Age Effects on Growth Performance in Berkshire Pigs
Article information
Abstract
Analysis for back fat thickness (BFAT) and daily body weight gains from birth to the end of a performance test were conducted to find an optimal method for estimation of weaning age effects and to ascertain impacts of weaning age on the growth performance of purebred Berkshire pigs from a closed population in Korea. Individual body weights were measured at birth (B), at weaning (W: mean, 22.9 d), at the beginning of the performance test (P: mean, 72.7 d), and at the end of the performance test (T: mean, 152.4 d). Further, the average daily gains in body weight (ADG) of 3,713 pigs were analyzed for the following periods: B to W (DGBW), W to P (DGWP), P to T (DGPT), B to P (DGBP), B to T (DGBT), and W to T (DGWT). Weaning ages ranged from 17 to 34 d, and were treated as fixed (WF), random with (WC) and random without (WU) consideration of an empirical relationship between weaning ages in the models. WF and WC produced the lowest AIC (Akaike Information Criterion) and least fractions of error variance components in multi-traits analysis, respectively. The fractions of variances due to diverse weaning age and the weaning age correlations among ADGs of different stages (when no overlapping allowed) by WC ranged from 0.09 to 0.35 and from −0.03 to 0.44, respectively. The maximum weaning age effects and optimal back fat thicknesses were attained at weaning ages of 27 to 32 d. With the exception of DGBW, the effects of weaning age on the ADGs increased (ranging from 1.50 g/d to 7.14 g/d) with increased weaning age. In addition, BFAT was reduced by 0.106 mm per increased day in weaning age. In conclusion, WC produced reasonable weaning age correlations, and improved the fitness of the model. Weaning age was one of crucial factors (comparable with heritability) influencing growth performance in Berkshire pigs. Further, these studies suggest that increasing weaning age up to 32 d can be an effective management strategy to improve growth performance. However, additional investigations of the costs and losses related to extension of the suckling period and on the extended range of weaning age are necessary to determine the productivity and safety of this practice in a commercial herd and production system.
INTRODUCTION
From the perspectives of productivity and safety in pork production, considerable attention has been focused on the weaning age of pigs. Weaning takes place over several weeks after birth. During their first 8 weeks of life, pigs undergo a series of digestive, metabolic, and immunological changes (Coffey et al., 2000). To date, researches on nutrition, management, and physiology in relation to weaning age with regards to productivity have been performed individually. The effects of weaning age on pigs under natural conditions on ordinary farms encompass the integrated influences of all specific effects due to weaning age. Weaning age is typically considered as a factor of management (fixed effect) or an environmental effect (random effect) included in the residual, and is rarely taken into account in typical models used for genetic evaluation of pig production. The effects of weaning age are usually estimated as fixed with the assumption of no variation, or with weaning age classified into a few groups (Main et al., 2004; Patience et al., 2000; Smith et al., 2008).
The effects of incrementally increasing or decreasing the weaning age on growth performance in an ordinary production scheme, given uniform health status and environmental conditions, have not been previously reported. The objective of the present study was to ascertain weaning age effects on growth traits of Berkshire pigs, together with an examination of alternative models for estimation of weaning age effects.
MATERIAL AND METHODS
Animals and traits
Records of 3,713 purebred Berkshire pigs produced from 2003 to 2007 at Gyungnam Swine Research Institute (Sancheong, South Korea) were analyzed for this study. The average herd size during this period was approximately 1,100 pigs, including approximately 20 sires and 100 dams selected from the herd. A total number of 3,835 pedigree records, including 49 sires and 214 dams, through 4 generations from 2001 to 2007 were used in the analysis. The sires and dams were mated with the aid of a computerized breeding plan using a selection index for genetic improvement in productivity. Based on the routine mandatory animal health checks for swine breeding stock farms in Korea, including random blood testing, and slaughter checks, the Gyungnam Swine Research Institute herd appeared to be free of major swine epidemic diseases. The pigs were given ad libitum access to water and feed using a standard scheme as practiced on most farms in Korea. As no single weaning scheme was adopted, there was some variation in the length of suckling periods. Weaning ages ranged from 17 to 34 d. Individual body weights were measured at birth (B), at weaning (W: mean, 22.9 d; SD, 3.4), at the beginning of a performance test (P: mean, 72.7 d; SD, 4.8), and at the end of the performance test (T: mean, 152.4 d; SD, 7.8). The traits analyzed were average daily gain in body weight (ADG) and back fat thickness (BFAT). The latter was measured at 5-cm from the edge of the split back at the level of the third to fourth last rib using a Piglog 105 device (Carometec A/S, Copenhagen, Denmark) and adjusted for 90 kg of body weight. ADGs were measured for the following periods: from birth to weaning (DGBW), from weaning to the beginning of the performance test (DGWP), from the beginning to the end of the performance test (DGPT), from birth to the beginning of the performance test (DGBP), from birth to the end of the performance test (DGBT), and from weaning to the end of the performance test (DGWT). The distribution and basic statistics of the data are presented in Figure 1 and Table 1.
Distribution of the records of average daily gain in body weight from birth to weaning (DGBW) and from the beginning to the end of the performance test (DGPT), and the means of weaning weight according to weaning age d.

Number of observations and least-square means (g, mm) by sex and sow parity
Statistical analysis
The GLM procedure of SAS (SAS Inst. Inc., Cary, NC) was used to determine the significance level of fixed effects and for obtaining least-square means. Genetic parameters, including variance components and its fractions, were estimated using the REML procedure based on an animal model, using the Wombat program (Meyer, 2010). Analyses for multi-traits were based on the following models. Weaning ages were treated as fixed (WF) or random with (WC) and random without (WU) consideration of an empirical relationship between weaning ages in the models. Models WU and WC included direct genetic, correlated dam, weaning age and residual random effects, and WF was based on previous models, but included weaning age as a fixed factor with 17 levels:
where yi is the vector of observations for the ith trait, and bi is the vector of fixed effects, including the contemporary group, birth year-month, sex, sow parity, and a covariate, individual birth weight. Fixed weaning age effects were included in bi of the first equation above. For random effects, ai is the vector of random animal effects, mi is the vector of random maternal genetic effects, ci in the second equation is the vector of random weaning age effects, and ei is the vector of random residuals; X, Z, W, and S are incidence matrices relating records of the traits to fixed and random effects.
If ā and m̄ represent the vectors of direct animal genetic effects and maternal genetic effects for the traits, respectively, and c̄ and ē represent the vectors of random weaning age and residual effects, respectively, then the random effects are postulated to follow a normal distribution with zero mean and the following distribution parameters:
Here, A is the numerator relationship matrix, Gd is a matrix with order 7, the covariance matrix of the direct genetic effect between traits, Gm is the covariance matrix of the maternal genetic effect, L is a matrix with order 17 in the current study, P is the covariance matrix of weaning age effects between traits, I is the identity matrix of appropriate dimension, and R is the covariance matrix of the residual effects.
For assessing the similarity between weaning ages, two methods were used. In WU, no relationship was assumed; hence, L is the identity matrix, leading weaning ages to uncorrelated random effects. Conversely, in WC, similarity was accounted for by the L matrix, leading weaning ages to correlated random effects. A simple application of spatial correlation from the spatial panel data regression model that include spatial dependence between the spatial units at each point (Baltagi et al., 2007) provides an empirical relationship matrix under the assumption of known homogeneous dependence across the units. An element of the relationship matrix, L, was obtained from the difference in days of weaning age as follows:
In the present study, the maximum and minimum weaning ages were 34 and 17, respectively, and a weaning age of 33 d was not observed. Thus, a relationship matrix of order 17 was obtained as follows.
RESULTS
General analysis
Preliminary analysis, including the covariances between direct genetic and maternal genetic effects and common environment effects within litters, produced unstable estimates (even for the parameters of weaning age effects) and large standard errors, possibly caused by the relatively small data set and a high number of parameters. On that account, null covariances between direct genetic and maternal genetic effects were assumed, and common litter effects were excluded in the models to reduce number of parameters and to focus on estimation of weaning age effects.
All effects of birth year-month, sex, and sow parity on the ADGs (except for sex effects on DGBW, and sow parity effects on DGPT and BFAT) were highly significant (p<0.001). As presented in Table 1, males showed growth performance similar to that of castrates, although their performance was slightly greater in the wean-to-end-of-test phase (1.5 g in DGWT). The ADGs of females were smallest, with relatively large differences from those of males and castrates. Castrates had higher back fat thickness than males or females (+1.6 mm and +1.3 mm, respectively). It has been generally accepted that first parity progeny have reduced growth performance when compared with the progeny of mature dams. However, in our study, progeny derived from second or third parity dams had reduced growth performance (DGWP and DGPT) after weaning compared with the progeny derived from first parity sows, which is inconsistent with the reports of Carney et al. (2009). First parity progeny only showed lowest growth during the suckling phase (DGBW).
Estimation of parameters
As presented in Table 2, WF that included fixed weaning age effects for 7 traits, produced significantly better AIC (Akaike Information Criterion) (Akaike, 1973) (a lower value represents a better fit in the model) than models that had random weaning age effects. The increased number of parameters due to random weaning effects in WU and WC partly contributed to the higher AICs. When included as an uncorrelated (WU) instead of a correlated (WC) random factor in the model for weaning ages, a decrease of AIC resulted. The increased estimates of phenotypic variances by WU and WC that occurred were partly due to the inclusion of weaning age variances. Estimates of phenotypic variances were increased for WF vs. WU vs. WC for all traits. Greater differences for WU vs. WC than WF vs. WU were observed in the traits except DGWT and BFAT. Direct genetic variances of the traits calculated by WF were higher than those by other models, except DGBW and BFAT. For DGPT, DGBT, DGWT, and BFAT, analysis using WF resulted in similar direct genetic variance estimates as with using WC, while WU yielded close estimates with WC for the rest of the traits. Conversely, WF produced the lowest maternal genetic variance estimates for DGBW, DGPT, DGBT, and DGWT. Overall, estimates of direct and maternal genetic variance components for the traits were generally similar across the models.

The estimates of variance components of traits and AIC by the models
Without exception, the variances due to weaning age were increased for WU vs. WC. The estimates by WC were increased by 1.1 to 6.5 times of the estimates by WU, which descended in the order DGBW, DGBP, DGBT, DGWP, DGPT, BFAT, and DGWT. The variance of the traits including growth of suckling phase increased, and the variances of the growth as time passed after weaning were reduced. The weaning age variance of DGBW reflects the growth of the suckling period determined by weaning. That is, the weaning age decides the cutting point on the growth curve of pigs, which divides into growths of suckling and nursery. Consequently, weaning age directly affects the rate of growth during the suckling phase. Nevertheless, WU unexpectedly produced the lowest weaning age variance for DGBW. WU also produced unreasonable estimates of weaning age variance fraction and correlations for DGBW and this issue will be mentioned later. The error variances for all traits, however, were similar across the models.
The direct animal and maternal genetic heritabilities for most of the traits by WF were highest among the models, as expected from the estimates of variance components in Table 2, whereas the standard errors of direct and maternal genetic heritabilities did not show noticeable differences across the models (SE presented only for WC). The estimates of direct genetic heritabilities by WC for DGBW, DGWP, and DGPT were 0.05, 0.13, and 0.13, respectively, which are considerably smaller than the estimates (0.06, 0.20, and 0.16, respectively) by WF and the estimates (0.24, 0.41, and 0.34, respectively) obtained by Rosendo et al. (2007) for Large White pigs. As time elapsed from birth, the direct genetic heritabilities by all models gradually increased. Conversely, the estimates of maternal genetic heritabilities by the models decreased (0.38, 0.14, and 0.07 for DGBW, DGWP, and DGPT by WC, respectively) as the pigs aged. This decreasing tendency in maternal genetic heritability is consistent with the results of Rosendo et al. (2007). The direct and maternal genetic heritabilities for DGBT by WC, which is used as the ADG of on-farm test pigs in Korea, were 0.20 and 0.10, respectively. The direct and maternal genetic heritabilities of BFAT by WC were 0.17 and 0.05, respectively. Back fat thickness, along with body weight, was measured on a single occasion at the end of the performance test. Therefore, it is possibly less influenced by maternal genetic effects than by direct genetic effects. Even though DGWT was a pool of DGWP and DGPT in ADG, the direct genetic heritability of DGWT was higher than that of both DGWP and DGPT. Nevertheless, both the direct and maternal genetic heritabilities of DGWT (0.21 and 0.08, respectively by WC) were considerably lower than the estimates (0.41 and 0.21) of Rosendo et al. (2007). Further, DGBT exceeded DGBW, DGWP, and DGPT in direct genetic heritability.
The fractions of weaning age variances by WU and WC are presented in Table 3. The values of fractions by WC exhibited the following descending order: DGWP, DGBP, DGBW, DGWT, DGPT, DGBT, and BFAT. In contrast, with WU, the fractions descended in the order DGWP, DGWT, DGPT, DGBP, BFAT, DGBW, and DGBT. Although the orders of DGWP (1st) and DGBT (6th) in WU and WC were the same, the orders of DGBP and DGBW differed between the models, leading to the largest differences in the fraction values. The largest difference occurred in the suckling phase (DGBW), and influenced DGBP and DGBT, which includes growth of the suckling phase. This could be caused by unreasonable estimates by WU, as previously mentioned. The increases of the fractions by WC over WU ranged from 1.4 to 5.5 times, and the increases in standard errors ranged from 1.4 to 5.0 times. The fractions for the ADGs and back fat thickness estimated using WC ranged from 0.09 to 0.35 across the traits. Weaning age variance fraction represents portion due to weaning in deviation of a phenotypic record from mean. The fractions for DGBW, DGWP, and DGBP were relatively high (0.22, 0.35, and 0.29, respectively). Weaning age greatly influenced post-weaning growth and provided a fair amount of variation in pre-weaning growth.
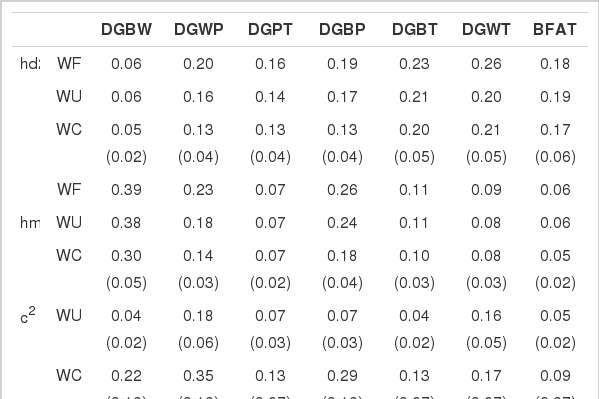
The direct animal and maternal genetic heritabilities (±SE) and the fractions (±SE) of weaning age variance and residual variance by the models
The error variance fractions for DGBW, DGWP, DGPT, DGBP, DGBT, DGWT, and BFAT, estimated using WC were 0.43, 0.38, 0.67, 0.40, 0.57, 0.54, and 0.31, respectively, and the decreases in the error variance fractions estimated using WC from WU were 0.09, 0.10, 0.05, 0.12, 0.07, 0.02, and 0.01, respectively. Consequently, including correlated rather than uncorrelated random weaning age effects in the models resulted in improvement in the fitness of the model. Even though the fractions of error variances were reduced by WC, the standard errors of the fractions slightly and insignificantly increased (data not presented).
The direct and maternal genetic correlations were estimated and compared across the models (data not presented). The estimates of the direct genetic correlations by the models were not significantly different, and the difference ranged from 0 to 0.13, which were relatively low, compared with the sizes of correlations. In the maternal genetic correlations, the estimates by WF and WU were similar, and the differences ranged from 0.00 to 0.03. However, the differences of the estimates by WF and WC ranged from 0.00 to 0.41, and further, no change of positive and negative sign in the estimates of correlations across the traits was observed except the correlation between DGWT and BFAT. The standard errors of direct genetic correlation by WC from WF and WU reduced from −0.007 to 0.019 and from −0.003 to 0.014, respectively. Further, the standard errors of maternal genetic correlation by WC from WF and WU were reduced from −0.001 to 0.006 and from −0.002 to 0.003, respectively, which were a trivial benefit from WC.
The estimates of direct and maternal genetic correlations among the ADGs by WC in Table 4 were positive without exception, consistent with the results of Tomiyama et al. (2009). The direct and maternal genetic correlations among the overlapped ADGs, such as DGBP, DGBT, and DGWT, were relatively high. The direct genetic correlations of DGBW with DGWP and of DGPT with DGBW and DGWP were moderate (0.48, 0.43, and 0.56, respectively). The correlations of BFAT with DGBW, DGWP, and DGBP were 0.11, 0.33, and 0.33, respectively. On the other hand, the direct genetic correlations of BFAT with DGPT and DGWT (growth in the later stage) were negative, and consistent with the estimates of Tomiyama et al. (2009). The negative correlations implied that only the ADG of the later stage could be improved along with back fat thickness by selection on the direction of increased growth. There was, however, no significant difference from null correlations because of their large standard errors. Maternal genetic correlations between DGBW and DGWP, DGWP and DGPT, and DGBW and DGPT were lower than the corresponding direct genetic correlations. Generally, the maternal genetic correlations of BFAT with the ADGs were considerably weaker within the range of −0.03 to 0.16, which could be partly explained by the low heritability (0.05 in Table 3) of maternal genetic effects in BFAT.

The definition of a weaning age correlation between two traits is the covariance between two traits divided by the square root of the product of the variances of the two traits due to weaning age. The weaning age correlations for the traits belong to the category of correlations due to environment or management, and summarize the relationship of traits due to weaning age effects. Generally, standard errors of the correlations were high due to small number of weaning ages (17 levels) and ranged from 0.04 to 0.32 in WU (data not presented) and from 0.05 to 0.53 in WC (presented in Table 5). The most drastic changes in the correlations between WU and WC were observed in the correlation of DGBW with other ADGs. The correlations by WU ranged from −0.03 to −0.52. On the other hand, the correlations by WC ranged from 0.13 to 0.50. As previously mentioned, unreasonable correlation estimates were also produced by WU. Weaning weight has positive genetic and management influences on post-weaning performance (Ward et al., 1964; Main et al., 2004; Smith et al., 2007; Smith et al., 2008; Tomiyama et al., 2010). Further, weaning weight reflects the growth of the suckling phase. Therefore, positive weaning age correlations are expected, as estimates of WC.

The weaning age correlations between ADGs of different stages (when no overlapping was allowed) by WC were low: 0.13, −0.03, and 0.09 for DGBW and DGWP, DGWP and DGPT, and DGBP and DGPT, respectively. Weaning age correlations between growths of overlapped stages by WC, such as DGBP and DGWP, and DGBT and DGWP, were high and ranged from 0.47 to 0.91. Back fat thickness had negative correlations with post-weaning growth and positive correlations with growth in the suckling phase. No research has been conducted to evaluate post-weaning performance with the growth rate of the suckling phase. Rather, influences of weaning weight or age on post-weaning growth performance have been studied. Lynch et al. (1998) stated that weaning weight was poorly, but positively, related to post weaning performance (p> 0.10), and weaning age seemed to be more critical. Since weaning weight is a function of weaning age and the growth rate of the suckling period, the following inference from the results would be possible. The positive weaning age correlations of DGBW with other ADGs in Table 5 reflect the positive relationship of growth of suckling with post-weaning growth due to weaning age, as was also observed in positive environmental correlations.
Environmental correlations by WC presented in Table 5 were not significantly different from the estimates and its standard errors by WF and WU (data not presented). General trends of environmental correlations across the traits are close to that of weaning age correlations, even though some differences exist.
Weaning age effects
Weaning was most frequently done at 21 d as shown in Figure 1, and the skewness and kurtosis of the distribution were 0.80 and −0.15, respectively, representing a lighter tail on the right side. The slope of the regression line in Figure 1 represents the mean change in weaning weight over the weaning ages, and the thick dotted curve signifies mean weaning weight for each weaning age day. The models estimated weaning age effects for DGBT and back fat thickness and these are presented in Figure 2. The weaning age effects of DGBT estimated using WC were generally greater than those estimated using WU. For all traits, the estimates of fixed effects deviated markedly from the estimates of random effects (data not presented). The estimates of weaning age effects for all traits by the models produced similar traces, and the differences in the estimates, however, substantially increased by WF, resulting in higher fluctuations compared with the traces by WU and WC. The averages of weaning age effects of the traits by WF and WU were zero, while the averages for DGBW, DGWP, DGPT, DGBP, DGBT, DGWT, and BFAT by WC were 7.8 g, 8.3 g, 16.3 g, 8.2 g, 9.0 g, 11.2 g, and 0.04 mm, respectively, which, although not necessarily, were not zeros due to correlated weaning ages.

The weaning age effects of the ADG from birth to the end of performance test (DGBT) and back fat thickness (BFAT) estimated using WF, WU, and WC.
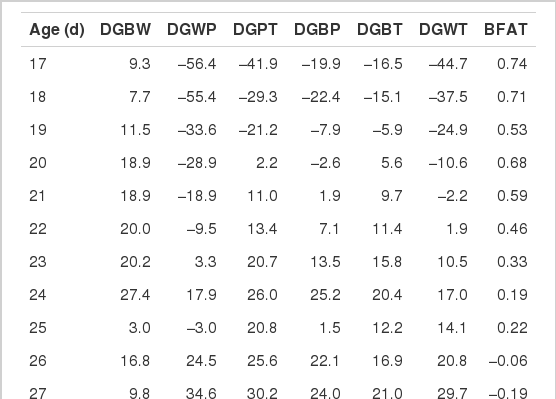
The estimated weaning age effects are presented in Table 6. The maximum values of weaning age effects for DGBW, DGWP, DGPT, DGBP, DGBT, DGWT, and BFAT were as follows: 27.4 g at 24 d, 81.6 g at 32 d, 44.7 g at 29 d, 27.4 g at 32 d, 21.0 g at 27 d, 53.0 g at 32 d, and 0.74 mm at 17 d, respectively. Similarly, the minimum values of weaning age effects for DGBW, DGWP, DGPT, DGBP, DGBT, DGWT, and BFAT were −19.5 g at 32 d, −56.4 g at 17 d, −41.9 g at 17 d, −22.4 g at 18 d, −16.5 g at 17 d, −44.7 g at 17 d, and −1.15 mm at 32 d. These results were obtained in a typical Korean swine breeding stock farm, which may have better conditions for health and management status than commercial herds. If the improvement in growth performance were partially a result of increased immunity, the active immunity, induced by delayed weaning age, could possibly expand the positive weaning age effects in commercial production systems.
The regression of weaning age effects on weaning ages are presented along with the R-square values of the regression in Table 7. These slopes are intended to provide a reference that succinctly illustrates the rate of linear improvement in growth performance as weaning age increases. The regression coefficients of the traits were similar across the models, but the R-squares of regression on the estimates by WF were considerably smaller, implying a higher fluctuation than other models in the traces of the traits. The weaning age effects of DGPT and DGBT in Berkshire pigs increased continuously (4.41 and 1.50 g/d increase in weaning age, respectively, by WC) with some fluctuations, and BFAT was reduced by 0.106 mm/d increase in weaning age. Similar results have been reported in dietary and management experiments (Main et al., 2004; Fangman et al. 1996), indicating positive impacts on post-weaning weight or growth.
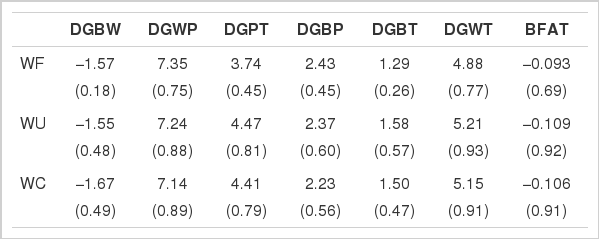
The simple regression (R-square) of weaning age effects on weaning age by the models
DISCUSSION
Empirical relationship of weaning ages
Modeling an effect as random is usually associated with the assumption of a normal distribution for the random effect. In addition, the assumption is made that the random effects are uncorrelated with explanatory variables. When there are no theoretical or other prior guidelines regarding which variables should have a random effect, the decision can be made according to the substantive focus of the investigation, and the empirical findings (Snijders, 2005). In the current study, weaning was determined mainly by the mating plan of sows and available lactation and nursery spaces, without a specific weaning scheme. It deems that the weaning age is randomly assigned by chance and further, that any random samples from the population possibly include the same units of weaning ages, which are sufficient conditions of a random factor (Snijders, 2005). The weaning ages that were the primary effects in this study can be modeled with random effects, when the variances of these effects are sufficiently important, as evidenced by their significance and size (Snijders, 2005). Baltagi et al., (2007) stated that ignoring any correlation when it is significant could lead to a misleading inference. Cardoso and Tempelman (2003) proposed a relationship in an animal model calculated using a Bayesian inference using phenotypic information. Unlike weaning age, pedigree information establishes a logical relationship from the genetic covariance between individuals. An alternative relationship for random weaning age effects was established by approximate postulation rather than precise inference from Bayesian or other approaches, which are possibly complicated in derivation and computation. The approach adopted in this study was to use empirical data for the relationship between weaning ages. In the first two models, no relationship was assumed between weaning ages, when weaning age was considered as a fixed or random factor. Finally, alternative relationships were assigned between random weaning ages as previously shown in matrix L of the model WC. The logic behind the relationship matrix is that a weaning age has a closer relationship with an adjacent weaning age d than with a remote weaning age d in proportion to the time difference. This is a modified approach from the concept of spatial dependence between the spatial units in a spatial data regression model (Baltagi, 2003). In the multivariate analysis, an empirical relationship matrix for weaning ages was assigned for all the traits, even though the impact of weaning age on each trait could be different. The differences in impacts across the traits are taken into account with different (co)variances among the traits. However, the characteristics of weaning age may change empirical relationships between weaning ages. For instance, the range of weaning ages in the current study was assumed for 17 d to 34 d, providing a value of 18 in the denominator of each element of the relationships. The range or another factor is always changeable, if a better way to consider the relationships of units in a random factor is found. AIC, the fitness of the models, and the rationality of estimates by the model with the empirical relationship were compared in the current study for estimation of weaning age effects.
Comparison of the models
Including random weaning effects in the models increased the number of estimated parameters. Since AIC includes a penalty that is an increasing function of the number of estimated parameters (Akaike, 1973), the model (WF) that includes fixed weaning age effects resulted in better AIC than did the models (WU and WC) with random effects. Further, correlated random weaning age effects in the model (WC) increased AIC over WU, which assumed null correlations between the random weaning age effects. If there are doubts regarding the independence of an effect, the simple solution is to model this categorical control variable using fixed effects. The consequence of this simplified approach, however, is that the statistical generalizability to the population of these units is lost (Snijders, 2005).
Generally variances due to direct and maternal genetic effects and residuals did not change significantly across the models, but phenotypic variances were increased by the models that included random weaning age effects, resulting from additional variance due to weaning ages. The assigned empirical relationship of weaning ages in WC represents dependency among weaning ages, and brings additionally increased weaning age variances for the traits. Direct and maternal genetic heritabilities slightly decreased in general, possibly due to increases in the variances of weaning age. However, the differences across the models were not significant compared with the differences in the fractions of weaning age variance, and the standard errors of direct and maternal genetic heritabilities did not show a noticeable difference. The multivariate analysis by WC substantially reduced the fractions of error variances for DGBW, DGWP, and DGBP, which were measurements related to the ADGs of the suckling and nursery phases. Consequently, the error variance fractions were mainly reduced compared with the direct and maternal genetic heritabilities, and the extent of reduction generally corresponded to differences in the fractions of weaning age estimated using WC. In spite of increased AIC, improved fitness of the model (reduced fractions of error variances in WC) was obtained for all traits without losing accuracy (standard error) in the estimation of genetic parameters (heritabilities, fractions, and correlations) in general.
Since the suckling period is determined by weaning age and the growth rate during this period changes, variation in the growth of the suckling period is, however, closely related to the length of the suckling phase (decision on weaning age). The fractions of weaning age variances for ADG of the suckling phase by WU, however, were low, which contradicted the high fractions by WC. Furthermore, WU produced negative weaning age correlations of DGBW with ADGs of other stages. The positive weaning age correlations for the growth of the suckling phase by WC, however, were consistent with direct and maternal genetic correlations and environmental correlation estimates. Heavy weaning weight, representing growth of the suckling phase, increases post-weaning growth (Mahan and Lepine, 1991; Mahan et al., 1998; Wolter and Ellis, 2001; Smith et al., 2007), thus implying that fast growth in the suckling phase increases the growth rate of post-weaning, and supporting positive weaning age correlations by WC rather than negative estimates by WU. Furthermore, positive impacts expressed by the correlations would be informative about growth performance, and hence, it furnishes a justification of WC.
Effects of weaning age
Weaning influences the physiological, nutritional, and even behavioral conditions of piglets. These could be important factors for productivity and safety on pig farms. No previous research for (co)variances of weaning age for growth performance, which can provide information on fraction and correlation due to weaning age from phenotypic growth records, has been conducted. Increased phenotypic variances of all traits and variance fractions of weaning age by WC were previously evaluated along with the model of WC. The weaning age variance was highest in the growth of the nursery phase (DGWP: weaning to 72.7 d), possibly reflecting that weaning age has more influence on the growth of the nursery phase than the growth of any other stage. Further evidence is provided by the high increment per day increase and the similar results of Main et al. (2004). Further, the fractions of weaning age variance from the total phenotypic variance remain comparable in extent with direct or maternal genetic heritabilities of ADGs and back fat thickness, implying that weaning age is an important factor for growth performance.
There were weak or moderate positive correlations among ADGs of different stages (when no overlapping was allowed), and strong correlations among ADGs of overlapped stages, showing that the influence of growth due to weaning age on other stages is positive but limited. Although the growth of the suckling period showed positive correlations with post-weaning growth, it was not caused by weaning age. The reason is that weaning does not influence growth of the suckling phase. The positive correlations possibly show some management effects. The levels of lactase (an enzyme required for the digestion of milk) and amylase (an enzyme required for the digestion of carbohydrates) change dramatically during the first several weeks after birth, and occurring simultaneously with these biochemical changes, there are changes in passive and active immunity (Coffey et al., 2000; Carney et al., 2009). The changes in body chemical composition due to weaning during this period occur, and possibly affect post-weaning growth in pigs. The growth of the nursery phase was highly positively related with growth from birth to the end of the test (152.4 d) and that from weaning to the end of the test in direct and maternal genetic and weaning age correlations, consistent with previous findings that increased weaning weight improved wean to finish growth rate (Mahan and Lepine, 1991; Mahan et al., 1998; Wolter and Ellis, 2001). Further, most ADGs were negatively correlated with back fat thickness, implying that improved ADGs due to delayed weaning correspondingly reduced back fat thickness.
The effects of incrementally increasing or decreasing a day in weaning age with an extensive range (such as 17 to 34 d) on growth performance, given a uniform health and environmental status, have not been previously reported. With the exception of DGBW, the weaning age effects of the ADGs increased in approximate proportion to increasing weaning age. The increment of DGWP (weaning to 72.7 d) per day increase in weaning age was 7.14 g/d in weaning age, which is the highest among the increments of the ADGs. It is lower than the results in the growth of 42 d after weaning in a multi-site production system (Main et al., 2004), which were partly due to growth performance of commercial herds. Minimum values of weaning age effects were observed at the ages of 17 d and 18 d. It is conjectured that minimum weaning age effects would be observed earlier than 17 d, given that the range includes times earlier than 17 d. Maximum values for DGBT and DGWT, representing productivity of pigs, were attained at weaning age between 27 d and 32 d. These weaning ages are delayed by approximately 1–2 weeks comparing with typical weaning. Pigs whose weaning is delayed have more time to develop active immunity (Coffey et al., 2000), and hence, show high growth performance (Mahan and Lepine, 1991; Main et al., 2004). Furthermore, the need for artificial antibiotics could be reduced if weaning is delayed. Delayed weaning age was conclusively beneficial to growth performance. In addition, delayed weaning age resulted in reduced back fat thickness, which is an important breeding objective in pig breeding.
IMPLICATIONS
The model that included correlated random weaning age effects resulted in an improved fitness of model and produced reasonable estimates of parameters on weaning age. Linear improvements in growth largely occurred from weaning to 72.7 d, with some ongoing growth improvements in finishing in Berkshire pigs. These studies suggest increasing weaning age up to 32 d can be an effective production strategy to improve growth rate and back fat thickness.
ACKNOWLEDGEMENTS
This study was financially supported by the 2008 Intramural Research Fund of Chungnam National University.