Effects of Storage Duration and Temperature on the Chemical Composition, Microorganism Density, and In vitro Rumen Fermentation of Wet Brewers Grains
Article information
Abstract
This study aimed to investigate the effects of storage duration and temperature on the characteristics of wet brewers grains (WBG) as feeds for ruminant animals. Four storage temperatures (5°C, 15°C, 25°C, and 35°C) and four durations (0, 1, 2, and 3 d) were arranged in a 4×4 factorial design. Surface spoilage, chemical composition and microorganism density were analyzed. An in vitro gas test was also conducted to determine the pH, ammonia-nitrogen and volatile fatty acid (VFA) concentrations after 24 h incubation. Surface spoilage was apparent at higher temperatures such as 25°C and 35°C. Nutrients contents decreased concomitantly with prolonged storage times (p<0.01) and increasing temperatures (p<0.01). The amount of yeast and mold increased (p<0.05) with increasing storage times and temperatures. As storage temperature increased, gas production, in vitro disappearance of organic matter, pH, ammonia nitrogen and total VFA from the WBG in the rumen decreased (p<0.01). Our results indicate that lower storage temperature promotes longer beneficial use period. However, when storage temperature exceeds 35°C, WBG should be used within a day to prevent impairment of rumen fermentation in the subtropics such as Southeast China, where the temperature is typically above 35°C during summer.
INTRODUCTION
Brewers grains are the most important byproduct in the brewery industry. For 100 kg of barley used for brewing, 170 kg of wet brewers grains (WBG) are produced (Kaur, 2004). Brewers grains are predominantly composed of fibrous materials and nitrogen-containing compounds, and may be used as feed for dairy cattle. They are also a rich source of rumen-undegradable protein, containing high concentrations of methionine and lysine (Clark et al., 1987). Effective fiber is needed to stimulate chewing and rumination, whereas an excess of physical effective fiber may decrease the dietary DM intake (Mertens, 1997; Zebeli et al., 2012). Therefore, WBG are typically added to dairy diets to reduce the forage fiber but enhance its intake (Frikins et al., 2002). However, a large amount of byproduct grains are underutilized in China and many of them are disposed directly. Such disposal does not only result in wastage of resources but also creates a great amount of environmental pollution. In addition, product variability of WBG can also influence their utilization (Westendorf and Wohlt, 2002).
The practice of feeding WBG to livestock animals is becoming more common. Dairy cows fed with WBG perform better than those on dried brewers grains (Dhiman et al., 2003). Numerous dairy farms chose to utilize WBG to reduce costs. However, the storage time for WBG is typically short in a high humidity environment, especially at high temperatures (Nofsinger et al., 1983). Improper storage of WBG results in a large loss of DM and nutrients, characterized by an unpleasant odor, and even stimulates mold to produce mycotoxins such as aflatoxins (Asurmendi et al., 2013), ochratoxin A (Amézqueta et al., 2009), zearalenone (Zinedine et al., 2007), patulin (Atanda et al., 2012), and gliotoxin (Keller et al., 2012). Temperature greatly varies throughout the four seasons in subtropics such as Southeast China and poses as one of the most important environmental factors (Cohen, 1985) that impact nutrient loss during storage.
However, little information is available on the nutrient changes and rumen fermentation characteristics of WBG stored for varying durations at temperatures exceeding 35°C, a condition that is observed during the summers in the tropical zones. The objective of this experiment, therefore, was to evaluate the effects of storage duration and temperature on the chemical composition, microorganism density, and in vitro rumen fermentation of WBG.
MATERIALS AND METHODS
Experimental design
Four storage temperatures, 5°C, 15°C, 25°C, and 35°C, and 4 durations, 0, 1, 2, and 3 d, were arranged in a 4×4 factorial design at a humidity of 60%–70%. These temperature regimes were designed to simulate the temperatures of the four seasons in southern China. The temperature was controlled in a thermostatic incubator to allow ±1°C fluctuation from the set temperature for all the incubations.
Sampling methods
A type of commercial fresh WBG was obtained from a private brewing factory (Hangzhou Huarun Snow Beer Co., Ltd.) in Hangzhou, China. The WBG samples were collected from two consecutive days. For each day, samples were taken from three batches to obtain a total of 20 kg of pooled WBG (wet weight). Two day’s samples were pooled together. When used, the pooled WBG was mixed for 5 min, and 200 g of WBG (wet weight) was placed into a 500-mL beaker. All beakers were covered with 3 layers of cheesecloth to prevent rapid vaporization of moisture but to retain aerobic conditions. Each WBG treatment was stored in triplicate in thermostatic incubators.
Visible aerobic spoilage from WBG was investigated at each temperature at every 12 h for 72 h. Samples were collected at 0, 1, 2, and 3 d of air exposure to analyze chemical composition and microorganism density, and the subsamples were used for in vitro gas tests. Final weight of the beaker was recorded, and the WBG were sub-sampled to determine the DM (approximately 150 g).
Sensory evaluation of microorganisms and analysis of chemical composition
A visual inspection of spoilage was performed for WBG stored at 5°C, 15°C, 25°C, and 35°C for the 4 storage periods according to the method described by Allen and Stevenson (1975). Yeasts and molds were quantified by pour plating onto Rose Bengal Medium agar (aladdin, CAS: 632-69-9), with 0.0033 g of chloramphenicol added for every 100 mL of agar to restrict bacterial growth. Plates were incubated aerobically at 28±1°C for 3 d. Growing molds and yeasts were directly counted (MoH, 2010).
The pH was measured using a pH meter (S40 SevenMulti, Mettler Toledo, China) immediately after sampling. The WBG juice was extracted with a 1:10 ratio of physiological saline to sample (fresh weight) to assess the concentration of ammonia-nitrogen (N) by a spectrometer (Model 721) using colorimetry (Searle, 1984) with ammonium chloride solution as a standard.
All samples were dried in a forced-air oven at 65°C for 48 h, and stored in sealed plastic containers at 4°C until analysis. All the dried samples were ground through a 2-mm screen Wiley mill (Arthur H. Thomas Co., Philadelphia, PA, USA) and then through a 1-mm screen in a Cyclotec mill (Tecator 1093, Tecator AB, Hoganas, Sweden) before they were analyzed for DM, CP (No. 988.05, AOAC, 1997), NDF, and ADF expressed exclusive of residual ash (Van Soest et al., 1991 and No.973.18, AOAC, 1997, respectively). Water-soluble carbohydrate (WSC) content was measured using the method of Kim and Adesogan (2006). The DM losses were estimated according to fresh weight and DM contents which were measured before and after different terminated periods.
In vitro fermentation studies
The in vitro gas production (GP) was assessed according to Menke and Steingass (1988) using calibrated glass syringes (Model Fortuna, Häberle Labortechnik, Germany). Approximately 200 mg of each substrate were accurately weighed and placed into 100-mL glass syringes fitted with plungers. The syringes were filled with 30 mL of medium comprising 10 mL of rumen fluid and 20 mL of buffer solution as described by Menke and Steingass (1988). Rumen fluid was collected from three donor sheep weighing 40.0 (SD 4.6) kg and fed with a mixed diet of lucerne hay and a concentrate mixture (50:50, w/w), which was formulated to meet 1.3 times maintenance requirement for fattening sheep (MoA, 2004). Ingredients and nutrients composition (% DM) of the diet are shown in Table 1.
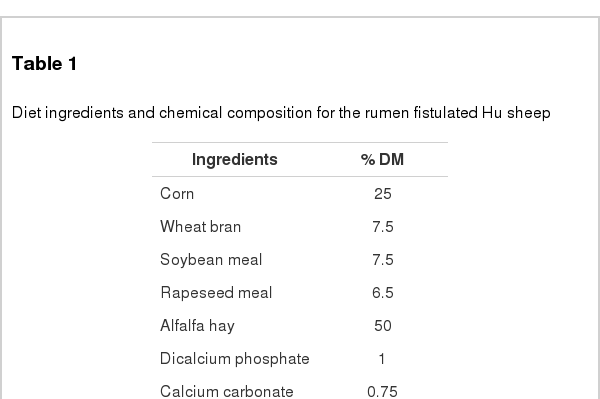
Diet ingredients and chemical composition for the rumen fistulated Hu sheep
The GP was recorded after 2, 4, 6, 9, 12, and 24-h incubations. Ammonia-N and pH of the fluid were analyzed after incubations, as described above. Content of volatile fatty acid (VFA) was analyzed by gas chromatography (GC-8A; Shimadzu Corp., Kyoto, Japan) as described by Hu et al. (2005).
Calculation and statistical analysis
To describe GP dynamics over time, the following equation was used to fit the data to the model described by Ørskov and McDonald (1979): GP = a+b (1−e−ct), where GP = the cumulative GP (mL) at time t (h), a = the GP from the immediately soluble fraction (mL), b = the GP from the insoluble fraction (mL), (a+b) = the potential GP (mL), c = the GP rate constant (%/h), and a, b, and c are constants.
The in vitro OM digestibility (IVOMD) was estimated using the following equation (Menke and Steingass, 1988): IVOMD (%) = 0.986 GP+0.0606 CP+11.03, where GP = the cumulative GP (mL), and CP = the substrate CP content (g/kg).
Statistical analysis was conducted using SAS software (SAS Institute, 2000). All data were analyzed according to a 4 × 4 factorial design using the GLM procedure. A two-way ANOVA was used for all analyzed parameters to determine the primary and interactive effects of temperature and time on the storage of WBG. Orthogonal polynomial contrast was used to examine the responses (linear and quadratic) to the temperature at different periods of air exposure. Statistically significant difference was defined at p<0.05, highly significant at p<0.01.
RESULTS
Sensory evaluation of surface spoilage
Sensory spoilage occurred on the surface of the WBG is listed in Table 2. When the WBG was stored at 5°C, no visible spoilage was observed up to 72 h. Deterioration was not observed at 15°C, until after 60 h of storage where a slight mold growth was apparent. Mold growth was detected earlier at 36 h stored at 25°C on the WBG. The most marked deterioration occurred at as early as 12 h for storage carried out at 35°C. Severe spoilage was observed after 48 h, which was characterized by the worst spoilage rating of 5.
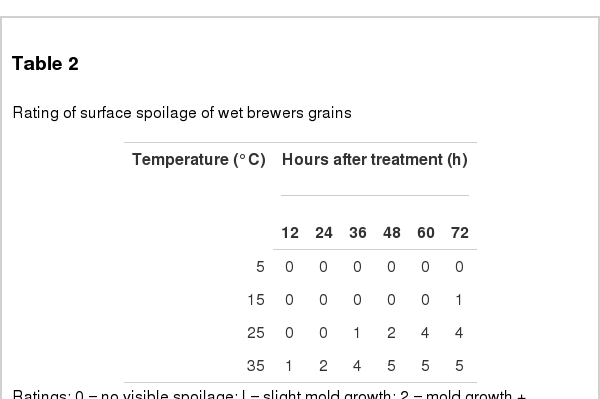
Rating of surface spoilage of wet brewers grains
Chemical composition change of wet brewers grains
Chemical changes and the DM losses of WBG during storage are shown in Table 3. Contents of CP, NDF and WSC decreased (linear and quadratic, p<0.01) in response to increasing temperatures, with the lowest values of CP and WSC observed when WBG was stored at 35°C for 3 d. On the other hand, the least NDF value was observed at 35°C after 2 d. General increase in the ADF content (linear and quadratic, p<0.01) was noted with increasing temperature or storage time, with the highest value (21.5%) observed at 35°C after 3 d of storage. The DM loss of WBG increased linearly with temperature and storage time, with greatest loss observed at 35°C after 3 d of storage. The relationships between temperature and storage time were significant for the CP, NDF, ADF, and WSC contents, and for the DM loss (p<0.01).
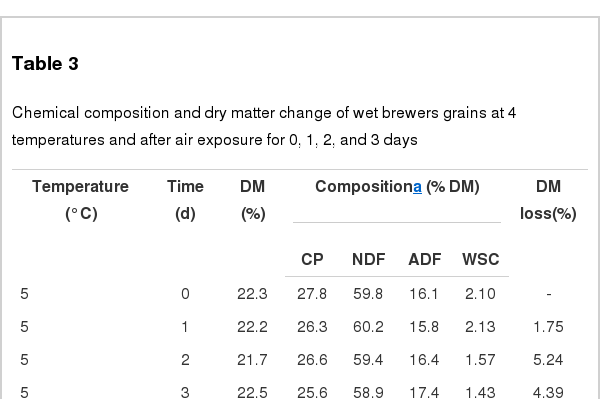
Chemical composition and dry matter change of wet brewers grains at 4 temperatures and after air exposure for 0, 1, 2, and 3 days
pH, ammonia-N and microorganism variety
No differences in pH, ammonia-N concentration and number of molds and yeasts were observed for the 5°C treatments during the entire 3-d period. The pH varied between 5.50 to 6.23 at 5°C–25°C, dropped slightly from 6.16 to 5.93 during the first day at 35°C, and then rose quickly to 8.48 after 1 d (Figure 1). Little change was observed in the ammonia-N concentration before 2 d among the 5°C, 15°C, and 25°C groups, where almost all values ranged from 0.005 to 0.010 mg/g FM without significant changes (p>0.05). Although a general increasing trend in ammonia-N concentration was observed, this was the most obvious the WBG stored at 35°C. Changes in the yeast and mold populations are displayed in Figure 1. The mold and yeast count rose with time at 25°C before 2 d of storage and then decreased gradually, with a peak count occurring between 1 and 2 d at 35°C, followed by a drop. Total count of fungi was higher at 25°C than at 35°C during the three days. Overall, the climb at 15°C was slowly than that at 25°C and 35°C. Notably, total counts of the mould and yeast changed negligibly at 5°C.

The pH, ammonia-nitrogen (NH3-N), total viable mold counts (molds), and total viable yeast counts (yeasts) change in wet brewers grains during 3 days of storage at 5, 15, 25, or 35°C in the dark. The bars indicate the standard deviation. Where not visible, the bars fall within the symbols.
In vitro gas production variables
The IVOMD and in vitro GP parameters at 24 h incubation are listed in Table 4. The GP changed (linear and quadratic, p<0.01) differently at various temperatures in response to incubation duration. Higher GP values were observed when WBG were placed at 5°C for 1 d, 15°C for 2 d, 25°C for 1 d, or 35°C for 0 d, respectively. However, the lowest GP value (18.8 mL) was observed at 25°C after 3 d. Both the potential GP (a+b) and IVOMD decreased (linear and quadratic, p<0.01) with increasing temperatures. The potential GP at 3 d were 22.5 and 33.2 mL at 35°C and 5°C, respectively. The lowest total GP and IVOMD values were observed at 35°C. Prolonging storage time generally decreased the GP and the IVOMD (linear and quadratic, p<0.01). Potential GP also decreased under these conditions (linear, quadratic, p<0.01 and p = 0.02, respectively). The greatest c value (8.41%/h) was observed when the WBG were stored for 1 d. The relationship between temperature and storage duration was significant for each GP parameter and IVOMD (p<0.01).
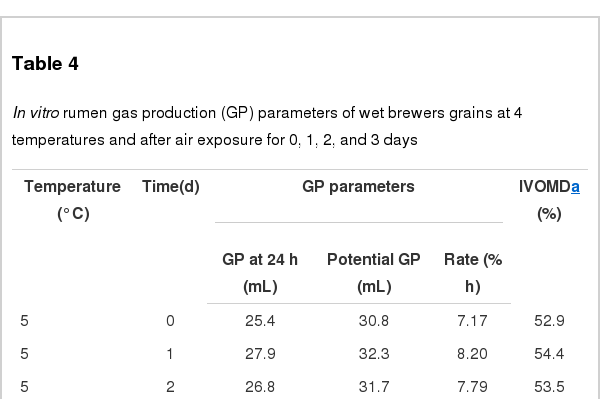
In vitro rumen gas production (GP) parameters of wet brewers grains at 4 temperatures and after air exposure for 0, 1, 2, and 3 days
In vitro fermentation variables
The effects of temperature and storage time on in vitro fermentation parameters are displayed in Table 5. The pH (linear and quadratic, p≤0.03), ammonia-N (p<0.04), acetate (p = 0.01) and butyrate (linear and quadratic, p<0.01) concentrations, and ratio of acetate to propionate (p<0.01) generally increased in response to rising temperatures. The greatest pH, acetate, butyrate, and acetate to propionate ratio were observed at 35°C. The lowest values of total VFA and propionate were also detected at 35°C. Total VFA and propionate decreased with time (linear, p≤0.01), whereas butyrate concentrations and the acetate to propionate ratios increased linearly (p<0.01). However, the pH and ammonia-N and acetate concentrations did not change significantly among the 4 time points. The highest ammonia-N value was 5.04 mg/dL when the WBG were stored at 25°C for 1 d.

In vitro rumen fermentation parameters of wet brewers grains at 4 temperatures and after air exposure for 0, 1, 2, and 3 days
DISCUSSION
Sensory evaluation of surface spoilage
Apart from providing a source of brewer’s yeasts (Saccharomyces cerevisiae and ubarium) that harbor saccharification enzymes (Ashbell et al., 2002), malt barley also provides good flavor that enhances the palatability of WBG as the yeasts compete with the mold during the beginning stages of spoilage even at 35°C (Björnberg and Schnürer, 1993; Ashbell et al., 2002). Although our observation showed a 100,000-fold increase in mold number when WBG were stored at 35°C, this sharp increase in brewer’s yeast may be advantageous to the animals because of saccharification. The WBG stored at 35°C can be fed to ruminants only for 1 d.
Changes in chemical composition of wet brewers grains
In the present study, we evaluated the acute trends and mechanisms that occur during the short storage time of WBG at different temperatures. The correlation between DM loss and WSC changes was negative (R2 = 0.7362, p<0.01), indicating that most of the spoilage substrate produced during WBG aerobic fermentation was composed of intercellular contents rather than cell wall constituents (Hlödversson, 1986; Hill and Leaver, 2002). Moreover, the DM loss was positively correlated with the time (h) that spoilage began (Table 2) at the higher temperature (R2 = 0.999, p<0.05 and R2 = 0.9976, p<0.05, for 25°C and 35°C, respectively). The CP change was not as big as the DM and WSC, probably due to the enhanced production of ammonia-N by increased mold and yeast populations, a characteristic of decreased proteolytic fermentation (Zopolatto et al., 2009).
Little changes were observed in the NDF at lower temperatures while ADF generally increased at all temperatures (Table 3), indicating that most of the DM loss was derived from the WBG hemicellulose. This contrasts with the findings of Coblentz et al. (1996) and Turner at al. (2002), who observed that all of the cell wall components constantly increased during the entire storage period. This observation may be attributed to the more easily degradable hemicellulose in WBG than in the forages that the previous researchers used. The increased ADF contents during aerobic fermentative drying may be attributed to the relative decrease in other cell contents (Santos et al., 2010).
pH, ammonia-N concentration and microorganism variety
McDonald et al. (1991) reported that the pH, odor and inner temperature can reflect deterioration of materials. The alkaline pH (8) of WBG stored at 35°C for 3 d consistent with the 14-fold ammonia-N increase was observed by Droppo et al. (1985) for the same spoiled sample. However, the incompatible pH value with ammonia-N at 25°C after 3 d merits the needs for further evaluation. Nevertheless, ammonia-N is likely produced by anaerobic saprophytic mold organisms (Schefferle, 1965), given that the interior of the samples were kept under anaerobic conditions. Form the results in Figure 1, the higher ammonia-N content at 35°C can be accounted by the higher mould counts.
Although the typical S growth curves of microorganism were displayed for both molds and yeasts at 15°C, the plateaus phase appeared earlier after 2 d at higher temperatures (25°C and 35°C) and attenuated thereafter. This phenomenon is most likely due to the S growth of mold and its mycotoxins production (Higgins and Brinkhaus, 1999), Aspergillus (Monica et al., 2007), Penicillium, Mucor, Rhizopus and Fusarium (Sodhi et al, 1985) in the WBG. Mycotoxins and secondary metabolites produced by fungi are extremely harmful to both human and animal health (Fink-Gremmels, 1999; CAST, 2003). Therefore, WBG with extensive mold growth, as observed for samples stored at 25°C and 35°C at 1d and thereafter, should not be fed to dairy cattle. Additionally, the early plateau may be due to the inherent high moisture content of the WBG samples (Ashbell et al., 2002). Therefore, lower temperatures (Samli et al., 2008) are critical for maintaining the good quality of WBG, especially in the highly humid tropical regions.
However, an advantage of the high microorganism numbers in this experiment was that the yeast populations highly dominated over the mold populations at the highest temperature of 35°C after 1 d of storage. This is not surprising as the yeast population was 10-fold higher than the mold at the initiation of the experiment (Maciorowski et al., 2007). This may ameliorate the palatability of the WBG at such high storage temperatures.
In vitro fermentation variables
Given the data presented in Table 4 and 5, WBG can be safely stored for 3, 3, 2, and 1 d at 5°C, 15°C, 25°C, and 35°C, respectively, which are all one day longer than the safe storage times at 15°C, 25°C, and 35°C based on the criteria presented in Table 2. However, these conditions precisely coincided with the pH and ammonia-N changes of the groups (Figure 1). The GP production displayed the worst deterioration at a storage temperature of 35°C for 1 d, resulting in a decrease of 12% but may be compensated by the beneficial effects of yeast domination during the first 24 h of storage. Furthermore, only a slight in vitro rumen pH change was observed during the first 24 h of WBG storage (Table 5). This change seems to be attributable to the different structural integrity of the forage cell wall, which was reduced during the later stages of deterioration after 10 d (Madrid et al., 2002; Hill and Leaver, 2002).
There are few studies of the effect of temperature and duration time on the storage quality of WBG. In this aspect, our findings of sensory evaluation, microorganism development, nutrient loss and effects on rumen fermentation have provided informative basic data for the usage of WBG in ruminants. In conclusion, if WBG is stored for less than 3, 1, and 1 d at 15°C, 25°C, and 35°C, respectively, they can be safely fed to dairy cattle. However, the maximum of storage duration margin can be extended up to 1 d at the highest temperature of 35°C due to the beneficial effects of the yeast inherent to WBG. Certainly, further work is required to clarify the details of the mold occurrence during the storage of WBG and to investigate the effects of preservatives on the quality and nutritional values of WBG at high temperature.
ACKNOWLEDGEMENTS
This study was supported by grants from the China Agriculture Research System (No. CARS-37). We are grateful to the staff and students of the Institute of Dairy Science (Hangzhou, China) for their assistance in the sampling and analysis of the feeds and rumen fluid. Special thanks also go to the personnel of the Hangzhou Hua-run Snow Beer Co., Ltd. (Hangzhou, China) for providing the WBG samples, and to Dr. L.J. Lo for the critical review of the manuscript for language matter.