Data Build-up for the Construction of Korean Specific Greenhouse Gas Emission Inventory in Livestock Categories
Article information
Abstract
Many studies on methane (CH4) and nitrous oxide (N2O) emissions from livestock industries have revealed that livestock production directly contributes to greenhouse gas (GHG) emissions through enteric fermentation and manure management, which causes negative impacts on animal environment sustainability. In the present study, three essential values for GHG emission were measured; i.e., i) maximum CH4 producing capacity at mesophilic temperature (37°C) from anaerobically stored manure in livestock category (B0,KM, Korean livestock manure for B0), ii) EF3(s) value representing an emission factor for direct N2O emissions from manure management system S in the country, kg N2O-N kg N−1, at mesophilic (37°C) and thermophilic (55°C) temperatures, and iii) Nex(T) emissions showing annual N excretion for livestock category T, kg N animal−1 yr−1, from different livestock manure. Static incubation with and without aeration was performed to obtain the N2O and CH4 emissions from each sample, respectively. Chemical compositions of pre- and post-incubated manure were analyzed. Contents of total solids (% TS) and volatile solid (% VS), and the ratio of carbon to nitrogen (C/N) decrease significantly in all the samples by C-containing biogas generation, whereas moisture content (%) and pH increased after incubation. A big difference of total nitrogen content was not observed in pre- and post-incubation during CH4 and N2O emissions. CH4 emissions (g CH4 kg VS−1) from all the three manures (sows, layers and Korean cattle) were different and high C/N ratio resulted in high CH4 emission. Similarly, N2O emission was found to be affected by % VS, pH, and temperature. The B0,KM values for sows, layers, and Korean cattle obtained at 37°C are 0.0579, 0.0006, and 0.0828 m3 CH4 kg VS−1, respectively, which are much less than the default values in IPCC guideline (GL) except the value from Korean cattle. For sows and Korean cattle, Nex(T) values of 7.67 and 28.19 kg N yr−1, respectively, are 2.5 fold less than those values in IPCC GL as well. However, Nex(T) value of layers 0.63 kg N yr−1 is very similar to the default value of 0.6 kg N yr−1 in IPCC GLs for National greenhouse gas inventories for countries such as South Korea/Asia. The EF3(s) value obtained at 37°C and 55°C were found to be far less than the default value.
INTRODUCTION
Worldwide agricultural sectors play a significant role in greenhouse effect (Amon et al., 2001). Greenhouse gases (GHG) emission from agricultural sectors include livestock rearing, rice cultivation, crop residue burning and agricultural soil (Gupta et al., 2007). According to the improvement of living standards and the changes of dietary life in recent years, the total livestock population has rapidly increased accompanying the amount of its manure (Lu et al., 2008; Wang et al., 2010). Livestock production with animals directly contributes to emissions through enteric fermentation and manure management. Methane is produced during the normal digestive processes of animals. Ruminant animals are the major contributors to methane emission (about two thirds of CH4 emissions of 6.8 Tg yr−1 in the EU; Moss et al., 2000) due to the type of digestive process by which carbohydrates are broken down by micro-organisms and methane is released as a by-product of enteric fermentation (Stevens and Hume, 1995). Non-ruminant animals also produce some methane, although not as much as ruminants due to the limitation of enteric fermentation occurrence in the post-gastric compartment such as cecum and large intestines (Robinson et al., 1989; Sukahara and Ushida, 2000). Methane (CH4) increased from 715 parts per billion by volume (ppbv, 1,988 Tg) to 1,774 ppbv (4,932 Tg); and nitrous oxide (N2O) from 270 ppbv (1,296 Tg) to 319 ppbv (1,531 Tg) between 1750 and 2005 (4.8 Tg N = 1 ppbv, 2.78 Tg CH4 = 1 ppbv, and 2.13 Gt C = 1 ppmv; IPCC 2001, 2007). Anthropogenic processes are estimated to be responsible for 55% to 70% of the global CH4 emissions of 600 Tg yr−1 into the atmosphere. The global warming potential of CH4 and N2O is approximately 21- and 310-fold, respectively higher than that of CO2 (IPCC, 1996). Of total global anthropogenic emissions of GHGs in 2005, agriculture accounted for about 58% (2.8 Gt CO2-eq yr−1 ) of N2O and about 47% (3.3 Gt CO2-eq yr−1 ) of CH4 (IPCC, 2007). With a mean annual emission rate of about 60 Mt CO2-eq yr−1 between 1990 and 2005, global agricultural CH4 and N2O emissions increased by nearly 17% (IPCC, 2007). Globally, livestock-related N2O and CH4 emissions are about 1.8 Gt CO2-eq yr−1 and 2.17 Gt CO2-eq yr−1 (1.8 from ruminants+0.37 from manure, respectively) (Steinfeld et al., 2006). Production and emission of CH4 and N2O from manure does not depend only upon digestibility and composition of feed, species of animals, and their physiology but also upon manure management practices and environmental conditions such as sunlight, temperature, precipitation, wind, etc. (Yamulki et al., 1999; Brown et al., 2002; Park et al., 2006, Gupta et al., 2007).
Nitrous oxide is produced via the nitrification-denitrification process that occurs from nitrogen sources in manure. The majority of nitrogen sources in manure are present in ammonia form and nitrification occurs aerobically and converts ammonia-N into nitrate, while denitrification occurs anaerobically, and converts the nitrate to N2O. Temperature, pH, biochemical oxygen demand, and nitrogen concentration affect N2O generation (Sorai et al., 2007). Increasing aeration initiates the nitrification reactions, followed by the denitrification under anoxic condition, which causes N2O generation. Since fresh dung and slurry has sufficient alkalinity and stay at near neutral pH, N2O production may be presumably expected to increase with increasing aeration. However, N2O emissions from animal manure are not clear since there is not enough quantitative data to derive a relationship between the degree of aeration and N2O emissions (Sorai et al., 2007).
GHG emission values from livestock industry are separated into two categories; i) enteric fermentation and ii) manure treatment processes. Many studies for GHG emissions have been carried out with respect to the enteric fermentation but GHG emission from manure treatment processes has been rarely studied (Wang and Huang, 2004). Regional-specific emission inventory for CH4, N2O and NH3 via animal faming was reported in south, southeast and east Asia (Yamaji et al., 2003) and the US is first to develop the B0 values in livestock categories. However, there is no useful documents about B0 on the development of the GHG emission values from other countries (Safley, 1992, EPA/400/1-91/048, Global Methane Emissions from Livestock and Poultry Manure). Japan has developed default GHG emission values based on IPCC 1996 (National Greenhouse Gas Inventory Report of Japan, 2006). Further, New Zealand also has their own GHG emission values but only for grazing animals like milking cow, beef, lamb, and deer. However, GHG emission values for other types of livestock are estimated based on IPCC GL. Due to a lack of the information about CH4 and N2O emissions from manure management system of South Korea/Asia, some previous emission inventories in Asia were prepared using IPCC default emission factors (Garg et al., 2001; Yamaji et al., 2003). There is no GHG emission values in any national report from Korea though the study on the development of country specific values was started in 2009. IPCC recommends using IPCC guideline (GL) 1996, 2001, and 2006 to develop greenhouse gas (GHG) emissions for country GHG emission statistics. If countries have their own specific data, it would be preferred over the general GHG emission values from IPCC which has large uncertainties. In order to develop country specific GHG emission factors, it is required to ensure data accumulation for 3 years at least (IPCC, 1996). Therefore, this study aims to obtain the i) B0,KM of anaerobically stored manure in Korea, ii) EF3(s) from aerobically treated stored manure, and iii) Nex(T) values, from the different livestock categories in Korea.
MATERIALS AND METHODS
Experimental apparatus
House-made test set by modifying EPA method 18 (1981) and method 0040 (1998) was prepared for this study. A high density polyethylene sealable container of dimensions 26.2 cm×20.3 cm×27.2 cm (bottom diameter× top diameter×height) was used in the entire experiment. A polyethylene connector with a pipe thread and a hose barb (0.48 cm) was mounted firmly to the container’s lid. A sure seal was achieved by use of a silicon sealant. A heavy rubber hose (0.48 cm i.d.) was connected to the incubator container and the other end was connected to a Tedlar gas collection bag (Nouchi et al., 1990; Cho et al., 2012). Tedlar bags were inspected regularly. For N2O measurement, an air stone was placed at the bottom of incubation vessel and air was supplied through an extra pipe. Because manure in a heap is turned at regular interval (2 or 3 times d−1) and air is trapped in the manure during each turn, aeration was supplied into the incubation vessel throughout the experiment in order to mimic the manure management practices.
Livestock manure
The manure (dung and urine) from three different animal categories (i.e. sow, layers and Korean cattle) were collected from the farm operated by Kangwon National University in South Korea, where all livestock were being raised according to the Korean Feeding Standard. For each set of experiments fresh manure were collected and immediately processed.
Procedure
In all the trials for CH4 and N2O measurement, manure samples (1 kg) were mixed with 250 g of plastic beads (5 mm diameter) to avoid entrapment of gases produced during incubation, and transferred in incubator vessel. For B0 measurement, mixed liquor from a full-scale mesophilic anaerobic digester was used as inoculums at the rate of 250 mL/kg manure. Pure N2 gas was sparged into the vessel in order to form anaerobic condition and the vessel was placed in water baths maintaining temperature at 37°C until no more gas produced. A control vessel contained only the same amount of mixed liquor and was exposed to the same condition of other testing manure vessels.
Testing of aeration cycles for maximum N2O emission was carried out using sow manure. Manure was then incubated at 37°C and 2 L air at a rate of 500 mL min−1 was given into the incubation vessel at different time intervals (2, 4, 6, 8, 12, and 16 h) until no more gas produced.
For N2O emission from sow, layers and Korean cattle, each fresh manure sample was added in incubating vessels. Incubation was performed at mesophilic (37°C) and thermophilic (55°C) temperatures until no more gas collected. All gas samples in Tedlar bags were analyzed in triplicate.
Calculation of emission factors
For the estimation of CH4 EF(T) for manure (liquid/slurry), we measured the B0(T) value, according to IPCC, 2006 Tier 2 emission factors for manure management practices equation,
where, EF(T): annual CH4 emission factor for livestock category T, kg CH4 animal−1 yr−1; VS(T): daily volatile solid excreted for livestock category T, kg dry matter animal−1 d−1; 365: basis for calculating annual VS production days yr−1; B0(T): maximum CH4 producing capacity for manure produced by livestock category T, m3 CH4 kg−1 of VS excreted; 0.67: conversion factor of m3 CH4 to kilogram CH4; MCF(S,k): CH4 conversion factor for each manure management system S by climate region k, % and MS(T,S,k): fraction of livestock category T’s manure handled using manure management systems S in climate region k, dimensionless.
For the calculating the direct N2O (kg) emissions from manure management in the country, according to equation Tier 1, IPCC, 2006 GLs, we measured the emission factor (EF3(s)) and annual average N excretion per head of species/category (Nex(T)).
where, N2OD(mm): direct N2O emissions from manure management in the country, kg N2O yr−1; N(T): number of head of livestock species/category T in the country; Nex(T): annual average N excretion per head of species/category T in the country, kg N animal−1 yr−1; MS(T,S): fraction of total annual nitrogen excretion for each livestock species/category T that is managed in manure management system S in the country, dimensionless; EF3(S): emission factor for direct N2O emissions from manure management system S in the country, kg N2O-N kg N−1 in manure management system S; S: manure management system; T: species/category of livestock; 44/28: conversion of (N2O-N)(mm) emissions to N2O(mm) emissions.
Analytical methods
Gas measurement
The gas volume was measured by drawing the gas out of the Tedlar bag and passing it through MP-E30-Minipump (Sibata-8086-030). For CH4 and N2O measurement, a total of 60 mL gas was withdrawn using a 3-way plastic syringe of 60 mL and analyzed using ‘Gas Chromatograph’ (Varian 450) equipped with FID (flame ionized detector), ECD (electron capture detector), and TCD (thermal conductivity detector) and five stainless steel columns packed with Hayesep Q (80/100, 0.5 m×1/8” SS); Porapak–Q (80/100; 2 m×1/8” SS); Porapak–Q (80/100; 0.5 m×1/8” SS); Porapak–Q (80/100; 3 m×1/8” SS) and Porapak Q–(80/100; 0.5 m×1/8” SS). The oven temperature was set at 70°C, while the temperature for FID, TCD, and ECD was 250°C, 220°C, and 350°C, respectively. The flow rate of N2 (carrier gas) and H2 was 30 mL min−1, air was 300 mL min−1, whereas for helium as makeup gas was 10 mL min−1. For ECD and TCD, makeup gases were N2 (10 mL min−1) and He (10 mL min−1), respectively. CH4 (2.1 μmol mol−1) and N2O (1.0 μmol mol−1) calibrations gas standards (Research Institute of Gas Analytical Science) were used. The peak of CH4 and N2O identified on the basis of retention time was 1.15 and 4.4 min, respectively and the response factor obtained was used to calculate parts per million of each gas in the sample.
Chemical composition analysis of manure
Each manure sample was analyzed for pH, total solids (TS), total volatile solids (TVS), total soluble organic carbon (TOCs), total nitrogen (TN) and C/N (carbon to nitrogen) ratio by using standard protocol before and after incubation (APHA, 2005).
Statistical analysis
The significant differences of manure characteristics before and after incubation within each livestock category were statistically analyzed by one-way ANOVA (analysis of variance) at p<0.05 and multiple comparisons were performed with Tukey’s test in SYSTAT version 6.0.1 (1996,SPSS Inc.).
RESULTS AND DISCUSSION
Manure characteristics
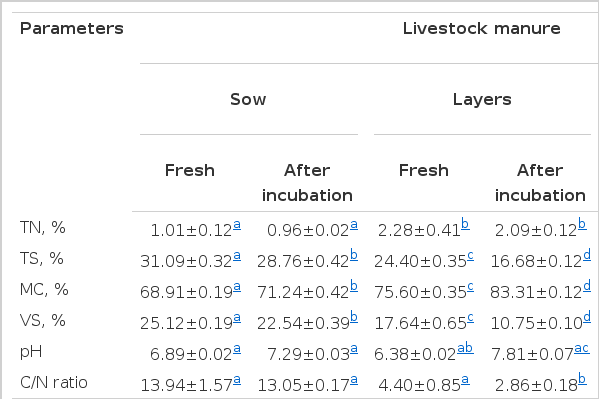
As expected, the fresh manure had different characteristics according to the different excretory pattern of the animals (Petersen et al., 1998; Smith et al., 2001; Loyon et al., 2008). The layer manure had higher levels of total nitrogen (2.28%), which is over two and seven times higher than sow (1.01%) and the Korean cattle (0.38%), respectively (Table 1), and in corroboration with Loyon et al. (2008). Similarly, % TS and moisture content (%) significantly differs in all the categories of livestock manure. However, % VS of layers (17.64%) and the Korean cattle (17.00%) do not show any significant difference (p<0.05). pH of Korean cattle manure (7.16) was higher than those of sow (6.89) and layers (6.38). C/N of Korean cattle was higher (31.01), followed by sow (18.60) and layers (13.19).
Characteristics of manure from different animal category stored under anaerobic conditions
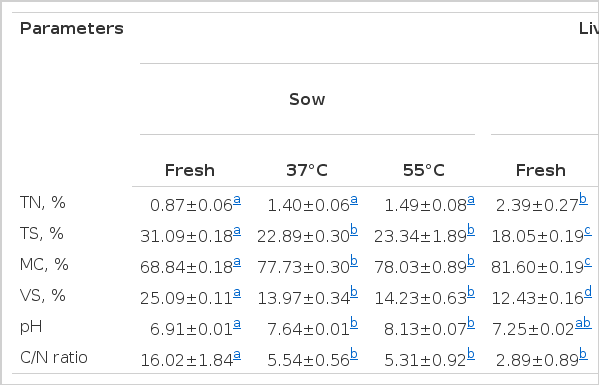
Manure collected for N2O emission experiments after 120 days showed similar patterns of % TN, % TS, C/N ratio and moisture content (%) as discussed above. However, the significant difference (p<0.05) of % VS was observed in layers and Korean cattle manure (Table 2).
Characteristics of manure from different animal category stored for N2O emission
After an incubation period of 30 days at 37°C under anaerobic condition, % TN was not changed considerably in sow, layers and Korean cattle manure (Table 1). In contrast, % TS was significantly (p<0.05) decreased in sow and layers manures. However, % TS of Korean cattle was not changed during the experimental period. The % VS and C/N ratio in all the manure samples were significantly decreased (p<0.05) after the incubation, which were reported by Kulling et al. (2003) showing significant decrease in C/N ratio of liquid and farmyard dairy manure after a storage period of 5 weeks.
After an incubation period until no more gas produced at 37°C and 55°C with 2 h aeration interval, no significant change in % TN of three livestock manure was observed at both temperatures (Table 2). However, % TS and % VS were significantly decreased in all three manure categories (p<0.05) while no significant effect of temperature was observed on % TS and % VS. Moisture content (%) and pH were significantly increased in all the samples (p<0.05), whereas C/N ratio was not changed significantly. No significant decrease in C/N ratio was observed at both mesophilic and thermophilic temperature with layers manure. In case of sow and Korean cattle manure, there is significant reduction in C/N ratio after incubation (p<0.05). Sow manure showed no difference in decrease of C/N ratio at both mesophilic and thermophilic setting, but more decrease of C/N ratio in thermophilic setting was analyzed than that in mesophilic setting for cattle manure (p<0.05).
This might be caused by the easily degradable C compounds present in manure. In addition, high moisture present in the cattle and sow manure may better distribute the C and N and thus induce higher degradation and rate of loss from partially anaerobic micro sites. This condition is more preferred for N2O emission rather than CH4 emission which requires highly anaerobic conditions (Velthof et al., 2003). Thus results obtained are in accordance with the previous research.
Methane emissions and B0,KM value
The main factors affecting CH4 emissions in IPCC (1996) are the amount of manure produced and the portion of manure that decomposed anaerobically. The former depends on the rate of the waste production per animal and the number of animals, and the latter on how manure is managed. In addition, many studies have revealed that temperature had a strong influence on CH4 emissions of animal manure. Gupta et al. (2007) reported that the amount of CH4 produced during a storage period was affected by the ambient and heap temperature variations, which influences methanogenic bacterial growth and thus CH4 formation. Therefore, CH4 emission was studied at mesophilic temperatures in this study to simulate the field manure handling condition.
As seen in Table 3, the highest CH4 emissions were measured from Korean cattle manure, compared to sow and layers manure. In this study, C/N ratio of fresh Korean cattle manure was 31.01, which was significantly higher than sow and layers manure (Table 1). Kulling et al. (2003) also reported the differences of CH4 emissions are caused by the carbon availability.

Comparisons of B0 from IPCC and this work in m3 CH4 kg VS−1 in Korea using Tier 2 methodology from IPCC, 2006
Emission estimation in IPCC (1996) uses variables such as the diversity and range of animal populations, as well as manure management practices among regions and countries. Hence, to get country specific B0 value of manure in Korea (B0, KM) is essential to improve the estimation. Thus, in present work B0, KM was estimated from the manure of each livestock category in South Korea, following Tier 2 methodology. Current IPCC default B0 for Asia/Latin America (IPCC, 2006) and those obtained in this work are shown in Table 3. The maximum B0 values from IPCC (0.29 and 0.39 [±15%]) for sow and layers respectively, in temperate climate are much higher than the maximum value obtained in this study. However, B0, KM value of 0.083 m3 CH4 kg VS−1 for Korean cattle was comparable to IPCC value of 0.1 (±15%). A similar report by Gonzalez-Avalos and Ruiz-Suarez (2001) stated that methane emission factor was less than a factor of five than proposed IPCC value while estimating the methane emission from cattle manure in Latin America. The low B0,KM value in case of sow and layers may be due to the diet as methane emissions largely depends on the type of diet (Kumar et al., 2009,2013,2014). Feeding high forage diet leads to more methane emission compared to concentrate rich diet. It has been reported that in the US and European countries forage are fed in higher amount than concentrate, while Korean breeding circumstances gives more concentrate than forage diet. Further, Park et al. (2006) reported that methane conversion factor (MCF = 0.39) recommended for climate with annual temperature <15°C, which is clearly an overestimate for cold climates with MCF<0.25. The default MCF value are only laboratory based and have so far not been verified under field conditions.
Effect of aeration on N2O emission
Nitrification is a necessary prerequisite for the emission of N2O and it depends upon the supply of oxygen. Therefore, in order to minimize the uncertainty in EF and mimic the manure management practices, effect of aeration for different time interval was studied for maximum N2O emission at ambient temperature and incubation period of more than 100 days.
It is clearly evident from the Figure 1 that N2O emission was higher (0.049 g) when 2 L air was provided at every 2 h interval, whereas when air was provided at 4, 6, 8, 12, and 16 h interval, emission was 0.005, 0.004, 0.002, 0.003, and 0.004 g, respectively. Moreover, after 78 days of incubation N2O was either below the detectable limit or there is no emission at 4, 6, 8, 12, 16 h interval, whereas emissions consistently increased and reached up to 0.626 g after the complete storage period of 120 days with 2 h interval (data not shown). As N2O emission is attributed to the succeeding periods of mineralization, nitrification, and denitrification (Chadwick et al., 2000), organic N in manure has to be mineralized first and then transformed into nitrate and nitrite by nitrifiers. This requires a time for the reaction and proper oxygenic conditions. Further, maintaining the appropriate oxygenic condition is an important factor for complete nitrification and N2O emission. Since all the physico-chemical conditions are similar, lower N2O emissions when compared to that at 2 h interval was probably caused by incomplete nitrification.
Accumulated N2O at different aeration cycles.
N2O emission and EF3(s)
When the cumulative N2O emission from 1 kg manure was compared in different temperatures (37°C and 55°C), sow manure produced significantly (p<0.05) higher N2O at 37°C (0.26 g) than at 55°C (0.01 g). For layers manure, no difference in emission (0.028 and 0.027 g) was observed at 37°C and 55°C, respectively. However, N2O emissions were significantly higher (0.49 g) at 55°C compared to that at 37°C (0.19 g) in Korean cattle manure. The results would be caused by the complex nature of N2O generation in manure, which may vary in response to the difference in characteristics of manure. According to Paul and Beauchamp (1989) and Kirchmann and Lundvall (1993), VS in the manure is easily metabolized by bacteria and induces to increase denitrification and/or immobilization of N, thus resulting in higher N2O emission. From Table 2, % VS of sow was higher than that of layers and Korean cattle. In case of sow, emission was higher at 37°C in spite of similar % VS loss at 37°C and 55°C. The high pH of 8.13 at 55°C might have resulted in ammonia formation which has antagonistic relation with N2O release (Beck-Friis et al., 2000), resulting lower N2O emission. In case of layers manure, decrease in % VS at both temperatures was low, low N2O emission. However, in Korean cattle significant decrease in % VS was observed and the decrease was considerably higher at 55°C. Because the pH of the manure at both mesophilic and thermophilic temperature was similar, VS would affect N2O emissions. In addition, Granli and Bockman (1994) reported the denitrification process increases at higher temperatures in accordance with this experimental result. Therefore, it could also be concluded that N2O emission is highly dependent on the % VS, as well as pH plays an important role.
To reflect a type of treatment for animal manure, EF3(s) (kg N2O-N kg N−1) were calculated for different livestock manure, taking aeration and temperature into account as per IPCC (1996). From the Table 4, EF3(s) (kg N2O-N kg N−1) for sow at 37°C was 0.00127 which is the highest when compared to the value from layers and Korean cattle manure (0.00016 and 0.00113, respectively), but lower than the default emission factor (0.01) for direct N2O emission from manure management suggested from IPCC GL (1996). Similarly, EF3(s) for Korean cattle was maximum (0.00189) at 55°C but far lower than the IPCC default value of either natural aeration system (0.01) or forced aeration system (0.005).
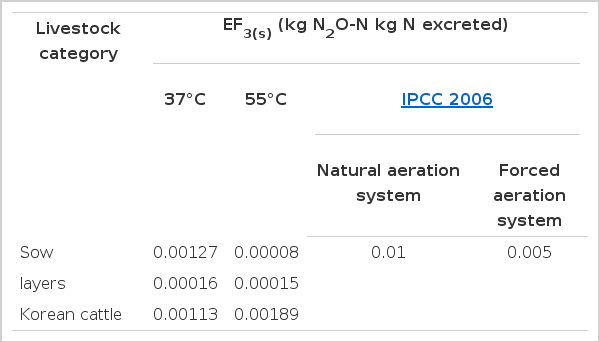
Comparisons of EF3(s) from IPCC and this work in kg N2O-N kg N−1
Annual average nitrogen excretion rates, Nex(T)
Annual average excretion rate was determined for the sow, layers and Korean cattle using the typical average animal mass for livestock category and % N values, obtained from the National Institute of Animal Sciences, South Korea. As seen in Table 5, it is clear that default Nex(T) value (kg N yr−1) obtained from IPCC (1996) is nearly 2.5 fold higher than that of obtained value for sow and Korean cattle but similar for layers. The possible reason for lower Nex(t) is lower manure production by Korean cattle (14 to 15 kg/d) compared to that of European cattle (18 to 25 kg/d) (Menzi et al., 1998).

Comparisons of Nex(T) from IPCC and this work in kg N yr−1
CONCLUSIONS
As introduced in IPCC (1996), this research was conducted to obtain the essential values; i.e., B0,KM value for CH4 emission, EF3(s) and Nex(T) values for N2O in order to construct the typical Korean specific GHG inventory. According to animal species (sow, layers, and Korean cattle), CH4 and N2O emissions were very different each other and the increase of C/N ratio induced higher CH4 emission. % VS loss and pH played important role in N2O emission which was higher at higher temperature. Consequently, the obtained basic values were mostly much less than the proposed values by the IPCC except B0,KM value for Korean cattle and Nex(T) value for layers.
The values obtained will affect the calculation of CH4 and N2O emission factors from manure and will serve as a reference to construct the country specific GHG inventory. Further, field experiments will warrant for the verification of the laboratory results and more accurate estimates of actual CH4 and N2O emission, and the present work will be expected to pave the way to build the country specific GHG inventory.
ACKNOWLEDGEMENT
We are grateful to the funding by Rural Development Administration, Korea.