Effects of Dietary Crude Glycerin Supplementation on Nutrient Digestibility, Ruminal Fermentation, Blood Metabolites, and Nitrogen Balance of Goats
Article information
Abstract
This experiment was conducted to evaluate the effects of increasing concentrations of crude glycerin (CGLY) in diets on nutrient utilization, ruminal fermentation characteristics, and nitrogen utilization of goats. Four male crossbred (Thai Native×Anglo Nubian) goats, with an average initial weight of 26±3.0 kg, were randomly assigned according to a 4×4 Latin square design with four 21 days consecutive periods. Treatments diets contained 0%, 5%, 10%, and 20% of dietary DM of CGLY. Based on this experiment, there were no significant differences (p>0.05) among treatment groups regarding DM intake and digestion coefficients of nutrients (DM, OM, CP, EE, NDF, and ADF). Likewise, mean serum glucose, BHBA, and PCV concentrations were not affected (p>0.05) by dietary treatments, whereas serum insulin concentration linearly increased (L, p = 0.002) with increasing the amount of CGLY supplementation. Ruminal pH, NH3-N, and BUN concentration were unchanged by dietary treatments, except for 20% of CGLY, NH3-N, and BUN were lower (p<0.05) than for the diets 10% of CGLY, while the difference between the diets 0%, 5%, and 20% of CGLY were not significant. The amount of N absorption and retention were similar among treatments. Based on this study, CGLY levels up to 20% in total mixed ration could be efficiently utilized for goats and this study elucidates a good approach to exploiting the use of biodiesel production for goat production.
INTRODUCTION
Because of the rising costs of energy-rich feedstuffs, alternative feed sources such as glycerin (or glycerol) have become a major focus for the livestock industry. The livestock feeding industry has readily adopted alternative feed ingredients in order to maintain or lower costs of gain. Crude glycerin (CGLY) is the principal co-product of biodiesel production, obtained in the process of transesterification of triacylglycerols of plant oils or animal fats, usually using methanol and a catalyst (sodium methylate) (Thompson and He, 2006). Approximately 7.9 kg of crude glycerin is generated per 100 L of biodiesel produced (Thompson and He, 2006), or 10% of the weight of vegetable oil or fat that is used to produce biodiesel becomes glycerin (Dasari et al., 2005). Therefore, the existing biodiesel industry is likely to provide a substantial amount of crude glycerin to be used not only for the production of chemical products, fuel additives, hydrogen, ethanol and etc., but also as an energy source in animal diets (Gunn et al., 2010a). Previous studies concluded that glycerin from biodiesel production was an acceptable source of energy for poultry (Lammers et al., 2008a; Min et al., 2010) and swine (Lammers et al., 2008b; Schieck et al., 2010).
In ruminants, different quantities of glycerin are either converted to volatile fatty acids, particularly propionate and butyrate at the expense of acetate, or are directly absorbed from the digestive system and will act as a precursor for gluconeogenesis in the liver (Rémond et al., 1993; Krehbiel, 2008). Researchers reported that 35% to 69% of the crude glycerol administered was used to produce propionate (Rémond et al., 1993). If crude glycerol increased propionate concentration, an increased gain-to-feed (GF) would be expected (Hungate, 1966). Feeding glycerin may also improve feed digestibility and increase the microbial protein production in the rumen of cattle in a dose-dependent manner (Wang et al., 2009). The potential value of crude glycerin as a major component of the diet has been reported in beef cattle (Pyatt et al., 2007; Mach et al., 2009; Parsons et al., 2009) and dairy cows (Donkin et al., 2009; Carvalho et al., 2011), and inclusions of 10% to 20% in diet DM have been used without negatively affecting to lamb performance (Gunn et al., 2010a, 2010b). However, there is little information available regarding the effects of this byproduct on the intake, digestibility, ruminal characteristics, and nitrogen balance of goats fed moderate to high amounts of glycerol, Therefore this study aimed to evaluate the effects of CGLY on feed intake, digestibility, ruminal fermentation characteristics, blood metabolites, and nitrogen balance while establishing an optimal feeding amount in goat fed diets containing corn grain.
MATERIALS AND METHODS
All procedures involving animals were approved by the Ethical Principles for the Use of Animals for Scientific Purposes of the National Research Council of Thailand (NRCT) for the metabolism study and finishing study.
Animals, treatments, and experimental design
Four male crossbred (Thai Native×Anglo Nubian) goats, about 18 months old and 26±3.0 kg body weight, were randomly assigned according to a 4×4 Latin square design to investigate the effects of crude glycerin (CGLY) on feed intake, digestibility, ruminal fermentation, blood metabolites, and nitrogen balance. The dietary treatments consisted of 0%, 5%, 10%, and 20% of CGLY (DM basis) replacing corn grain that were formulated to be isonitrogenous at 15% of CP and isocaloric at 2.63 Mcal/kg DM (on a ME basis) and to meet or exceed the NRC (1981) requirements of growing goats. The CGLY was produced in a palm-diesel facility (New Biodiesel, Surat Thani Province, Thailand) and contained 87.61% of glycerin, 8.07% of water, 1.24% of sodium, and 0.64% of methanol. Palm-derived glycerin from single batch was added to the total mixed ration (TMR) as liquid. The ingredients and determined chemical composition of the components of each diet are presented in Table 1.
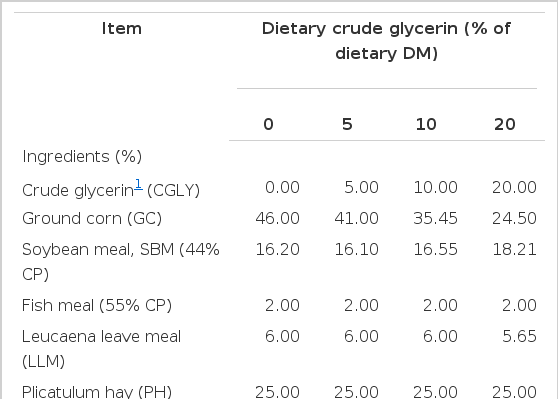
Ingredients and chemical composition of goat diets containing increasing amounts of crude glycerin (% DM basis)
All goats were kept individually in ventilated pens under well-ventilated sheds where water and mineral salt were available at all times. The experiment was conducted for 4 periods, and each period lasted for 21 days. During the first 14 d of each period, all animals were fed the respective diets for ad libitum intake, whereas during the last 7 d, the animals were moved to metabolism crates for total collection during the time goats were restricted to 90% of the previous voluntary feed intake to ensure total feed intake. Feeds were provided twice in two equal portions daily at 0800 and 1600 h. For determination of daily DMI, refusals were collected and weighed daily before feeding. Feed samples obtained each time were oven dried at 60°C for 72 h and ground to pass through a 1-mm sieve, and composited by period on an equal weight basis for further analysis. Goats were individually weighed before the morning feeding at the beginning and end of each experimental period.
Data collection and sampling procedures
Feeds, urine, and fecal samples were taken from the total collection of each individual goat in each treatment during the last 7 days of each period at the morning and afternoon feeding. Composited samples were dried at 60°C, ground (1-mm screen using Cyclotech Mill, Tecator), and analyzed for DM, ether extract, ash, CP content (AOAC, 1995), and NDF and ADF (Goering and Van Soest, 1970). NDF was analyzed without α-amylase, and the value of NDF and ADF were expressed inclusive of residual ash. Non-fibrous carbohydrate (% in the DM) was calculated as (Mertens, 1997): 100− (CP+NDF+ether extract+ash).
At the end of each period, ruminal fluid was collected from all goats by using a stomach tube at 0 and 4 h-post feeding during the digestibility trial. This was strained through 4 layers of cheese cloth and pH measured immediately using a pH meter (HANNA instruminalts HI 98153 microcomputer pH meter, Singapore) fitted with a combined electrode. The ruminal fluid was then acidified with 3 mL of 1 M H2SO4 added to 30 mL of ruminal fluid. The mixture was centrifuged at 16,000×g for 15 min, and the supernatant was stored at −20°C before NH3-N analysis by using the micro-Kjeldahl methods (AOAC, 1995) and VFA analysis by using HPLC (Samuel et al., 1997). Blood samples (about 10 mL) were collected from a jugular vein (at the same time as ruminal fluid sampling) into tubes containing 12 mg of EDTA, and plasma was separated by centrifugation at 2,500×g for 15 min at 5°C and stored at −20°C until analysis of plasma urea N according to the method of Crocker (1967). On the last day of each period, the goats were removed from the metabolism crates and transported to their individual pens for the adaptation of the next diet.
Laboratory analyses
Feed, feed refusals and feces were analyzed in duplicate for DM, ash, CF, ether extract and Kjeldahl N using AOAC (1995) procedures. Neutral detergent fiber (NDF), acid detergent fiber (ADF) and acid detergent lignin (ADL) fractions were determined with the procedure of Goering and Van Soest (1970). Digestion coefficients were calculated using the formula given by Schneider and Flatt (1975). Blood urea nitrogen (BUN) was determined according to the method of Crocker (1967), ruminal NH3-N using the micro kjeldahl method (AOAC, 1995) and VFA analyses by HPLC (Instruminalts by controller water model 600E; water model 484 UV detector; column novapak C18; column size 4 mm×150 mm; mobile phase 10 mM H2SO4 (pH 2.5), ETL Testing Laboratory, Inc., Cortland, New York, 13045, USA) according to Samuel et al. (1997). The amount of methane production was calculated from VFA composition according to Moss et al. (2000) as: CH4 production = 0.45(acetate)−0.275(propionate)+0.4(butyrate). Plasma glucose, insulin, BHBA, and packed cell volume (PCV) were measured by using commercial kits (No. 640, Sigma Chemical Co., St. Louis, USA). In urine samples, thawed urine samples were analyzed for Kjeldahl N (AOAC, 1995).
Statistical analysis
Statistical analyses were performed by using the GLM procedure (SAS Inst. Inc., Cary, NC). Data were analyzed by using the model Yijk = μ+Mi+Aj+Pk+ɛijk, where Yijk = observation from animal j, receiving diet i, in period k; μ = the overall of mean; Mi = the mean effect of CGLY concentration (i = 1, 2, 3, 4); Aj = the effect of animal (j = 1, 2, 3, 4); Pk = the effect of period (k = 1, 2, 3, 4); and ɛijk = the residual error. Treatment means were statistically compared by the new multiple range test of Duncan (Steel and Torrie, 1980) to identify differences between means. Significant differences were declared if p<0.05. Orthogonal polynomial contrasts were used to estimate the effect of CGLY supplement level.
RESULTS AND DISCUSSION
Chemical composition of feeds
The ingredients and chemical compositions of the treatments diets are presented in Table 1. The treatments diets contained 15.38% of CP, 6.41% of ash, 93.59% of OM and 19.62% of ADF on a DM basis. Dietary NFC content increased whereas NDF content decreased as proportion of CGLY in diets increased due to feeding less corn grain. Dietary Ca and P contents were similar among treatment diets.
Intake and nutrient digestibility
The effects of CGLY substitution of corn grain in the diets on feed intake and apparent digestibility of goats are presented in Table 2. Overall mean feed intakes for the four diets in terms of total DMI (% BW and g/kg BW.75), OMI, CPI, NDFI, and ADFI were not significantly affected for all dietary treatments as compared between the experimental diets (5 to 20% of crude GLY) with the control diet. Likewise, nutrient (DM, OM, CP, EE, NDF, and ADF) digestibility was not affected (p>0.05) by inclusion of CGLY in the diets. The average DM intake was numerically higher in glycerin fed groups. Whereas, intake of ADF tended to be lower in the 20% of CGLY treated goats (p, Q = 0.08) likely because of numerically reduced intakes. However, it remains unclear whether this was due to the dietary treatment. Our results are in agreement with a study by Mach et al. (2009) who fed diets containing different amounts of glycerin (up to 12% of DM) to Holstein bulls, and Gunn et al. (2010a) reported no changes in DMI when increasing concentrations of crude glycerin (0% to 20% of DM) were used to replace dry rolled corn in lamb diets. Likewise, Avila-Stagno et al. (2013) used CGLY (up to 21% of DM) for finishing lambs without adverse effect on nutrient intakes and digestibility. Similarly, a lack of effect of glycerol on total-tract digestibility of DM, OM, N, and NDF (Khalili et al., 1997) as well as in vitro (Rémond et al., 1993; Avila et al., 2011) and in vivo (Schröder and Südekum, 1999; Krueger et al., 2010) nutrient digestibility has been reported. Moreover, Wang et al. (2009) reported that increased DM digestibility with glycerol inclusion in cattle forage diets at concentrations of 0% to 3.3% of DM and Avila et al. (2011) reported that linear increases in IVDMD when glycerol was included at concentrations of 0% to 21% of DM as replacement of barley grain in 50% of barley grain-50% of barley silage based feedlot cattle diets. In contrast, a decreased DM intake was reported when a diet containing 10% of glycerin as a corn replacement was fed to feedlot steers (Pyatt et al., 2007). Also, increasing glycerin to 4%, 8%, 12%, and 16% of DM reduced DM intake in finishing heifers (Parsons et al., 2009). DM intakes particularly decreased when glycerin was fed to finishing lambs in high amounts up to 45% (Musselman et al., 2008; Gunn et al., 2010b). Indeed, substituting corn with high levels of glycerin was reported to adversely affect ruminal fermentation through reducing fiber digestion, acetate production, and bacterial populations (Abo El-nor et al., 2010).

Effects of 0%, 5%, 10%, and 20% of dietary crude glycerin on feed intake and apparent digestibility of goats
Roger et al. (1992) demonstrated that introducing glycerol to the ruminal environment reduced cellulolytic activity of ruminal bacteria, and Paggi et al. (2004) also reported that digestibility of other substrates in the diet might be inhibited with the inclusion of glycerol in an in vitro environment. However, more recent digestibility data support results from the current study. Krehbiel (2008) reported that microorganisms adapted rapidly to glycerol feeding because elevated disappearance rates of glycerol were noted with increased days of glycerol feeding. Additionally, Hess et al. (2008) reported that crude glycerin could be added at 15% of DM to ruminant diets without negatively affecting to DM or fiber digestibility. These data, coupled with data from the current study, suggest that the ruminal environment, and concurrent decrease in DMI, may not be affected until crude glycerin concentrations exceed 20% of dietary DM. Further research, however, is needed to test this hypothesis and pinpoint the exact causes of decreased feedlot performance associated with elevated amounts (>20%) of crude glycerin in the diet.
Fermentation characteristics and methane production
Ruminal parameters were measured for pH, NH3-N, and BUN. In addition, BUN was determined to investigate their relationship with ruminal NH3-N and protein utilization. The patterns of ruminal fermentation are given in Table 3. Ruminal pH and NH3-N were unchanged by dietary treatments in this study, indicating no specific effect of the inclusion of CGLY, except for 20% of CGLY, NH3-N was lower (p<0.05) than for the diets 10% of CGLY, while the difference between the diets 0%, 5%, and 20% of CGLY were not significant. Ruminal pH in the present study was within the optimum range for cellulolytic bacteria activity (Russell and Wilson, 1996) and also digestion of protein (6.0 to 7.0). Concentration of ruminal NH3-N was higher than 5 mg %, which is the optimal level of NH3-N for microbial protein synthesis in mixed culture in a close system (Satter and Slyter, 1974). Moreover, the ruminal ammonia concentrations in all animals were closer to optimal ruminal NH3-N (15 to 30 mg %, Perdok and Leng, 1990) for improving microbial protein synthesis and digestibility and feed intake. In the study of Erdman et al. (1986), maximum DM digestion of feeds of low and high degradability occurred at ruminal ammonia concentrations of 170 and 250 mg/L, respectively. Likewise, BUN concentration were similar among treatments, except for 20% of CGLY, BUN was lower (p<0.05) than for the diets 5% of CGLY, while the difference between the diets 0%, 10%, and 20% of CGLY were not significant, ranging from 19.35 to 24.50 mg/dL. It was close to the optimal level in normal goats which had been reported in the range of 11.2 to 27.7 mg/dL (Lloyd, 1982). The lack of effects of CGLY inclusion on pH and NH3-N are in accordance with previous reports in lambs (Abo El-nor et al., 2010) and beef cattle (Mach et al., 2009). Conversely, Wang et al. (2009) reported that supplementing steers with glycerol (200 or 300 g/d) had a tendency to decrease pH and NH3-N content (p = 0.05 and p = 0.03, respectively). The decrease in NH3-N in the ruminal of CGLY might be due to the reduction of proteolytic activity of ruminal microorganisms (Paggi et al., 1999) who found that adding CGLY reduced proteolytic activity by 20% when concentrations of CGLY in the medium.

Effects of 0%, 5%, 10%, and 20% of dietary crude glycerin on ruminal fermentation and volatile fatty acid profiles in goats
The effect of the treatment diets on VFA profiles are presented in Table 3. No differences were found on mean total ruminal VFA concentration, and molar proportion of butyrate and other VFA (isobutyrate, isovalerate, valerate, and caproate) whereas molar proportion of acetate and propionate were affected (p<0.05) by CGLY level. The molar proportion of acetate linearly decreased (p, L = 0.05) whereas propionate was linearly increased (p, L = 0.01) with increasing CGLY supplementation. In consequence, the ratio of acetate to propionate was linearly reduced and was the lowest with the 20% of CGLY relative to the 0% of CGLY diet which was similar among other diets. In agreement with these results, previous studies (DeFrain et al., 2004; Trabue et al., 2007) had reported that animals supplemented with glycerol had greater ruminal molar proportions of propionate with a decreased ratio of acetate to propionate than unsupplemented animals. It is likely that CGLY underwent ruminal fermentation to propionate and is similar to a fermentable carbohydrate source. Previous studies had showed that glycerol was mostly fermented into propionate (Garton et al., 1961; Bergner et al., 1995). Additionally, drenching cows with 1 kg of glycerol (Linke et al., 2004) or supplementing steers with glycerol (200 or 300 g/d; Wang et al., 2009) have been shown to increase ruminal propionate relative to control (no glycerol). The increase in propionate formation from the fermented glycerol used in this study may have offset any reduction in propionate. Moreover, the reduction in the molar proportion of acetate and acetate to propionate ratio was probably due to the reduction in NDF digestibility. Several studies reporting a reduction in NDF digestibility also reported reductions in acetate concentration and acetate to propionate ratio (Ribeiro et al., 2005; Castillejos et al., 2006; Abo El-nor et al., 2010). Likewise, CH4 production was linearly decreased (p, L = 0.01) with increasing CGLY supplementation. The change of CH4 concentration in the rumen is consistent with the reduced acetate: propionate when feeding CGLY. Similarly, Lee et al. (2011) reported a reduction of the A:P ratio, with an associated reduction in in vitro CH4 production after the supplementation of alfalfa hay and corn grain with glycerin, thus suggesting that although the fermentation of glycerin did not necessarily result in the formation of a H2 sink, its ability to promote a shift in carbohydrate fermentation from the production of acetate to propionate might affect the overall electron balance in the rumen and reduce the availability of hydrogen for methane formation.
Blood metabolites and insulin
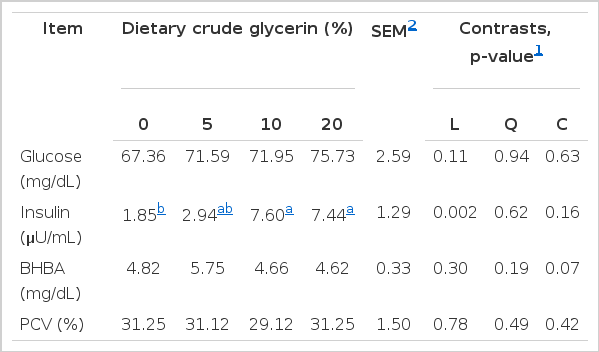
Serum insulin, glucose, BHBA, and PCV concentrations are presented in Table 4. Mean serum glucose, BHBA, and PCV concentrations were not affected (p>0.05) by dietary treatments. It should be noted, however, that overall serum glucose concentration tended (L, p = 0.11) to be numerically greater than for goats fed CGLY inclusion in diets, when compared with goats not fed by CGLY, but all were within the normal range 50 to 75 mg/dL (2.78 to 4.16 mmol/L) (Kaneko, 1980). In agreement to the present results, Parker et al. (2007) reported greater blood glucose concentrations in animals supplemented with 642 g of pure glycerol 48 h before slaughtering than in unsupplemented animals, and Goff and Horst (2001) reported an increase in plasma glucose when administering glycerol via an esophageal pump. Similarly, Chung et al. (2007) reported that feeding glycerol to dairy cows increased circulatory glucose concentrations. In ruminants, glycerol can be rapidly converted to propionic acid and readily absorbed through the ruminal wall (Johns, 1953; Kijora et al., 1998). Therefore, the glycerol component can be converted to glucose by the liver and kidneys (Krebs and Lund, 1966) to provide energy for cellular metabolism. Glucose, as a source of energy, is necessary for production and reproduction performance (Radostits et al., 2000). Blood glucose level may serve as indicators for a goat’s energy status. In the present experiment, these data indicate that goats consuming the diets with CGLY were in a normal energy status. This may be the possible reason for the lack of differences among treatments and there were no deleterious effects on feed intake or the metabolism of the goats. However, the variation in glucose concentration could be affected by many factors. Probably, the increase in blood glucose concentrations following glycerin supplementation depends on the physiological state of the animal and its energy balance (Mach et al., 2009) or disease conditions (Ford et al., 1990). Moreover, sampling is very important, as prior to morning feed, absorption of nutrients from the digestive tract was at minimum level (Hove and Halse, 1983). Linke et al. (2004) compared delivery methods of glycerol (feeding vs. drenching 800 g) and found drenching to be more efficacious at increasing plasma glucose and insulin concentrations.
Effects of 0%, 5%, 10%, and 20% of dietary crude glycerin on blood metabolites and insulin in goats
Overall circulating concentrations of serum insulin linearly increased (p, L = 0.002) with increasing the amount of CGLY supplementation. Circulating insulin concentrations usually correspond to changes in circulating glucose concentrations (Evans et al., 1975; Jenny and Polan, 1975). However, insulin secretion is a result of many factors and, in some cases, has been reported to have a low correlation with blood glucose concentrations (McAtee and Trenkle, 1971). Although insulin secretion responds to circulating glucose concentrations, a lag between increased concentrations of glucose and insulin is often reported (Lake et al., 2006), whereas Gunn et al. (2010b) reported that insulin concentrations also increased linearly relative to time of sampling around feeding (p<0.001). Peak insulin concentrations in the present study correspond with greater concentrations of circulating glucose.
The effects of CGLY on BHBA and PCV concentrations were similar (p>0.05) among treatments with ranging of 4.62 to 5.75 mg/dL and 29.12% to 31.25%, respectively. PCV was close to the optimal level in normal goats which had been reported in the range of 22 to 38% (Lloyd, 1982). This lack of response is likely due to goats consuming the diets with CGLY were in a normal or positive energy status. These data suggest a shift to reduce fatty acid oxidation to ketones or to increase utilization of ketones by extrahepatic tissues when glycerol is fed. Similarly, Mulliniks et al. (2008) reported a decrease in serum ketone concentrations of postpartum range cows fed a glucogenic precursor in the form of propionate salt, and other glucogenic agents such as propylene glycol or glycerol. Conversely, Linke et al. (2004) found that both feeding and drenching 800 g of glycerol increased the molar percentage of ruminal butyrate and plasma BHBA. Because dietary short-chain fatty acids, mainly butyrate, are primary contributors to alimentary ketogenesis (Bergman, 1971), perhaps the ruminal fermentation of glycerol to butyrate increased plasma BHBA and decreased concentrations of glucose in plasma.
Nitrogen utilization
Whole body N data are presented in Table 5. Total N intake and total N excretion in terms of fecal and urinary N were similar (p>0.05) between control diet and CGLY inclusion in diets. This pattern of fecal and urine excretion is indicative of the extremely high N intake for goats fed diets containing of CGLY. This could be explained by the fact that excess ruminal NH3-N is absorbed and excreted in the urine in the form of urea (Nolan, 1993). Additionally, Cronje (1992) found that inadequate energy reduced the percentage of N retention in goats fed adequate levels of protein and that N recycling increased as the supply of energy increased.
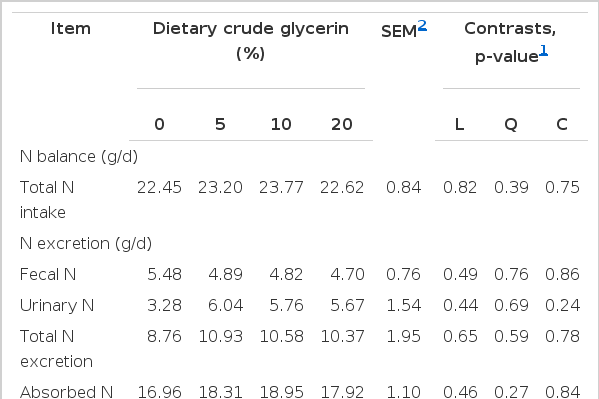
Effects of 0%, 5%, 10%, and 20% of dietary crude glycerin on nitrogen utilization of goats
Likewise, the amount of N absorption and retention were similar among treatments. It is now well established that nitrogen retention depends on the intake of nitrogen, amount of fermentable carbohydrate of the diet (Sarwar et al., 2003). In this regard, however, the positive N balance observed in this study indicated the positive influence of different CGLY replacement of corn grain in the diets with TMR based feeding of goats. Although the differences in the quantity and routes of N excretion with consequent influences on N retention could reflect treatment feed differences in N metabolism, in which N retention was considered as the most common index of the protein nutrition status of ruminants (Owens and Zinn, 1988). Data from the present study indicated that up to 20% of CGLY could be fed in a TMR without negatively affecting feed intake, digestibility, nitrogen balance, and animal performance.
CONCLUSIONS
CGLY (87.61% glycerol) was a good alternative energy source to substitute for corn gain in the diets. Based on the experimental data, substituting corn grain with CGLY up to 20% of DM in the diets of goats had no effect on feed intake, digestibility, ruminal fermentation patterns, blood metabolites, and nitrogen utilization, and it could be effectively used as an alternative energy source to substitute for cereals in the diets. Thus, in the case of a competitive price, CGLY may be effectively used as a partial energy source in the diets of goats. However, further research and long-term studies should be conducted to validate the effects of supplementing of CGLY in finishing goats and to determine the optimal feeding rates in dairy goats.
ACKNOWLEDGEMENTS
The authors would like to express their most sincere gratitude and appreciation to the Department of Animal Science, Faculty of Natural Resources, Prince of Songkla University for financial support of this research (Project no. NAT550288S).
Supported in part by a grant from Prince of Songkla University.