Effects of Adding Super Dose Phytase to the Phosphorus-deficient Diets of Young Pigs on Growth Performance, Bone Quality, Minerals and Amino Acids Digestibilities
Article information
Abstract
Two experiments were conducted to evaluate the efficacy of feeding an Escherichia coli (E. coli) derived phytase to pigs fed P deficient, corn-soybean meal diets. In Exp. 1, one hundred and twenty crossbred piglets (9.53±0.84 kg) were allocated to one of five treatments which consisted of four low P diets (0.61% Ca, 0.46% total P and 0.24% non-phytate P) supplemented with 0, 500, 1,000, or 20,000 FTU/kg E. coli phytase as well as a positive control formulated to be adequate in all nutrients (0.77% Ca, 0.62% total P and 0.42% non-phytate P). The treatments were applied to six pens with four pigs per pen for 28 days. In Exp. 2, ten crossbred pigs (19.66±1.16 kg) fitted with ileal T-cannula were used in a nutrient balance study. The pigs were assigned to treatments similar to those used in Exp. 1 in a doubly replicated 5×4 incomplete Latin square design (5 diets with 4 periods). Each period consisted of a 5-d adjustment period followed by a 3-d total collection of feces and urine and then a 2-d collection of ileal digesta. Supplementation with phytase linearly increased (p<0.05) weight gain, feed intake, feed efficiency, bone breaking strength and fat-free dry and ash bone weight. There were linear increases (p<0.01) in the apparent ileal digestibility (AID) of DM, GE, CP, Ca, total P, inositol hexaphosphate (IP6) and some AA with increasing dose of E. coli phytase. Pigs fed 20,000 FTU/kg had a greater (p<0.05) AID of IP6 (80% vs 59% or 64%, respectively) than pigs fed diets with 500 or 1,000 FTU/kg phytase. There were linear increases (p<0.05) in the total tract digestibility of Ca, total P, Na, K, Mg, and Zn as well as in the retention of Mg and Zn with increased phytase dose. The retention and utilization of Cu, and the total tract digestibility of CP and Cu quadratic increased (p<0.05) with increased phytase dose. In conclusion, supplementation of 500 FTU of phytase/kg and above effectively hydrolyzed phytate in low-P corn-soybean diets for pigs. In addition, a super dose of phytase (20,000 FTU/kg) hydrolyzed most of the IP6 and consequently further improved mineral use, protein utilization and performance.
INTRODUCTION
Phytate is a ubiquitous component of all feed ingredients of plant origin and the majority of the phosphorus in these feedstuffs is present in the form of phytate-P (Selle and Ravindran, 2008). However, the P component of phytate (282 g/kg) is only partially available to pigs because the endogenous phytase activity in the small intestinal mucosa is insufficient to effectively dephosphorylate phytate. Consequently, it is necessary to include inorganic P supplements in diets for pigs to meet their P requirements, which exacerbates the amount of P excreted in manure and causes environmental pollution (Adeola, 1999). However, it has been proven that supplementation of P deficient, corn-soybean meal diets with phytase increases P absorption and decreases P excretion in both weaning and finishing pigs without a reduction in performance (Hong et al., 2001; Jendza et al., 2005).
Supplementation with phytase has been reported to increase the digestibility of Ca, Mg, Mn, Zn, Cu, and Fe in pigs at a dosage level of 500 to 1,500 phytase FTU/kg of feed (Pallauf et al., 1992; Adeola et al., 1995). Kies et al. (2006) reported that a super dose of phytase (>10,000 FTU/kg) could further improve mineral digestibility. However, the effects of phytase doses greater than 10,000 FTU/kg on mineral retention were not reported. In addition, although several authors have reported that microbial phytase has the capacity to enhance AA digestibility and protein utilization in pigs (Kies et al., 2001; Adeola and Sands, 2003), little research has been conducted to explore whether or not a super dose of phytase (>10,000 FTU/kg) can further improve the apparent ileal AA digestibility.
If dietary phytase supplementation goes beyond a certain level, soluble phytate is likely to be the limiting factor in the biochemical reaction. Therefore, it is generally accepted that only a small additional effect on P digestibility in pigs would be obtained at dosage levels exceeding 1,500 FTU/kg. However, increasing number of studies have demonstrated that phytase continues to improve performance, bone characteristics, P, and Ca digestibility at doses up to 10,000 (Augspurger and Baker, 2004), 12,000, (Shirley and Edwards, 2003) or even 15,000 FTU/kg (Kies et al., 2006). Therefore, the current study was performed to further examine the effect of Escherichia coli (E. coli) phytase supplementation, including a super dose of 20,000 FTU/kg, on mineral balance and the apparent ileal digestibility of AA in both weaned and growing pigs.
MATERIALS AND METHODS
Preparation of phytase
The E. coli phytase (Phyzyme XP) used in this experiment was provided by Danisco Animal Nutrition (Danisco A/S, Aarhus, Denmark). The optimal pH range for this phytase is from 2.5 to 5.5. The phytase activity of this phytase was analyzed in quadruplicate according to the method of Engelen et al. (2001). And the actual phytase activity was 5,104 FTU/g of pure product before mixed in the diet. One FTU of enzyme activity is defined as the amount of enzyme that liberates 1 μmol of inorganic P per min at 37°C and pH 5.5 (Engelen et al., 2001).
Weaned pig performance study (Exp. 1)
All procedures of this study were approved by the China Agricultural University Animal Care and Use Committee (Beijing, China). A total of 120 crossbred piglets (9.53± 0.84 kg) [Duroc×(Landrace×Large White)] weaned at 28 days were used in this study. Before the experiment, all piglets were fed a corn-soybean meal based diet containing 0.9% Ca and 0.8% total P for one week. The pigs were then allocated to one of five dietary treatments on the basis of gender and weight in a randomized complete block design. The five treatments consisted of a low- P diet (0.61% Ca, 0.46% total P and 0.24% non-phytate P) supplemented with 0 (negative control, NC), 500, 1,000 or 20,000 FTU/kg E. coli phytase, respectively, as well as a positive control (PC) formulated to be adequate in all nutrients (0.77% Ca, 0.62% total P and 0.42% non-phytate P). All diets were fed in mash form based on corn soybean meal (Table 1). All mixed diets were analyzed for phytase activity before being fed.

Pigs were housed in 2×3 m raised pens equipped with a wire mesh floor. The temperature of the pig barn was controlled at approximately 25°C. All pigs had free access to feed and water throughout the 4-wk feeding trial. Each treatment was applied to 6 pens with 4 pigs per pen (2 males and 2 females).
Pigs and feed were weighed between 0750 and 0950 h on d 0 and 28 in order to calculate weight gain, feed intake and feed efficiency. At 0830 h on d 29, one male pig (weighing closest to the average body weight for each pen) per pen was killed by electrical stunning and exsanguination to collect metacarpal bone samples. The right front foot of each pig was removed and refrigerated at 2°C. The third metacarpal bones were excised and cleaned of all adhering tissue within three days for bone weight measurements as well as the determination of bone breaking strength and ash weight. The breaking strength of fresh bones and ash weight were determined according to Zeng et al. (2011).
Nutrient balance and apparent ileal AA digestibility (Exp. 2)
Ten crossbred [Duroc×(Landrace×Large White)] pigs (10.32±0.62 kg) were obtained from a local commercial pig farm (Beijing Beilangzhong pig farm) and fed a corn-soybean meal based diet containing 0.9% Ca and 0.8% total P for three weeks before surgery. The pigs were housed in adjustable stainless steel metabolism crates (1.4×0.45×0.6 m3). Pigs (19.66±1.16 kg) were surgically fitted with a simple T-cannula at the distal ileum as described by Stein et al. (1998). After surgery, pigs were returned to their metabolic crates and allowed a 14-d recovery period. During this period, the pigs were fed increasing amounts of a commercial grower diet twice daily and had unlimited access to water (Stein et al., 1998).
After the recovery period, the pigs were assigned to one of five treatments according to a doubly replicated 5×4 incomplete Latin square design (5 diets with 4 periods, n = 8). Each period consisted of a five day adjustment period followed by a three day total collection of feces and urine and then a two day collection of ileal digesta. Pigs were fed their diets at 2.1 times their maintenance energy requirement as recommended by the Feeding Standard of Swine (2004) based on their body weight at the beginning of each period. The daily feed allowance was offered in two equal portions at 0800 and 1700 h. The treatments were similar to those used in Exp. 1 but modified slightly to meet the nutrient requirements for growing pigs. All diets were fed in mash form with 0.25% chromic oxide inclusion as an indigestible marker. Table 1 shows the ingredient and chemical composition of the PC diet and NC diets.
Total urine and fecal samples were collected twice per day. Feces were collected by placing a plastic bag over the anus of each pig. The collected feces were placed in plastic bags and stored at −20°C. Urine was collected in buckets from drop pans under each pen. A 25% HCl solution was added to each bucket to maintain the urinary pH below 3. Each day, the total urine volume was measured and a 10% aliquot was filtered through gauze. Fifty mL of the mixed urine sample was transferred into a screw-capped tube and immediately stored at −20°C until analysis. At the end of the collection period, urine samples from the three day collection were pooled within pig and strained through glass wool before analysis. Feces were thawed, pooled by pig within the given period, homogenized, sub-sampled, dried in a drying at 65°C for 72 h and ground through a 1-mm screen. The procedures for the collection were conducted according to the methods described by Song et al. (2003).
Ileal digesta was collected continuously for 12 h from 0800 to 2000 h on d 9 and 10 according to procedures described by Stein et al. (1998). In brief, a 200 mL plastic bag was attached to the open cannula using a cable tie. Bags were removed whenever they were filled with digesta or at least every 30 min and stored at −20°C to prevent bacterial degradation of the AA in the digesta. At the end of each two day collection period, ileal samples were thawed and lyophilized in a vacuum-freeze dryer (Tofflon Freezing Drying Systems, Shanghai, China), ground through a 1-mm screen, and thoroughly mixed. A representative sub-sample was then taken for chemical analysis. Table 2 shows the analyzed nutrient composition of the experimental diets (as-fed basis) for Exp. 2.

Analyzed nutrient composition of experimental diets (as-fed basis, Exp. 2)
Analytical procedures
Analysis of DM (AOAC method 930.15), CP (AOAC method 988.05), Ca (AOAC method 935.13) and P (AOAC method 965.17) were conducted according to the methods of AOAC (2000). GE was determined by an automatic adiabatic oxygen bomb calorimeter (Parr 1281 Automatic Energy Analyzer, Moline, IL). P content was analyzed using a UV-visible spectrophotometer (Hitachi, U-1000). Amino acids in diets and digesta were assayed using ion-exchange chromatography according to Wang et al. (2011). Mg, Na, K, Cu, Fe, Mn, and Zn were determined by Inductively-Coupled Plasma Emission Spectroscopy according to Adeola et al. (1995). The IP6 was analyzed on a Dionex DX-500 Ion Chromatograph System (Sunnyvale, CA) with a Dionex CarboPac PA-100 column (4×250 mm) and a Dionex Knitted coil (75 μL) for post column reaction. High performance ion chromatography (HPLC) was used for the analysis of IP6 according to Tran et al. (2011). The determination of chromium content and AID of nutrients followed the method of Wang et al. (2011).
Statistical analysis
For Exp. 1, performance differences were analyzed as a completely randomized block design using the GLM procedure of SAS (SAS Institute, Cary, NC). Each pen was considered as the experimental unit.
For Exp. 2, the data obtained were analyzed using the GLM procedure of SAS (SAS Institute, Cary, NC). Individual pigs served as the experimental unit. The model included pig (square), period, and treatment. Contrast statement in GLM procedure of SAS was applied to conduct polynomial orthogonal contrasts for linear and quadratic responses for data both from Exp. 1 and Exp. 2. Coefficients for unequally spaced contrasts were generated by PROC IML of SAS. The alpha level used in the determination of significance for all analysis was 0.05 and trends (alpha<0.10) are also reported.
RESULTS
Performance
Table 3 shows the effects of phytase on the performance of weaned piglets in Exp. 1. There were linear increases (p<0.05) in weight gain, feed intake and feed efficiency with increasing dose of phytase. Pigs fed the positive control diet and all diets with phytase supplementation had greater (p<0.05) weight gain than pigs fed the NC diet. Pigs fed the diet containing 20,000 FTU/kg phytase had a greater weight gain than pigs fed the diet containing 500 FTU/kg phytase (p<0.05). A numerical increase for weight gain (538 vs 491 g/d) was observed compared with pigs fed the diet containing 1,000 FTU/kg phytase. No difference was observed among pigs fed the PC diet and pigs fed diets containing 500 or 1,000 FTU/kg phytase. Feed efficiency was greater (p<0.05) for pigs fed the diet containing 20,000 FTU/kg phytase than for pigs fed the NC diet or the diet containing 500 FTU/kg phytase.
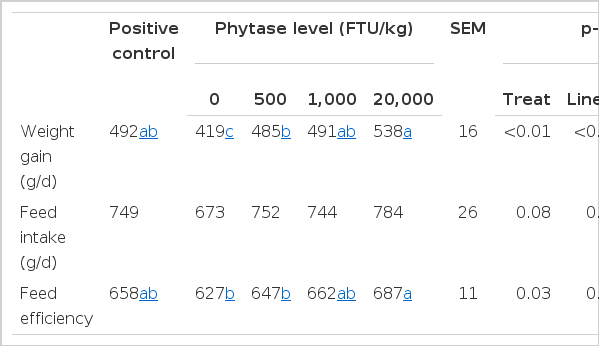
Effects of phytase on the performance of weaned piglets (Exp. 1)
Metacarpal bone characteristics
As shown in Table 4, there were linear increases (p< 0.05) in metacarpal breaking strength, fat-free dry bone weight and ash weight with increased dietary concentration of E. coli phytase. Pigs fed the PC diet and the diet containing 20,000 FTU/kg phytase had greater (p<0.05) bone breaking strength and ash weight than pigs fed the NC diet.
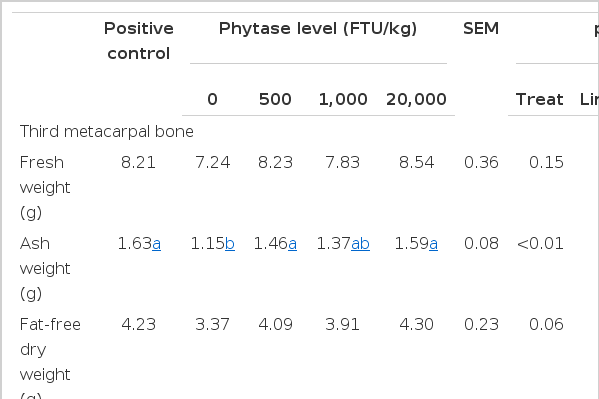
Effects of phytase on the third metacarpal bone characteristics of weaned pigs (Exp. 1)
Apparent ileal digestibility
There were linear increases (p<0.05) in the apparent ileal digestibility (AID) of DM, GE, CP, Ca, and total P with increasing dose of E. coli phytase (Table 5). The super dose of phytase (20,000 FTU/kg) further improved (p< 0.05) AID of Ca and total P compared with 500 or 1,000 FTU/kg phytase. The super dose of phytase (20,000 FTU/kg) improved (p<0.05) AID of GE, DM and CP in growing pigs compared with pigs fed the NC diet. Most of the AA were not significantly affected by phytase supplementation. However, increasing the dose of phytase linearly increased (p<0.05) the AID of lysine, threonine, and aspartic acid and quadratic increased (p<0.05) the AID of Tyrosine.
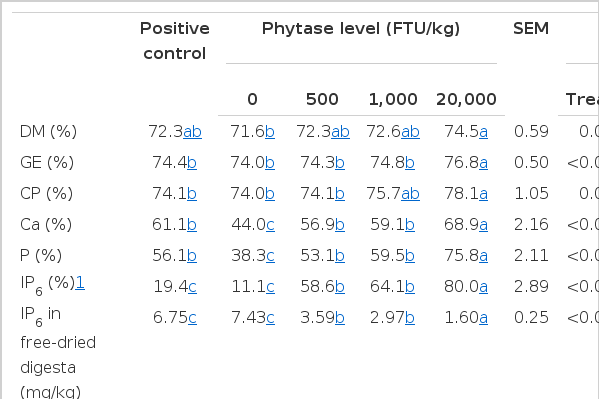
Effects of phytase on IP6 concentration in digesta and apparent ileal digestibilities of nutrients in growing pigs (Exp. 2)
There were linear increases (p<0.01) in AID of inositol hexaphosphate (IP6) and linear decreases (p<0.01) in IP6 concentration in freeze-dried digesta with increasing dose of phytase. Phytase supplementation increased (p<0.05) AID of IP6 compared with pigs fed the PC or NC diet. Furthermore, pigs fed 20,000 FTU/kg phytase had greater (p<0.05) AID of IP6 and lower (p<0.05) IP6 concentration in freeze dried digesta than pigs fed 500 or 1,000 FTU/kg phytase. No difference was observed in AID of IP6 and IP6 concentration of ileal digesta between pigs fed the PC and the NC diet.
Apparent total tract digestibility and retention of GE and nutrients
There was quadratic increase in total tract digestibility of nitrogen while that of GE was unaffected (Table 6). Ca and P digestibility, retention and utilization linearly increased (p<0.01) with increasing dose of phytase. Phytase supplementation increased (p<0.05) digestibility, retention and utilization of Ca and P compared with pigs fed the NC diet. Pigs fed 20,000 FTU/kg phytase had greater (p<0.05) P digestibility and retention than pigs fed the NC and diets containing 500 or 1,000 FTU/kg phytase. Pigs fed the PC diet had greater (p<0.05) Ca retention (4.19 g/d vs 3.28 g/d) than pigs fed 20,000 FTU/kg phytase. Pigs fed 20,000 FTU/kg phytase had greater (p<0.05) P utilization (73.6% vs 57.5%) than pigs fed the PC diet while no difference was observed when expressed in grams of P retention per day.
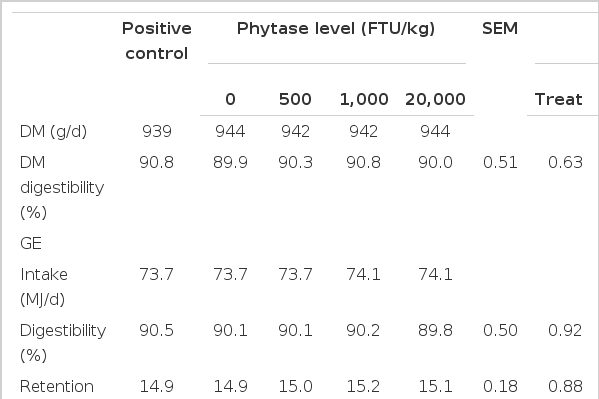
Effects of phytase on GE, CP, Ca and P balance in growing pigs (Exp. 2)
Mineral balance
There were linear increases (p<0.05) in the digestibility, retention and utilization of Mg with increasing dose of phytase, as well as in the digestibility of Na, K and digestibility and retention Zn (Tables 7 and 8). Digestibility, retention and utilization of Cu quadratic increased (p<0.01) with increasing dose of phytase. Pigs fed 20,000 FTU/kg phytase had a greater (p<0.05) digestibility of Na and K than pigs fed the NC diet while no difference was observed in the retention of Na and K. Phytase supplementation increased (p<0.05) digestibility, retention and utilization of Cu compared with pigs fed the PC and the NC diets. Pigs fed 20,000 FTU/kg phytase had a greater (p<0.05) digestibility and retention of Mg than pigs fed the PC diet. However, digestibility and retention of Fe and Mn were not affected by the dietary inclusion of phytase.
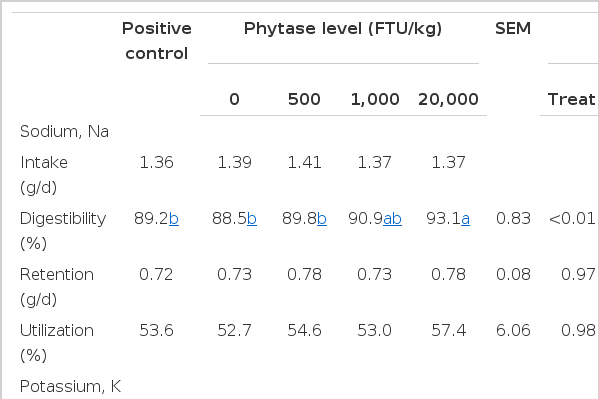
Effects of phytase on Na, K and Mg balance in growing pigs (Exp. 2)

Effects of phytase on Cu, Fe, Mn and Zn balance in growing pigs (Exp. 2)
DISCUSSION
If phytase completely degrades phytate, it would theoretically liberate 2.82 g/kg P and 3.04 g/kg Ca, which implies that supplementation with reduced dietary Ca in phytase supplemented diets is feasible. In respect that high dietary Ca levels may disrupt phytate degradation, Selle et al. (2009) suggested dietary Ca levels should be kept to a minimum in phytase supplemented pig and poultry diets without compromising skeletal integrity or growth performance. Therefore, in the present experiment, the Ca level in phytase supplemented diets was reduced to maximize the phytase activity, and no lameness pigs were observed in the current experiment.
The E. coli phytase used was very effective in hydrolyzing phytate in the P deficient, corn-soybean meal diets. As the inclusion level of phytase increased, pig performance was linearly increased. Pigs fed diets containing 500 FTU/kg phytase and above obtained similar weight gain compared with pigs fed the PC diet. In a review, Kornegay (2001) concluded that the maximal effect of phytase supplementation on performance was estimated to be between 500 and 1,500 FTU/kg. However, in the current experiment, weight gain and feed efficiency in pigs fed the diet with 20,000 FTU/kg phytase were increased by 10.9 and 6.1% compared with pigs fed 500 FTU/kg phytase. Furthermore, pigs fed the diet with 20,000 FTU/kg phytase had lower P retention (2.97 g/d vs 3.23 g/d) but higher daily weight gain (528 g/d vs 498 g/d) compared with pigs fed the PC diet. This indicates an effect of phytase on performance beyond the digested-P related effects, such as improved utilization of energy, AA or minerals (Kies et al., 2001).
Metacarpal bone breaking strength, fresh and fat-free dry bone weight and bone ash weight increased (p<0.01) as the level of phytase in the diet increased. Our results with weaned pigs agreed with those reported by Veum et al. (2006), where young pigs fed a low-P diet supplemented with E. coli phytase at 12,500 FTU/kg had greater metacarpal breaking strength, fat-free dry bone weight and ash weight than pigs fed a positive control diet (p<0.01). Similar results were also reported by Shirley and Edwards (2003) in broilers.
The results of Exp. 2 agreed with previous results that supplementation of microbial phytase to low-P diets improved P digestibility (Adeola et al., 1995). The amount of digestible P generated by 500 and 1,000 FTU/kg is estimated at 0.073, and 0.079%, respectively. For P digestibility, our results were in agreement with the results of reports that used super doses of microbial phytase (Augspurger and Baker, 2004; Kies et al., 2006). However, the mechanism of the continuing improvement in P digestibility as a result of inclusion of super phytase doses remains unclear. Kies et al. (2006) provided two possible explanations: one is that phytate may be degraded faster or to a greater extent at a super dose (>10,000 FTU/kg); the other is that a large part of the active phytase escapes the stomach to continue working in the small intestine. In order to investigate which site of digestive tracts is responsible for the additional effect on mineral digestibility at the high phytase dose, data on phytate degradation in the duodenum will be needed.
On the basis of apparent metabolizable energy assessments, phytase has been shown to consistently enhance energy utilization in poultry (Selle et al., 2007). However, there was no tangible evidence of a corresponding energy effect of phytase in pigs, as reviewed by Selle et al. (2000). Selle and Ravindran (2008) speculated that phytase supplementation may produce energy effects in pigs at high dose rates. Our results verified the speculation on the basis of AID of GE, in which diets containing 1,000 and 20,000 FTU/kg phytase contributed 548 kJ/kg and 1,922 kJ/kg as digested energy in the ileum, respectively. However, the lack of change in total tract energy digestibility may indicate that phytase supplementation depresses microbial fermentation in the lower intestine due to a possible deficiency of P and Ca (Metzler et al., 2008). Metzler et al. (2010) reported that dietary phytase supplementation tended to reduce the concentration of total volatile fatty acids and the total number of bacteria in the feces. Less VFA production may constrain energy benefit in phytase supplemented diets.
It is believed that the role of phytase in enhancing energy utilization in pigs is mainly derived from enhanced protein digestibility (Selle and Ravindran, 2008). In the current experiment, AID of AA was increased 3.1 percentage units as the phytase dose of the diet was increased from 0 to 20,000 FTU/kg. The quadratically improvement (p<0.05) in total tract digestibility of nitrogen may be partly derived from the improvement in AA digestibility which occurred in the ileum. Furthermore, the additional improvements of AA partly explained beyond digested-P related effects of phytase addition on pigs performance.
Cowieson et al. (2004) reported that phytate increased the excretion of endogenous Na in broilers, and Woyengo et al. (2009; 2010) subsequently reported that phytic acid increases Na secretion in the jejunum and reduces the AID of Na in piglets. These reports indicate that phytate may interfere with intestinal uptakes of AA (and glucose) via Na-dependent transport systems (Selle et al., 2007; Woyengo et al., 2011). In the present study, phytase supplementation at levels of 500, 1,000 and 20,000 FTU/kg hydrolyzed 59%, 64% and 80% of the IP6 in the ileum respectively, which resulted in 2.07, 2.50 and 4.65 times lower IP6 at the ileum than for pigs fed the NC diet. Liao et al. (2005) reported that a high phytic acid diet reduced the AID of energy and AA compared with a low phytic acid diet. However, in our studies phytase supplementation attenuated the negative nutritional effect of phytic acid. Gagne et al. (2002) found that phytase increased post-prandial plasma concentrations of α-amino nitrogen in growing pigs and suggested this was indicative of phytase enhancing AA absorption. Kies et al. (2005; 2006) subsequently reported that phytase supplementation improved the digestibility of Na and K coupled with increased post-prandial plasma concentrations of glucose. Our results agree with these findings of improved digestibility of Na and K, and enhancement of GE and AA utilization with phytase supplementation.
Although IP6 was partly hydrolyzed into lower phytate esters, the chelating potential of IP6, and consequently its anti-nutritive properties were disproportionately greater than lower phytate esters (Luttrell, 1993; Persson et al., 1998). Yu et al. (2012) have recently reported that the aggregating capabilities of IP esters (IP1–6) on soy protein and β-casein decrease dramatically from IP6 to IP5 and become negligible with IP1–4. This may explain why supplementation of a super dose of phytase (>10,000 FTU/kg) produces further improvements in the performance of young pigs compared with a P adequate diet, as 80% of IP6 was hydrolyzed in the ileum with 20,000 FTU/kg phytase while 500 FTU/kg phytase resulted in only 58.6% IP6 degradation in the ileum.
The results of the present studies also support the study of Adeola et al. (1995) which indicated that the growth-promoting effect of phytase may be due to an overall increase in the availability of minerals. Phytase supplementation of diets has been reported to improve Zn, Cu, and Mg absorption in weanling pigs (Pallauf et al., 1992; Kies et al., 2006). The improvement in Mg absorption and retention observed in the present experiment further suggests that a super dose of phytase (>10,000 FTU/kg) may continue to hydrolyze soluble phytate in the upper small intestine as the solubility of Ca-phytate decreases rapidly at a pH above approximately 6, but the Mg salt precipitates at a higher pH.
In conclusion, the E. coli phytase used in our experiment was efficacious at concentrations up to 20,000 FTU/kg for pigs, based on the response criteria of performance, bone strength, the total tract digestibility of P, Ca, Na and Mg and the AID of GE and CP. A super dose of phytase (20,000 FTU/kg) further improved phytate degradation in the ileum and enhanced CP and AA utilization as well as increased the availability of minerals. The maximum effective concentration of this E. coli phytase is still unknown because there was no plateau in the response criteria measured up to 20,000 U/kg of diet. Given declining inclusion costs coupled with increasing feed ingredient prices, higher phytase addition rates may be justified.
ACKNOWLEDGEMENTS
This research was supported by Danisco A/S, Aarhus, Denmark, and NSFC (31372316) of China.