Genetic Variation and Phylogenetic Relationships of Indian Buffaloes of Uttar Pradesh
Article information
Abstract
India possesses a total buffalo population of 105 million out of which 26.1% inhabit Uttar Pradesh. The buffalo of Uttar Pradesh are described as nondescript or local buffaloes. Currently, there is no report about the genetic diversity, phylogenetic relationship and matrilineal genetic structure of these buffaloes. To determine the origin and genetic diversity of UP buffaloes, we sequenced and analysed the mitochondrial DNA D-loop sequences in 259 samples from entire Uttar Pradesh. One hundred nine haplotypes were identified in UP buffaloes that were defined by 96 polymorphic sites. We implemented neutrality tests to assess signatures of recent historical demographic events like Tajima’s D test and Fu’s Fs test. The phylogenetic studies revealed that there was no geographic differentiation and UP buffaloes had a single maternal lineage while buffaloes of Eastern UP were distinctive from rest of the UP buffaloes.
INTRODUCTION
The domestic water buffalo is a species of paramount importance to several Asian countries. This species is a major source of milk, meat, draft power, hide and employment to marginal farmers and landless labourers. India has 105 million buffaloes (Livestock census, 2007). The buffalo population of Uttar Pradesh (UP) constitutes 26.1% of the total buffalo population of India (Livestock census, 2007), yet this large population is considered as non-descript, due to lack of efforts made to characterise them. The Indo-Gangetic plains have only one defined breed of buffalo named Bhadawari in the areas adjoining Madhya Pradesh (MP) and transversed by ravines and tributaries of Yamuna.
Molecular techniques have been widely used to analyse phylogenetic relationships among various breeds/ populations. By comparing DNA sequences, one can derive evolutionary relationships, levels of variability and geographical sub-structuring within and between groups of breeds or population (Avise et al., 1987a; Harrison, 1989).
The D-loop is the major control region for mitochondrial DNA (mtDNA) expression. It is known to be more variable in sequence than other regions of mitochondrial DNA (Cann et al., 1984). The examination of variation in D-loop region has been shown to be very useful in elucidating the origin and diversification of modern buffalo populations (Kumar et al., 2007a). Therefore, the mtDNA polymorphisms have been widely used to investigate the structure of populations, intraspecies variability, archaeological inference about the origin and nature of the domestication process (Bradley et al., 1998; Troy et al., 2001; Malau-Aduli et al., 2004; Odahara et al., 2006; Lee et al., 2007; Lei et al., 2007).
Since no report was available on mtDNA D-loop sequence variation and origin of Uttar Pradesh non-descript buffaloes, so this study was undertaken to find out the relationship of buffaloes amongst themselves in the Indo-Gangetic plains. This study shall be helpful for taking informed decision on conservation, utilisation and exploitation of the buffalo genetic resources of the Indo-Gangetic plains.
MATERIALS AND METHODS
Samples collection
Blood samples of 259 buffaloes were collected from the Indo-Gangetic plains of Uttar Pradesh. We covered complete landscape of Ganga, Yamuna, Chambal and Tarai regions. The samples from Bhadawari and Tarai buffaloes were also included for D-loop sequences.
DNA was extracted from whole blood by using a standard protocol of DNA isolation kit (Roche diagnostics). The concentration of DNA was adjudged by comparison with the standard DNA marker concentration on agarose gels. The quality of DNA was checked on 0.6% agarose gels prepared in Tris-acetate EDTA buffer.
PCR Amplification and sequencing of mtDNA
To amplify the buffalo mtDNA D-loop region, primers were designed with Accession no. AY488491.1 as a reference sequence using the Primer3 software. The partial mitochondrial D-loop region was amplified by PCR using the two primers: Forward primer: BMT F: 5′-CCTCCACAAATGCAAAGAGC-3′ and Reverse primer: BMT R: 5′-TTGTGAGGTGATGGTTTAGGTG-3′. PCR amplification was carried out in a 50 μL reaction volume containing 50 ng of genomic DNA, 1X PCR buffer (50 mM KCl, 10 mM Tris-HCl, pH 8.3), 1.5 mM MgCl2, 200 μM dNTPs, 5 pM of each primer and 1 U Taq polymerase (Sigma). Amplification was performed in an Eppendorf ProS thermal cycler using a 5 min denaturation step at 95°C followed by 30 cycles of 45 s at 94°C, 45 s at 56°C, 1 min at 72°C and a final extension at 72°C for 10 min. After PCR using standard conditions, sequencing was performed using Big Dye Terminator and carried out on 3130XL Genetic Analyzer (Applied Biosystems).
Data analysis
To facilitate analysis of data, we utilized the classification as given by Upasna et al. (2011) utilising microsatellite loci by arranging all the animals into five groups. The mtDNA sequences for the 611 nucleotides of D-loop were aligned using the ClustalW (Thompson et al., 1994) and edited using BioEdit software (Hall, 1999). Polymorphic sites were identified using DnaSP version 5.10.01 (Rozas et al., 2003; available at http://www.ub.es/dnasp). On intra population level, the haplotype diversity (H) and nucleotide diversity (π) were determined.
In order to test for past population expansion, we used two statistical tests Tajima’s D (Tajima, 1989) and Fu’s FS (Fu, 1997). The analyses were implemented in the program Arlequin 3.5 (Excoffier and Lischer, 2010), p-values were generated using 1,000 simulations under a model of selective neutrality. In addition, the mismatch frequency graphs were plotted in DnaSP ver 5.10.01 to determine whether the populations exhibited evidence of spatial range expansion or a stationary population history (Tajima, 1989).
The demographic changes were also examined by calculating the Harpending's raggedness index (Harpending et al., 1993) and the sum of squared deviations (SSD) between the observed and expected mismatch for each of the populations were calculated using the methods of Schneider and Excoffier (1999) using Arlequin version 3.5. This measure quantifies the smoothness of the observed mismatch distribution and a non-significant result indicates an expanding population (Harpending, 1994). The spatial expansion hypothesis (both raggedness index and SSD) was tested using a parametric bootstrap approach (500 replicates).
Phylogenetic analysis between populations was determined using the MEGA version 5.1 software (Tamura et al., 2011; available at http://www.megasoftware.net/) and the tree was constructed using Neighbor-Joining (NJ) algorithm (Tamura and Nei, 1993). Median joining (MJ) network analysis was conducted using software NETWORK 4.6.1.0 (Bandelt et al., 1999; available at http://www.fluxus-engineering.com). Population pairwise FST and number of migrants (Nm) were calculated using Arlequin 3.5 software (cmpg.unibe.ch/software/arlequin3/).
RESULTS
mtDNA variation in Uttar Pradesh buffaloes
A total of 259 Indo-Gangetic buffaloes samples were analysed in this study. We divided Indo-Gangetic plains into 5 different regions to get the maternal lineage among UP buffaloes. Among these samples, 51 individuals were from Region 1 (Western UP), 95 from Region 2 (Central UP), 36 from Region 3 (Eastern UP), 35 from Region4 (Bhadawari Region) and 42 individuals from Region5 (Tarai Hill Tract).
109 D-loop haplotypes were identified and were defined by 96 polymorphic sites in the 611 bp fragment. The haplotypes of mtDNA D-loop sequences of UP buffaloes were deposited in the GenBank database (Accession no. JQ319985- JQ320071). The number of haplotypes varied among regions, varying between 10 for Region4 to 47 for Region 2 (Table 1). Among these haplotypes, H9 was predominant followed by H2, H7, H3, H90 and H92.
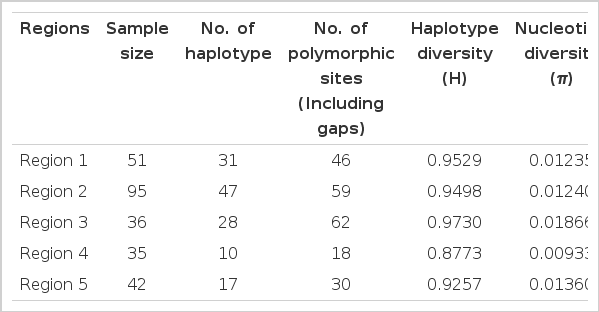
Sample size, number of haplotypes, number of polymorphic sites, haplotype diversity and nucleotide diversity of different regions of UP buffaloes
Genetic diversity indices are shown in Table 1. Haplotype diversity (also known as gene diversity) represents the probability that two randomly sampled alleles are different, while nucleotide diversity is defined as the average number of nucleotide differences per site in pairwise comparisons among DNA sequences (Nei, 1987).
The haplotype diversity (H) was high in every population, ranging from 0.8773 in Region4 to 0.9730 in Region 3. Nucleotide diversity (π) was quite low for all populations, ranging between π = 0.00933 for Region4 and π = 0.01866 for Region 3. The small size of some populations and their unique breeding histories may account for the high variability of genetic diversity. In recent study, Kumar et al. (2007a), analysed the mitochondrial D-loop region of 217 animals representing eight breeds from eight different locations in India and found that the haplotype diversity of Bhadawari breed ranged 0.9570±0.0200 which is higher than those observed in the present study (Region 4: Bhadawari tract buffaloes: 0.8773).
FST value which is a measure of population differentiation was calculated for all the regional populations. Maximum differentiation was found between Region 3 and Region 4, followed by Region 1 and Region 4, this may be due to the geographic barriers created by the flow of river Ganga and Yamuna tributaries between Region 3 and Region 4 and Region 1 and Region 4, while least differentiation was observed between Region 1 and Region 2, followed by Region 2 and Region 3 shown in Table 2. This is attributed to the continuity of UP buffalo populations of Region 1 and Region 2 as the geographical distance between these two regions is small. There is resultant free gene flow because of geographical contiguity and absence of forces that lead to structuring of the populations. FST values are depicted graphically (Figure 1) and assuming that the assumptions underlying Slatkin’s estimate are fulfilled then t/N generations are proportional to the divergence time.
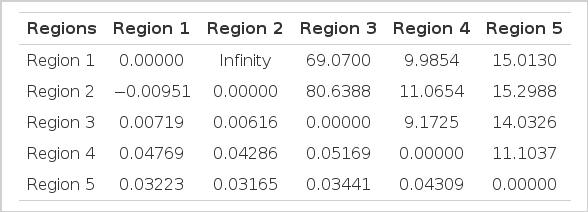
Population pairwise FST values (below diagonal) and number of migrants (Nm) (above diagonal) of buffalo populations
Diagrammatic representation of Matrix of Pariwise FST and Slatkin’s linearized FST. In this study, the R1 (Western UP) and R2 (Central UP) showed least differentiation while maximum differentiation was observed between R3 (Eastern UP) and R4 (Bhadawari tract, border areas of UP and MP).
From the estimate of FST, the level of gene flow as measured by the product Nm can be computed from Wright’s (1951) result for haploid organisms in an island model of population structure. In the present study, the number of migrants was calculated using FST values and is presented in Table 2. As it is evident, the number of migrants between Region 1 and Region 2 were very high and no significant difference in the two regions was detected.
Population demography history
We performed the Tajima’s D and Fu’s Fs tests to infer the demographic history of Indo-Gangetic buffalo to detect past population growth. The results of Tajima’s D test and Fu’s Fs test are presented in Table 3, including associated simulated p-values.

Results of Tajima’s D, Fu’s Fs neutrality tests, SSD (sum of squares deviation) and Raggedness index including associated p-values
Tajima’s D values were negative for all populations except Region 4 and Region 5 (Table 3) but statistically not-significant, indicating an excess of rare nucleotide site variants compared to what would be expected under a neutral model of evolution. The results of Fu’s FS test, which is based on the distribution of haplotypes, showed negative values for all regions except Region 4, indicating an excess of rare haplotypes over what would be expected under neutrality. Following Fu’s Fs test, the hypothesis of netural evolution was significantly rejected for all regions except for the Region 4 and Region 5. The overall negative values resulting from both tests indicate that there is an excess of rare mutations in the populations but the excess is statistically non-significant. Alternatively these values can result from balancing selection on a nearby locus, although studies demonstrating direct or indirect selection (through hitchhiking) on the mitochondrial genome in natural populations are rare (Ruiz-Pesini, 2004).
Historical demographic expansions were also utilized by examination of frequency distributions of pairwise differences between sequences (Rogers and Harpending, 1992; Ray et al., 2003; Mismatch distribution; Excoffier, 2004). In the present study, the mismatch distribution plot for all populations showed a multimodal and ragged shape, revealing demographic equilibrium or a stable population (Ray et al., 2003) (Figure 2). In general, a multimodal (including bimodal) mismatch distribution indicates diminishing population sizes or structured size; and a ragged distribution suggests that the lineage was widespread (Excoffier et al., 1992; Rogers and Harpending, 1992; Rogers et al., 1995). We also calculated the raggedness index under the demographic expansion model for each population and found that all populations had non-significant raggedness index which indicates that data has relatively good fit to a model of population expansion (Harpending, 1994) (Table 3).
Mismatch distribution graphs for UP buffalo populations. The x axis shows the number of pairwise differences, the y axis shows the frequency of the pairwise comparisons. The observed frequencies were represented by red dotted line. The frequency expected under the hypothesis of population expansion model was depicted by continuous green line.
Phylogenetic relationships among buffaloes of different regions of Uttar Pradesh
To understand the population structure and identify possible phylogenetic lineage of the Indo-Gangetic buffaloes, we constructed a Neighbour-joining (NJ) tree using 109 haplotypes based upon 611bp mtDNA sequences (Figure 3). The tree shows one major clade that has 5 branches. The haplotypes (H72, H77 and H78) of Region 3 clustered separately. The network based on the mtDNA control region haplotypes revealed similar pattern as the NJ tree (Figure 4). Moreover, the network presented a star-like profile, consistent with a pattern of population expansion in the past.
Rooted Neighbor-joining tree of UP buffalo populations based on the mtDNA haplotypes.
Median-Joining haplotype network of UP buffalo populations. The circle size is relative to number of haplotypes copies present in the dataset. A branch represents a single nucleotide change. The red dots represent theoretical median vectors introduced by the network software.
DISCUSSION
In this work, we examined the genetic variability using mitochondrial D-loop region in an attempt to determine the genetic diversity and origin of buffalo populations of Uttar Pradesh. This is the first published report on the mtDNA D-loop sequences of UP buffalo. The use of mitochondrial D-loop DNA sequences for studying the genetic variation in water buffalo has been reported in different studies (Lau et al., 1998; Kierstein et al., 2004; Kumar et al. 2007a, b). We have here investigated the genetic variation of the five different regions of buffalo populations present in Uttar Pradesh; Bhadawari Tract, Tarai Hill tract, Western, Central and Eastern UP. Most of the haplotypes were shared among five regions which indicate the presence of same founding population of the five regions of UP. The presence of the high number of halpotypes is due to the high substitution rate detected in the D-loop region of the buffaloes. D-loop region has tendency of higher substitution rates than the rest of mtDNA genome (Cann et al., 1984).
Haplotype diversity lies in the range 0.87 to 0.97, which is higher when compared to many other buffalo populations. Similarly, high haplotype diversity values have been reported on domestic water buffalo (Kierstein et al., 2004) and Chinese native water buffalo (Lei et al., 2007). It implies that the genetic variability was higher in these regions of Uttar Pradesh. The combination of high haplotype diversity and low nucleotide diversity, as observed in present study, can be a signature of a rapid demographic expansion from a small effective population size (Avise, 2000).
In terms of population differentiation, the haplotype network demonstrates that especially the Region 1 (Western UP) and Region 2 (Central UP) show relatively little divergence and share the most common haplotype in the analysis. High gene flow between populations can slow down or prevent the process of geographic differentiation. The Region 3 (Eastern UP) and Region 4 (Bhadawari buffaloes) shows most differentiation as the geographical distance among these buffaloes is quite large from Eastern UP to bordering area of Uttar Pradesh and Madhya Pradesh.
Neutrality tests of Tajima’s D (Tajima, 1989) and Fu’s Fs statistics (Fu, 1997) were carried out to examine the population history of the individual clades. They estimate the deviation from neutrality, which is based on the expectation of a constant population size at mutation-drift equilibrium. Here, a negative Tajima’s D signifies an excess of low frequency polymorphisms relative to expectation, indicating population size expansion and/or positive selection (Tajima, 1989). A positive Tajima’s D signifies low levels of both low and high frequency polymorphisms, indicating a decrease in population size and/or balancing selection (Pichler, 2002). The indices were positive and not significant in Region 4, pointing to different demographic histories among the analyzed regions. Overall Tajima’s D and Fu’s Fs tests statistics in all populations were not statistically significant and consistent with a population at drift-mutation equilibrium.
However, the negative and significant Fu’s Fs statistical value observed in Region 1, Region 2 and Region 3 populations provide strong evidence for past population expansion, and rule out the possibility of genetic hitching and background selection, and evolutionary force that produce a pattern similar to population expansion (Fu and Li, 1993; Fu, 1997; Okello et al., 2005). Beneficial genetic variation will generally be accumulated and maintained in a rapidly growing population (Su et al., 2001).
The hypothesis that the observed data fit the sudden expansion model was tested using the sum of square deviations (SSD) (Schneider and Excoffier, 1999) and the raggedness index (Harpending, 1994). Here, non-significant values for SSD signify that the data do not deviate from that expected under the model of expansion. Non-significant raggedness values also indicate population expansion. Our observations of non-significant value in goodness-of-fit distribution for all populations suggest that population expansion occurred recently (Rogers, 1995).
Phylogenetic inference based on the haplotype network displayed a “star-like” shaped topology with a high ratio of singletons. This is generally interpreted as indicative of a population that has recently expanded in size from a small number of founders following a population bottleneck (Slatkin and Hudson, 1991). Here, H9 being with most probable ancestral haplotype. Haplotypes H72, H77 and H78 of Region 3 formed one cluster and separated from the rest of the clusters. The distribution of Eastern UP may be true to the local population genetic structure without having much gene flow.
CONCLUSION
The results of this study contribute to the knowledge of the existing genetic status of the Uttar Pradesh buffalo germplasm of India. Thus the riverine buffaloes of UP are quite homogenous and there is no structuring of buffaloes based on mitochondrial region. However a large diversity exists in buffaloes of Uttar Pradesh. The UP buffaloes have a single maternal lineage while Eastern UP buffaloes of Mau, Ballia and Ghazipur having variations which are distinctive from rest of the buffalo populations. This data provided important information for conservation programs and could be utilized to define breeding strategies.
Acknowledgements
The financial support provided from NAIP ICAR, component 4 (C-1050) is gratefully acknowledged.