Effect of Varying the Energy Density of Protein-adequate Diets on Nutrient Metabolism, Clinical Chemistry, Immune Response and Growth of Muzaffarnagari Lambs
Article information
Abstract
Effects of varied dietary energy densities on immune response and performance of Muzzafarnagari lambs were ascertained in a 180-d study. Animals (n = 24), in three groups, were fed diets providing 100% (100E), 80% (80E) or 70% (70E) of their metabolizable energy requirement. Mean nutrient digestibilities varied significantly among treatments. Nitrogen intake was lower (p<0.01) in the 70E. Nitrogen retention, was reduced (p<0.001) in 80E and 70E vs 100E. The average daily gain (p<0.001) was 47.01±4.23, 13.54±1.72 and -16.67±8.24 g for 100E, 80E and 70E, respectively. Hemoglobin concentration, haematocrit, total and differential leukocyte counts were lower (p<0.001) for 80E and 70E than for 100E with a similar trend (p<0.05) for serum glucose and total protein. Serum cortisol was reduced (p<0.001) with decreased energy availability. Antibody titre to Brucella abortus S19 showed an initial reduction in 80E and 70E vs 100E. Delayed-type hypersensitivity response was lower (p<0.001) in 80E and 70E vs 100E, accompanying a lower (p<0.001) nitric oxide production by the peripheral lymphocytes. It is concluded that the reduced dietary energy density significantly affects the growth performance and immune response of lambs.
INTRODUCTION
Feed resources and nutrition constitute the principal constraints to ruminant production in Asia (Devendra and Sevilla, 2002). Increasing population of small ruminants, increasing desertification, together with a fall in total feed resources due to overgrazing, ploughing of marginal land and soil erosion, have led to a situation wherein goats and sheep are facing serious nutrient shortages (Ben Salem and Smith, 2008). A perpetual gap between demand and supply of energy and protein (Singh et al., 1997) has been identified with the extensive system of ruminant production in most of the tropics including India. In these countries, underfeeding can be of high magnitude (Doreau et al., 2003). This is especially true in case of small ruminants with a gradual shrinking of rangeland reserves and diversion of high quality feed ingredients for high producing dairy animals. Eventually, small ruminants across the tropics are prone to periodic deficiency of macro- as well as micro- nutrients.
In addition to the above, periodic energy deficiencies are also quite prevalent under intensive systems of animal production, for example, during the periparturient stages of life in ruminants. In fact, it is an important factor in the development of such well known disorders as ketosis and fatty liver syndrome in dairy cows or pregnancy toxemia in ewes (Gaal et al., 1993).
Ruminants are able to cope with underfeeding by mobilisation of body reserves, even when the level of restriction is very high, as shown in fat-tail ewes (Atti and Bocquier, 1999). However, the metabolic adaptations may vary with the extent and type of malnutrition and, more importantly, with the physiological state of the animal. Further, the metabolic adjustments in terms of immune related mechanism are still not properly elucidated, particularly in growing animals. Immune functions have traditionally been regarded as part of maintenance requirements, but an increasing body of evidence suggests the sensitivity of immunity to nutrient supply (Galyean et al., 1999). We have recently reported that a dietary protein deprivation induced a decline in cell-mediated and humoral immune response in sheep accompanying alterations in related metabolic profile (Sahoo et al., 2009). However, only a few studies have examined the relationship between energy balance and immune system function in ruminants (Moyes et al., 2009). With most of these studies having focused on periparturient energy availability, the relation between energy status and immunity of growing ruminants is generally lacking, especially in terms of long-term studies.
In this backdrop, the present study was undertaken with an objective of assessing the influence of varied dietary energy densities of a protein-adequate diet on immune response of growing Muzaffarnagari lambs besides nutritional performance and clinical chemistry indices.
MATERIALS AND METHODS
Animals and management
The experimental procedures were in accordance with the ethical protocol and approved by the Staff Research Council and Institute Animal Ethics Committee of the institute. Twenty-four male and female Muzzafarnagari lambs, 6 to 9 months of age and 26.56±2.04 kg BW, were divided into three equal groups namely, normal energy (100E), medium energy (80E) and low energy (70E). The animals were housed in a well maintained concrete floored barn with provision for individual feeding. There were facilities for exercise and drinking water in the adjacent open paddocks, where the animals were let loose for 2 h each day in the morning. Before the study, the animals were fed a standard diet consisting of concentrate supplement and wheat straw for over two weeks, and the voluntary feed (DM) intake was determined as 25 g/kg LW. Prior to that, the animals were dewormed with the anthemintic albendazole (Albomar, 5 mg/kg BW; Glaxo Smith Kline Pharmaceuticals Limited, Mumbai, India). All the animals were maintained under strict hygienic and uniformed management during the 180-d experiment. Body weight was determined every 2 wks.
Feeds and feeding
The animals of 100E, 80E and 70E groups were fed at 100, 80 and 70 percent of the metabolizable energy (ME) requirement, respectively, as per Kearl (1982). The ME content of the diets in 80E and 70E groups was reduced by 20 and 30 percent (on as-fed basis) of that in 100E through qualitative and quantitative alterations in the diet composition. Accordingly, the assumed ME requirement for maintenance and 50 g daily growth (1.56 Mcal/d) in the 100E group was reduced to 1.27 and 1.12 Mcal/d for 80E and 70E, respectively. The protein content of diets for the restricted groups was increased (by manipulating the levels of maize and soybean meal in the concentrate) to equalize daily intake of crude protein across the three groups (Table 1). The lambs were offered calculated amount of the respective concentrate supplements, with a basal diet of wheat straw. The desired variation in energy intake was achieved by varying the concentrate: roughage ratio of the 100E, 80E and 70E diets at 0.40, 0.20 and 0.10, respectively. The quantity of wheat straw fed to individual animals was calculated to achieve a near ad libitum total DM intake at 25 g/kg BW to prevent possibly compensatory intake of wheat straw by 80E and 70E. Concentrate supplement was offered on an individual animal basis at 09.00 h after recording the residues, if any. Wheat straw was offered after ensuring complete consumption of the concentrates. The animals had access to clean drinking water twice a day (30 min each) during morning and afternoon hours.
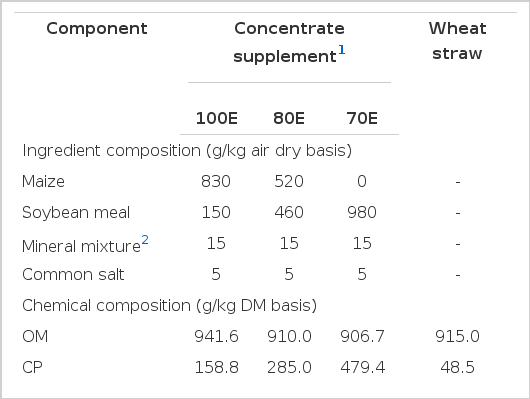
Ingredient and chemical composition of experimental feeds
Metabolism trial
Following 90 d of feeding, a metabolism trial involving quantitative determination of intake and output of nutrients was conducted after allowing the animals a 4-d adaptation period. During the collection period of 6 d, amounts of feeds offered, residues left, and faeces and urine excreted were recorded each day. Daily samples of concentrate, wheat straw, residues and faeces voided were kept for DM estimation. The samples of faeces and feeds were dried at 60°C in a forced-draft oven, ground through a 2 mm screen in a laboratory mill (SM100, Retsch GmbH, Stadt Haan, Germany) and stored in airtight high-density polyethylene jars pending further analysis. A further aliquot (0.1) of fresh faeces was mixed with 10 ml of 1:4 sulfuric acid and preserved in airtight bottles for N determination. Similarly, an aliquot (0.5 v/v) of urine was taken into the Kjeldahl flask containing 50 ml sulfuric acid for later analysis and qualification of nitrogen.
Blood collection and analysis
Blood was collected from the lambs by jugular venipuncture at 0, 60, 120 and 180 d in two sets of sterile glass tubes, one with the anticoagulant, ethylene diamine tetra acetate (EDTA, 1 mg/ml of blood) for hematological analysis. The second set of blood, collected without anticoagulant, was centrifuged at 1,000×g for 20 min to harvest serum. Serum samples were stored at −20°C for blood biochemical analysis.
The hemoglobin (Hb) concentration and packed-cell volume (PCV) were assessed according to the methods described by Richterich (1969) and Jain (1986), respectively. Total and differential leukocyte counts (TLC and DLC) were performed by adopting the methods laid down by Schalm et al. (1975). Analyses of the serum samples for glucose, total proteins, albumin and globulin were performed using commercial kits (Span Diagnostics Private Limited, Surat, India). Serum cortisol was estimated by radio-immuno assay using a Multi Crystal Gamma Counter (LB 2103, Berthold-Wallac, Wildbad, Germany) as per Tunn et al. (1992), using commercial kits manufactured and supplied by Immunotech (Marseille, France).
Immune response assessment
The immune status of the animals was appraised towards the end of the experiment by assessing both humoral and cell mediated immune responses. The humoral immunity of lambs was assessed following160 days using heat killed Brucella aborts S19 soluble antigen as an immunogen. Before inoculation of the B. abortus antigen, all the lambs were screened for the presence of prior antibody against Brucella using Rose Bengal Plate Test (RBPT), as per the procedure of Alton et al. (1975). The blood was collected from the lambs at 0, 7, 14 and 21 d of post-inoculation in clean sterile glass tubes and the separated serum samples stored in sterile vials at –20°C for measuring the antibody titre by enzyme-linked immnosorbent assay (ELISA) as described by Salih-Alj Debbarh et al. (1996). A constant dilution (1:1,000 in phosphate buffer saline with Tween-20) of serum for each test serum was used for antigen-antibody reaction and the colour developed was measured at 492 nm using UV-Vis spectrophotometer (UV 2800, Labomed Inc., Culver City, CA, USA). Absorbance related directly to the amount of antibody present.
The cell mediated immune (CMI) response was assessed through in vivo delayed type hypersensitivity (DTH) reaction against phytohaemagglutinine-P (PHA-P) as well as in vitro nitric oxide production by lymphocytes. The DTH response was assessed following 150 days as described elsewhere (Pattanaik et al., 2007).
Production of nitric oxide (NO), both constitutive (basal) and inducible (following stimulation), by activated macrophages is recognized a potent immune activation mechanism. NO, a highly labile gaseous free radical is rapidly oxidized to nitrite. The amount of nitrite within culture supernatant is indicative of the amount of NO produced by cells in culture (Waters et al., 2002). In vitro nitrite production, both constitutive (basal) and inducible (after stimulation with lipopolysachharides; LPS), by lymphocytes in the culture medium was determined by the Griess’s reaction method (Green et al., 1982). Whole blood was collected into heparinized tubes by jugular venipuncture from each animal. The blood was diluted 1:1 with Hank’s balanced salt solution (HBSS) and 7 ml of the blood/HBSS mixture was layered over 4 ml of histopaque (Sigma-Aldrich Co., St. Louis, MO, USA). Briefly, mononuclear cells (PBMC) from the peripheral blood were separated by density gradient centrifugation (Boyum, 1968). Cell concentration was adjusted to 5×10⁶ cell/ml in RPMI-1640 medium (phenol free) having 10% fetal calf serum, 100 IU penicillin, 100 μg streptomycin and supplemented with 5 mM L-arginine. Ninety-six-well flat-bottomed tissue culture plate wells were seeded with 5×10⁶ cells in 100 μl volume of above medium followed by incubation at 37°C under 5% CO2 for 48 h. For the estimation of nitric oxide, culture supernatant (50 μl) was mixed with an equal volume of Griess reagent [0.1% N-(1-naphthyl) ethylenediamine dihydrochloride, 1% sulfanilamide and 2.5% H3PO4] and absorbance was recorded at 570 nm using a micro plate reader (Microscan-MS5605A, Electronic Corporation of India Limited, Hyderabad, India). Nitrite level was determined by comparison with a sodium nitrite standard curve.
Feed analyses and statistics
Sample of feedstuffs, feed refusals, and faeces were analyzed for DM by oven drying method at 100°C (934.01), OM by muffle furnace incineration (967.05), EE by Soxhlet extraction (920.39), N by Kjeldahl method (984.13), CP (N×6.25) and ash (942.05) following the procedures of AOAC (1995). Total carbohydrates were determined by subtracting from OM, the sum of CP and EE. The OMD % was converted to digestible organic matter in the DM (DOMD %) using the equation DOMD % = OMD %×(100-ash%)/100; ME value (MJ/kg DM) was then calculated as ME (MJ/kg DM) = 0.15×DOMD % (MAFF, 1984). Fibre fractions viz. NDF and ADF were estimated by the methods of Van Soest et al. (1991); NDF was assayed with sodium sulfite and α-amylase in the NDF reagent. Both NDF and ADF were expressed with residual ash.
Statistical analysis of the data was performed using PASW 17.0 statistical package. Intake, digestibility and nitrogen balance data were analysed by 2-way ANOVA, with energy levels and sex as factors. Data on live weight changes and blood parameters were analysed by means of ANOVA for repeated-measures procedure. Because sex did not influence any of these parameters, the analysis included between-subject main effect of energy level, within-subject main effect of day of sampling and interaction day of sampling×energy level. Significance was declared at p<0.05; differences among means were tested using least significant difference. All statistical procedures were carried out as per Snedecor and Cochran (1989).
RESULTS AND DISCUSSION
Nutrient intake and utilization
The results of intake and digestibility of nutrients are presented in Table 2 along with the nutritive value of the three diets. The mean intake of DM (g/d) through concentrate supplement lowered (p<0.01) concomitant to reduced dietary energy level. The lambs under 80E group tended (p = 0.057) to consume more (+86 g) wheat straw as compared to the control 100E group, possibly in an attempt to compensate for the reduced availability of energy. The extent of compensatory increase in wheat straw consumption for 70E lambs (+60 g) was less than for 80E lambs. This could be due to a considerably higher proportion of wheat straw (∼79%) in the 80E diet, which may relate to the limited physical capacity of the reticulo-rumen. Furthermore, a very high level of NDF in the 80E diet might have affected the voluntary intake by eliciting a relatively slow rate of fermentation and increased digesta retention time (Meissner et al., 1991). Consequently, total DMI was lower (p<0.01) for 80E and 70E vs 100E. A significant (p<0.05) effect of sex was apparent in the DM intake, with a greater value for males than for females (685.5±31.9 vs 602.7±27.5 g/d) mainly due to higher (p<0.05) wheat straw consumption. On the contrary, Rodríguez et al. (2008), while studying the effect of varying intake levels in lambs, did not find any effect of sex on feed intake.
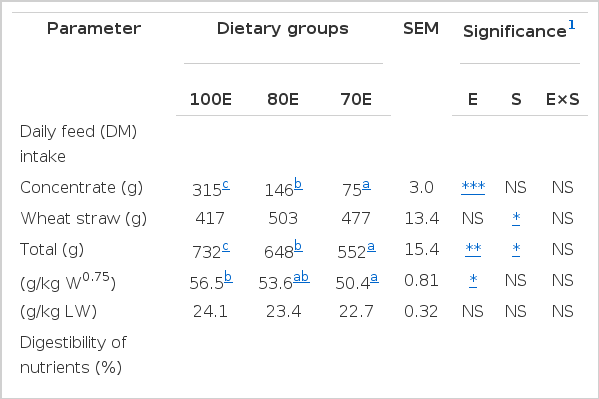
Intake and digestibility of nutrients by lambs fed varied levels of dietary energy
The digestibility of DM was not affected by treatment (p>0.05). Digestibilities of OM (p<0.05), CP (p<0.01) and EE (p<0.001) were lower for 80E and 70E compared with 100E. Contrary to the present observations, Mahgoub et al. (2000) observed higher DM digestibility in high- than low- energy diet. The present observations could be explained on the basis of lower intake of concentrates in relation to wheat straw by lambs in the 80E and 70E groups, as could be ascertained from the concentrate: roughage ratio of 0.29±0.01 for 80E and 0.16±0.01 for 70E vis-à-vis 0.79±0.06 for 100E group. Consequently, the apparent positive relationship between dietary energy levels and OM digestibility could be explained on the basis of a higher microbial fermentation due to increasing levels of concentrate availability. A reduction in the dietary energy level imparted significant (p<0.01) negative effect on the digestibility of CP by the lambs of 80E and 70E groups. This variation, in spite of the fact that, all the three diets were formulated to be isonitrogenous, was suggestive of the fact that for proper utilization of protein adequacy of dietary energy is of paramount importance.
Total carbohydrate digestibility was not influenced (p>0.05) by treatment, whereas digestibilities of NDF (p<0.01), ADF (p<0.001) and hemicellulose (p<0.01) were lower for 100E compared with 80E and 70E. This variation could be possibly ascribed to the variation in cereal (maize) contents of the concentrate supplements; the high proportion of maize in the concentrate supplement fed to 100E lambs could possibly have led to a reduction in ruminal pH attributable to excessive fermentative acid production, consequently depressing cellulolysis and fiber digestion. The potential adverse effect of high starch diets on fiber digestion has also been suggested by Ivey et al. (2000). Intake of CP was lowest (p<0.01) among treatments for 70E, although when expressed relative to metabolic body size, the values were comparable among treatments. Intake of DCP, however, ranked (p<0.001) 100E>80E>70E, which was attributable to differences in CP digestibility. Intake of ME in Mcal/d ranked (p<0.01) 100E>80E>70E, although expressed relative to body size ME intake was not different between 80E and 70E. Significantly (p<0.05) lower intake of CP, DCP and ME by females than male lambs was a reflection of the lower consumption of DM by the females. However, expressed in relation to metabolic body size, the differences between the sexes became non-significant.
Nitrogen metabolism
The data on N retention of lambs are presented in Table 3. The mean daily N intake was similar between 100E and 80E groups; however it was significantly (p<0.01) reduced in the low energy 70E group. There were no treatment differences in faecal and urinary N excretion. Nevertheless, a closer look into the data is indicative of apparently higher (p = 0.113) urinary N excretion by lambs under 70E vs 100E. Consequently, the N balance (g/d) showed a gradual reduction (p<0.01) from 2.57 in 100E to 1.38 in 80E and –0.17 in 70E lambs. Similar to the present findings, Chandramoni et al. (1999) and Giraldez et al. (1999) have also observed lower nitrogen retention upon feeding of low energy diets. Although the diets in the present experiment were made isonitrogenous, the lower N retention by 80E and 70E lambs was indicative of inefficient utilization of nitrogen due to unavailability of adequate energy. Moreover, as the deficit was more intense in the case of 70E, consequently it led to a net loss of nitrogen. This variation in nitrogen metabolism could be better explained by the observations that because of normal rumen metabolism, it is difficult to alter energy intake without affecting the amount of microbial protein synthesized in the rumen and, consequently, the total protein supply to the animal (Schroeder and Titgemeyer, 2008). Upon considering the nitrogen retention as a percentage of either intake or absorbed nitrogen, the persistence of the same trend was a reflection of the fact that energy deficit significantly affected the nitrogen utilization both at the rumen as well as at cellular level. There are reports in sheep that hypocaloric diets adequate in proteins did not interfere with the nitrogen balance (Hovell et al., 1983; Ørskov et al., 1983) because of the mobilization of endogenous energy (presumably body fat) to meet the energy needs of protein anabolism (Chowdhury, 1990). However in the present study, with the animals in the active growth phase, not much depot fat could be expected.

Nitrogen balance and live weight change in lambs fed varied levels of dietary energy
Live weight changes and growth performance
The data on growth performance is presented in Table 3, and fortnightly pattern of live weight (LW) changes are depicted in Figure 1. Initial weights, although similar among the three groups, were more (p<0.01) for males than females. The final LW, net gain as well as the average daily gain (ADG) at the end of 180 days exhibited significant (p<0.001) interaction between treatment and gender. But for all the interaction in LW changes, the variation between genders was due to varying magnitudes (not gain for one and loss for another). Accordingly, the data are interpreted with attention to main effects rather than interactions. Further, the lambs on diet 70E exhibited a negative ADG which differed significantly (p<0.001) from both 100E and 80E. It has been suggested that increasing level of feeding to increase energy supply could be associated not only with greater energy supply, but also with a greater total protein supply and an increase in the ratio of metabolizable protein: energy; thus, it is almost impossible to discern if the animals were increasing growth in response to additional supply of energy or protein (Schroeder and Titgemeyer, 2008). To counter this expected confusion, all the groups were fed at a uniform level of 25 g/kg LW. However, in spite of this, the resultant ratio between DCP:ME showed a decline with reducing levels of dietary energy, the values being 0.227, 0.209 and 0.185 for 100E, 80E and 70E groups, respectively. This variation, in turn, had significant impact on the protein utilization (Table 3), and consequently growth performance of the lambs.

Live weight changes of lambs fed 100 (100E), 80 (80E) and 70 (70E) percent of energy requirements. Values are expressed as mean±SE.
A significant (p<0.01) interaction between energy levels and sex was apparent in the ADG by lambs. Accordingly, ADG for females (35.56±2.08 g) was lower than males (58.47±4.24 g) on 100E diet while both males (12.08±2.91 g) and females (14.58±2.34 g) attained similar ADG when fed on 80E diet. In contrast, although both the sexes had negative ADG, females (–3.89±3.71 g) typically showed higher values than their male (–29.44±13.95 g) counterparts when fed on 70E diet. The percent decrease in ADG while reducing the energy level from 100E through 80E (79% in males vs 59% in females) to 70E (150% in males vs 111% in females) was lesser in female than male lambs. This, when considered in conjunction with the similar per unit (kg W0.75) intake of CP, DCP and ME by both the sexes (see data in Table 2), clearly indicates that males are more susceptible to energy restrictions in terms of growth than females, and this may be related to their higher requirements for energy. It was due to this confounding effect of dietary energy level with gender that no effect of sex was evident (p>0.05) on the growth of lambs, in contrast to such reports by various workers (Santra and Karim, 1999; Rodríguez et al., 2008). The present findings of better growth upon high energy diets are similar to observations in sheep by Mahgoub et al. (2000). Boulanouar et al. (1995) have also observed reduced LW gain in ewe lambs given energy and/or protein restricted diets than control. Jordanovski (1993), however, observed no influence of dietary energy level on the LW gain of early weaned lambs, when fed on isonitrogenous basis.
Clinical chemistry
The observations on the clinical chemistry of the lambs are presented in Table 4. The hemoglobin concentration reduced significantly (p<0.001) in 80E and 70E group of lambs in comparison to 100E. The haematocrit values also followed a similar trend. The lower Hb and haematocrit in the energy-deficient groups are a reflection of reduced dietary protein availability as could be ascertained from the reduced nitrogen utilization by these groups (Table 3). Likewise, Farrell et al. (1972) and Oetzel et al. (1988) have also observed lowered Hb and haematocrit in sheep upon feed restriction meant for reducing dietary availability of protein. It has been suggested that a severe protein deficiency interferes with Hb production (Whitehair, 1958).
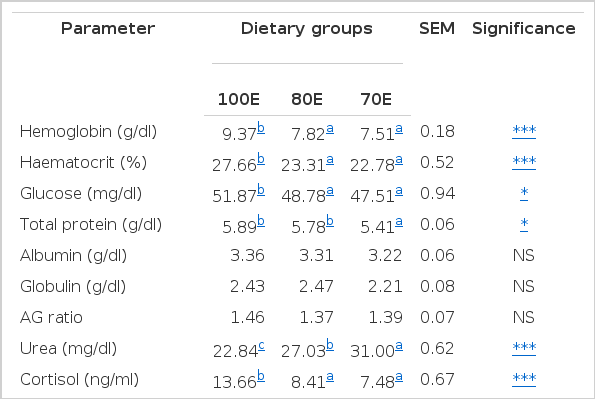
Clinical chemistry of experimental lambs fed varied levels of dietary energy
Serum glucose level was significantly (p<0.05) lower in both the energy-deficient groups in comparison to 100E. The higher level of protein intake in energy restricted condition causes an increase in energy deficiency (Yurtman et al., 2002), which may eventually result in reduced serum glucose with concomitant increase in serum urea (Hibbitt, 1988). In the present study also, serum levels of urea were increased (p<0.001) in both the energy-deficient groups. Earlier studies by Schrick et al. (1990) are also indicative of higher urea levels due to dietary energy restrictions. It could have resulted from a higher rate of amino acid catabolism to compensate for the deficiency of energy (glucose) or an imbalance of amino acids reaching the small intestine, as has been suggested by Abdelgadir et al. (1996). Blood urea nitrogen has been suggested as a useful indicator for nitrogen (protein) utilization in ruminants (Kohn et al., 2005).
The serum total protein was found to be significantly (p<0.05) low in 70E lambs as compared to 100E or 80E, while no variation was observed in the serum concentrations of albumin and globulin. Dietary protein deprivation has been reported to induce lower levels of serum total protein (Sahoo et al., 2009), which, as a matter of fact, is the situation in the present study as well. Contrary to the present observations, Ivey et al. (2000) observed no effects of dietary energy variations in serum total proteins.
The TLC values exhibited a consistent declining trend (p<0.01) as the energy availability reduced from 100 to 70 percent. This could be attributed to a possible reduction in synthesis of leukocytes because of lower availability of both energy and protein. Moreover, it could also be correlated to the reported atrophy of thymus due to malnutrition (Fiske and Adams, 1985). The perusal of the DLC data (Table 4) revealed that the concentrations of all the cell types, with the exception of basophills, were significantly influenced by dietary energy availability. The neutrophil concentration showed an increase (p<0.01) in the energy-starved 80E and 70E groups (41.31 and 42.56%) as compared to the control 100E (37.53%). Contrary to the above, lymphocyte ratio was significantly (p<0.05) lower in 70E (52.25%) as compared to 80E (55.0%) or 100E (56.44%). The latter could have been due restricted lymphocyte proliferation because of reduced nutrient availability as suggested by Fiske and Adams (1985). Leukocytes subpopulation are known to vary because of several factors viz. age, sex, diet and environment etc.
The mean serum level of cortisol varied significantly (p<0.001) among the groups; showing a definite reduction consequent to reduced availability of dietary energy. The values obtained in the present study (7 to 14 ng/ml) falls within the reported plasma cortisol ranges for sheep (Fell et al., 1985; Ekpe and Christopherson, 2000; Kiyma et al., 2004). Similar to our findings, Sticker et al. (1995) also observed a significantly reduced plasma cortisol concentration in mares fed diet restricted to 50 per cent of the ME requirements. Wynn et al. (1988), on the other hand, observed no changes in plasma cortisol in relation to nutrition when sheep were fed at two levels (5.2 or 9.7 MJ/d) of energy. Likewise, Adam et al. (1997) also observed no effect of supplying 0.5 or 1.5 times of maintenance energy requirements on plasma cortisol levels of weathers. There are a number of studies which observed no effects of dietary fasting or variable dietary energy or malnutrition on serum cortisol and calves (Griebel et al., 1987; Ofay and Rosenguist, 1988), cows (Schrick et al., 1990), or ewes (Kiyma et al., 2004). Contrary to these findings, feed restriction of Suffolk-cross lambs is reported to have significantly increased the plasma cortisol compared to those fed ad libitum (Ekpe and Christopherson, 2000). Because of the metabolic role of cortisol in increasing gluconeogenesis, lipolysis, and protein catabolism, it would appear that nutrient restriction should increase circulating cortisol concentrations and facilitate nutrient mobilization. However, the lack of such an effect in the present situation could possibly be attributed to long duration of the dietary restrictions employed in this study. In fact, Sticker et al. (1995) have concluded that a gradual reduction in average cortisol concentrations in mares fed low energy diet and attributed the same to prolonged nutrient restriction.
Immune response
Several immune parameters have been proposed as markers of chronic stressful situations in farm animals including antibody production, an increase in the ratio between neutrophils and lymphocytes (N/L ratio) and functional activity of peripheral blood mononuclear cells (Trevisi and Bertoni, 2009). The N/L ratio in the present study showed progressively higher values (p<0.01) with decreased dietary energy levels (Table 4), which is indicative of stress. A higher N/L ratio may also indicate a health challenge to the animal, reflecting a weakened immune system and often, consequently, an animal in poor health (Hyun et al., 2005). Consequently, the observed higher N/L ratio in both the low energy groups is possibly indicative of a weakening of the immune system of the lambs.
Antibody response
Results on humoral immune response, assessed by monitoring the serum antibody against heat killed B. abortus S19 soluble antigen, are presented in Figure 2. The pre-inoculation screening of the lambs for Brucella infection through RBPT revealed absence of antibody, implying that the herd was free from prior infection or sensitization. The antibody level (expressed as A492) was significantly (p<0.05) reduced in both the energy deprived groups 80E and 70E at 7 d post-inoculation as compared to 100E group, indicative of reduced initial antibody production. However, at subsequent periods, the antibody level did not differ among the three groups reflecting of identical humoral immune response. The present observation of lower antibody response on d 7 followed by a subsequent identical response apparently corroborates the findings of Gropp and Birzer (1989) which reported that severe protein energy malnutrition causes immunosuppression by delaying humoral antibody reaction, among other factors. Overall, however, the dietary alterations in terms of energy apparently induced no perceptible negative effects on the humoral immunity of the lambs. The present observations are in agreement with the reports of Olson and Bull (1986) who observed no major or sustained differences in the humoral response of beef cows due to energy and/or protein restriction, in spite of differences in antibody titers to tetanus toxoid or chicken RBC. Similar to the present observations, Fiske and Adams (1985) have reported no difference in antibody response to B. abortus S19 antigen in groups of steers fed on low, normal or high plane of nutrition. On the other hand, they have observed reduced antibody response to chicken RBC accompanying thymus atrophy in the underfed steers in the same study. Jacobi et al. (1997) in a study exploring the correlation between somatic cell counts of milk with feed imbalances suggested that protein synthesis affected by energy deficiency reduces humoral immunity. In the present study also a state of protein deficiency was observed in 70E group of lambs fed 70 per cent of 80E requirements, as could be ascertained form the nitrogen metabolism data (Table 3); however, no adverse effect of this secondary protein deficiency was apparent on the humoral immunity of the lambs, other than a delayed response.
Antibody titre against Brucella abortus S19 antigen by lambs fed 100 (100E), 80 (80E) and 70 (70E) percent of energy requirements. Values are expressed as mean±SE; superscripts (a,b) indicate significant (p<0.05) differences between the groups.
Delayed-type hypersensitivity response
The results of the DTH response are presented graphically in Figure 3. Animals under all the three dietary groups exhibited an increase in indurations of skin following the intra-dermal injection of PHA-P. However, averaged across the post-inoculation measurements, the mean skin thickness exhibited significantly (p<0.01) lower values in animals under both the energy-restricted groups (3.48±0.14 and 3.37±0.13 vs 3.89±0.18 mm), indicative of significantly reduced CMI response. Reduced skin thickness following sensitization with PHA-P upon protein restriction was also recorded in sheep by Sahoo et al. (2009). Feed restriction of ewes has been reported to reduce the response to delayed hypersensitivity tests (Oetzel et al., 1988). Latshaw (1991) has suggested that cellular integrity is very important for receiving and responding to messages needed to coordinate an immune response. The affection of cellular integrity because of oxidative stress, therefore, may eventually lead to a reduced immune response. In the present study, a significant (p<0.05) increase in lipid peroxidation was observed in the energy-restricted groups (Singh et al., 2011), which happens to be a good indicator of oxidative damage of cell membrane. Hence, this could also explain, at least in part, the reduced CMI response due to energy restriction. Further, accumulating levels of DNA damage, induced by oxidative damage, may also cause reduced cellular function that potentially leads to suboptimal immune response (Barnett and Barnett, 1998). Fiske and Adams (1985) observed non-significant differences in the lymphocyte blastogenic responses of steers fed hypo- and hyper-alimented diets to concanavalin-A and pokeweed. However, Woodward et al. (1980) have suggested from a study involving bovines that nutritional factors (deficiencies) influence the mitogenic responses to T lymphocytes, which corroborates the present finding.
DTH response of lambs fed 100 (100E), 80 (80E) and 70 (70E) percent of energy requirements. Values are expressed as mean ±SE; superscripts (a,b) indicate significant (p = 0.066) differences between the groups.
Nitric oxide production
The mean values for nitrite, as an indicator of NO production by lymphocytes, are presented in Figure 4. Dietary energy variations employed in the present study imparted significant influence on the nitrite production, both basal as well as upon lipopolysaccharide (LPS) stimulation; the basal nitrite production (μM) reduced significantly (p<0.01) in the energy restricted 80E (3.65±0.19) and 70E (3.78±0.14) groups compared to the control group (5.17±0.27). The corresponding values following LPS stimulation (4.29±0.64 and 4.33±0.24 vs 6.84±0.89 μM) also followed the similar trends. These results indicate that dietary energy restriction reduced both the constitutive and inducible production of NO by lymphocytes. The PBMC, incubated with different mitogens to induce non-specific multiplication on lymphocyte, have shown a consistent depression of mitogenesis under chronic stressful situations in ruminants (Trevisi and Bertoni, 2009). The present observations are in confirmation of the reported positive relationship between energy balance of periparturient cows with lymphocyte response to mitogens like PHA, Con A and poke weed (Ropstad et al., 1989). It is now recognized that NO produced by many cell types plays a vital role in host defense and immunity, including the modulation of inflammatory responses (Christopherson and Bredt, 1997). It has been suggested by Clancy et al. (1998) that the finding of increased NO production is viewed as a reflection of an immune-activated state in which inflammatory cytokines and other mediators have up-regulated inducible NO production. With nitrite production been recognized as a measure of CMI response in several species (Roach et al., 1995; Zhao et al., 1997), the present findings of significantly lower in vitro production of nitrite by lymphocytes of lambs upon energy deprived diets appears to be further confirmation of the lower CMI response observed in the said groups as assessed through DTH response to PHA-P.
In vitro nitrite production by peripheral lymphocytes of lambs fed 100 (100E), 80 (80E) and 70 (70E) percent of energy requirements. Values are expressed as mean±SE; superscripts indicate significant differences between the groups (a,b p<0.001; m,n p<0.01).
Traditionally, immune functions have been regarded as part of maintenance (Houdijk et al., 2001). However, there is an increasing body of evidence that at least some aspects of immunity are sensitive to changes in nutrient supply (Coop and Kyriazakis, 1999; Galyean et al., 1999), because of increased nutritional costs associated with the development of an effective immune response (Lochmiller and Deerenberg, 2000). However, if nutrient availability is scarce, it requires a trade-off between mounting an immune response and other body functions like growth and reproduction (Doeschl-Wilson et al., 2009). As immunological functions are prioritized over productive function (Coop and Kyriazakis, 1999), it is expected that a growing animal would try to maintain its immune function at the cost of growth; and the observation of low/negative growth exhibited by 80E and 70E lambs in the present study gives credence to the above theory. There is ample research available studying the nutrient partitioning between immune function and reproduction, which have ranked reproduction ahead of immune function. Similarly, studies in dairy cows have indicated that the metabolic components of negative energy balance were associated with a deficiency in the functions of the immune system in vitro (Suriyasathaporn et al., 1999; Lacetera et al., 2002; Scalia et al., 2006). It has been suggested that dairy cows with negative energy balance are predisposed to liver damage and increased peripheral insulin resistance, both of which can have a negative impact on the immune system (Wathes et al., 2009). However, specific studies targeting prioritization of functions between growth and immunity including elucidation of the underlying homeorrhectic mechanisms involved are scarce. In the absence of such information, it would be reasonable to hypothesize that a growing animal prioritizes immune function ahead of growth, and this could be the reason behind the almost similar level of humoral immune response recorded in the present study. However, the compromise in CMI response recorded could be attributed to apparent long duration of nutrient deprivation (180 d).
CONCLUSION
The most obvious constraint of experimental approaches based on dietary manipulation is the impossibility of altering the energy supply of the animals without affecting the amount of microbial protein synthesized in the rumen (Schroeder and Titgemeyer, 2008). In the present experiment also, the same constraint was evident, which possibly confounded the effects of dietary energy on the parameters assessed. Nonetheless, considering the obligatory interrelationship between dietary energy and protein in ruminants, and based on the overall results, it could be concluded that reduced levels of dietary energy impacted significantly the protein metabolism even though the diets provided adequate protein. Consequently, lambs on energy deficient diets exhibited reduced nutrient utilization, lowered growth and compromised cell-mediated immunity accompanying a delayed onset of the humoral response. Further, the study highlights the prioritization of immune function over growth in growing lambs reared in a normal non-infectious set up.
Acknowledgements
The authors are thankful to the Director, Indian Veterinary Research Institute, for providing the necessary facilities to carry out the study. The first author thankfully acknowledges the financial assistance in the form of Junior Research Fellowship provided to him by the Deemed University, Indian Veterinary Research Institute, Izatnagar, India.