Comparison and Correlation Analysis of Different Swine Breeds Meat Quality
Article information
Abstract
This study was performed to determine the influence of pig breed and gender on the ultimate pH and physicochemical properties of pork. The correlations between pH and pork quality traits directly related to carcass grade, and consumer’s preference were also evaluated. The pH and meat grading scores for cold carcasses of 215 purebred pigs (Duroc, Landrace, and Yorkshire) from four different farms were obtained. Meat quality parameters of the pork loin were analyzed. Duroc and female animals were more affected compared to other breeds and male pigs. Duroc animals had the highest ultimate pH, carcass back fat thickness, marbling scores, yellowness, and fat content (p<0.05). Landrace pigs had the highest color lightness and cooking loss values (p<0.05). Among all trait parameters, marbling scores showed the highest significant differences when evaluating the impact of breed and gender on meat quality characteristics (p<0.001). Ultimate pH was positively correlated with carcass weight (0.20), back fat thickness (0.19), marbling score (0.17), and color score (0.16) while negatively correlated with cooking loss (−0.24) and shear force (−0.20). Therefore, pork samples with lower ultimate pH had lower cooking loss, higher lightness, and higher shear force values irrespective of breed.
INTRODUCTION
Pork is an important source of high-quality animal proteins, essential minerals, vitamins, and fat in the human diet. Pig breeding and production systems have been established to promote higher production efficiency through genetic and feeding strategies. Recently, the meat quality of pork has become more economically important (Sosnicki, 2003).
Swine breeds in the Republic of Korea have been improved primarily in terms of production capacity such as weight gain, but there is increasing interest in improving meat quality due to Free Trade Agreement and consumer’ preferences. It has been well documented that the rate and extent of pH decline have significant effects on meat quality traits such as water-holding capacity (Huff-Lonergan and Lonergan, 2005), tenderness (Savell et al., 2005), meat color (Holmer et al., 2009), and lipid oxidation (Hansen et al., 2004). However, ultimate pH has been implicated as a major factor affecting pork quality during the early postmortem period (Offer et al., 1991). Price et al. (1987) indicated that a variety of factors other than ultimate pH, such as muscle, lipid content, cooking method, and/or degree of doneness, can influence meat characteristics. Although all these factors influence meat quality, ultimate pH remains a significant source of variation.
Price et al. (1987) reported that initial and ultimate pH can influence the extent of protein denaturation and fresh pork attributes such as color or water-holding capacity. As muscle pH moves further away from its isoelectric point (5.0–5.l), water-binding ability increases and the muscle appears darken due to greater light absorbance. Offer et al. (1991) observed increased protein denaturation and drip loss as muscle ultimate pH decreases. These traits have an impact on processing yields, consumer purchasing decisions, and sensory attributes of meat or processed pork products (Bidner et al., 2007). Ultimate pH was also found to have a curvilinear relationship with beef tenderness by Purchas et al. (1990). A similar study by Eikelenboom et al. (1994) indicated that a higher ultimate pH results in increased pork tenderness. These findings suggest that increasing ultimate pH (e.g., by fasting the pig) may be a way to improve the tenderness of pork. Eikelenboom et al. (1994) also found that ultimate pH is highly correlated with shear force measured 7 dpostmortem.
In addition, a large number of reports have indicated that other meat quality traits are affected by breed and gender. Smulders et al. (1992) found that intramuscular fat content is influenced by breed and gender. Jeleníková et al. (2008) observed that the tenderness of cooked meat varies according to breed (the most tender meat was from Duroc animals). In addition, animal gender significantly affects meat tenderness. It is generally known that shear force is an important index for evaluating the tenderness of pork. As reported by Jeleníková et al. (2008), shear force (meat tenderness) decreases with increasing intramuscular fat content and pH at 45 min post mortem. Furthermore, Price et al. (1987) stated that increasing the amount of soluble protein increases the binding strength during processing.
Although meat quality traits have been extensively evaluated in several studies, the correlations among meat quality parameters such as ultimate pH, shear value, cooking loss, moisture content, and color along with the effect of breed and gender on meat quality parameters have not been systematically explored for pork. There is limited information available on the relationships between ultimate pH and other meat quality traits on musculus longissimus lumborum et thoracis. Therefore, the objective of present study was to evaluate the ultimate pH and other pork traits, and determine the influence of animal breed and gender on pork quality.
MATERIALS AND METHODS
Animals and experimental method
A total of 215 purebred pigs (45 Landrace, 98 Duroc, and 72 Yorkshire; 164 females and 51 uncastrated males with an average age 147 d) from four breeding farms was slaughtered. The meat grading scores (carcass weight (CW), carcass back fat thickness (C_bf), marbling score (MS, on a scale of 1–5), and meat color score) were determined by an authorized grading official. Samples (50 cm, 5 kg) were collected and transported by one researcher from the slaughter house to the lab within 2 h after sampling.
After thawing overnight (8 h), the ultimate pH (pHu) was measured with an Orion 3 Star (Thermo Electron Corp., USA) pH meter. Maximum comprehensive load (MCL), cooking loss (CL), and meat color were determined for the same sample block that was thawed overnight in a chiller. Shear force was measured with an Instron Universal Testing Machine (Model 3342, Instron Corporation, USA) for six core samples with 0.5-inch diameters using a crosshead speed of 400 mm/min and a 40-kgf load cell. Weight of the meat before and after cooking was recorded and CL was reported as the percent weight loss relative to the weight of the uncooked sample at room temperature.
Objective meat color was evaluated with a Konica Minolta Spectrophotometer CM-2500d with an 8-mm measuring port, D 65 illuminant, and 10° observer. Hunterlightness (L), redness (a), and yellowness (b) values were recorded. Sarcoplasmic protein solubility (Prosolu) measurements were carried out as previously described by Warner et al. (1997). Briefly, 1 g of muscle tissue sample was placed in a 50-ml conical tube and 10 ml of ice-cold 0.025 M potassium phosphate buffer (pH 7.2) was added. The sample was homogenized thrice with 4-sbursts and a 10-s break in between using an Ultra Turrax T25B (IKA Works (Asia) Sdn, Bhd, Malaysia) at 11,000 rpm. After incubating overnight in ice, the samples were centrifuged at 1,500×g for 20 min at 4°C. About 1 ml of the supernatant was taken, and the protein concentration was determined and expressed as mg/g tissue. The moisture content was measured in duplicate with an HR73 halogen moisture analyzer (Mettler-Toledo GmbH, Switzerland). Crude fat (CF) was analyzed using the Soxhlet method with petroleum ether as the extracting solvent (AMPC Meat and Livestock Australia). CF content of the lean sample was reported as percent extracted fat relative to the weight of the fresh sample.
Statistical analysis
Data were analyzed using the following general linear model:
Significance of the least square means for the meat quality parameters according to breed and gender was determined using the GLM procedure (SAS Institute, Cary, NC, 2007). Least square means were examined with a pair difference test, and simple correlation coefficients for the quality traits of the pooled data were calculated using the Pearson procedure.
RESULTS AND DISCUSSION
The present study evaluated the influence of breed and gender on pork quality traits. Basic statistics for the traits studied a represented in Table 1. The least square means for the breed and gender a represented in Table 2 and 3, respectively. Pearson’s correlations between meat quality parameters for the samples from all breeds are shown in Table 4. Compared to the other breeds, Duroc had distinct characteristics. Among the breeds (Duroc, Landrace, and Yorkshire) included in this study, Duroc samples had the highest pHu, CW, C_bf, MS, color value score, redness, yellowness, and CF content. In contrast, this breed had the lowest lightness, Prosolu, and MCL values. Meat from Duroc pigs appeared darker (lower lightness values) with greater color intensity (higher redness and yellowness values) compared to Landrace and Yorkshire samples. Gjerlaug-Enger et al. (2010) reported a similar result for Duroc and Landrace animals.

Summary statistics of the characteristics of musculuslongissimus lumborum et thoracis meat samples
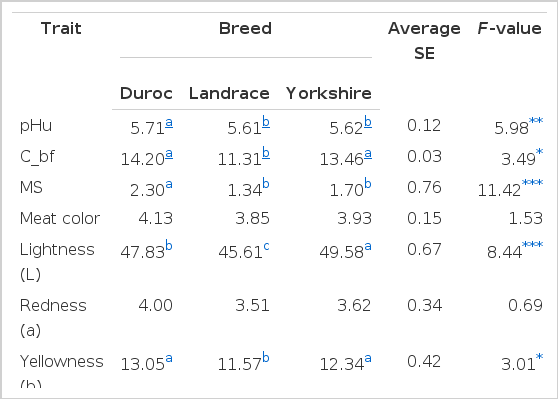
Least square means demonstrating the effect of breed on meat characteristics
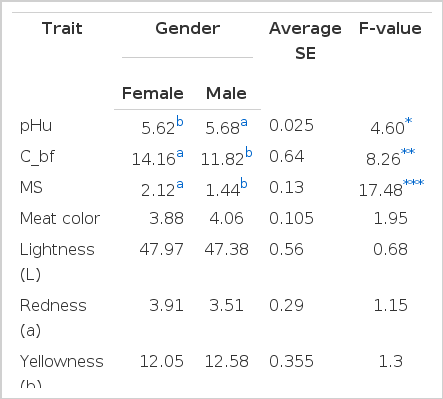
Least square mean values showing the effect of gender on meat characteristics
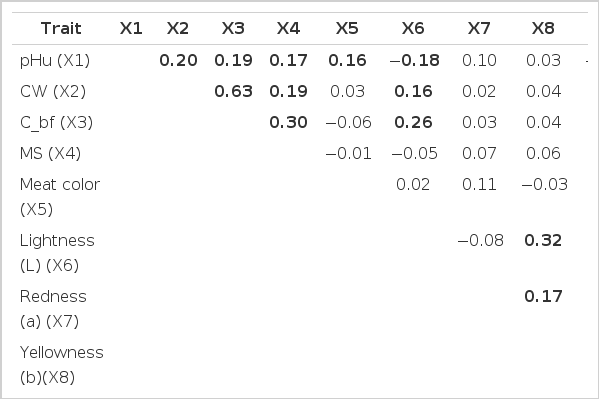
Pearson correlation between the traits of meat samples from all breeds
Data presented in Table 2 indicated that breed had a highly significant impact on lightness and MS (p<0.001) for which the F values were 11.42 and 8.44, respectively. There were significant differences in meat quality parameters for the three breeds. MS was significantly affected by the Duroc genetic line while lightness was significantly impacted by the Yorkshire genetic line. In addition, breed had a highly significant effect on pHu, C_bf, yellowness, CL, and CF (p<0.05). Meat traits such as pHu, C_bf, yellowness, and CF were significantly affected by the Duroc genetic line. F values for these parameters were 5.98, 3.49, 3.01, 4.87, and 3.39, respectively. In the present study, pHu observed for Duroc animals was higher than that of Yorkshire and Landrace pigs. Similar results were reported by Gjerlaug-Enger et al. (2010) demonstrating that Landrace is associated with lower pHu levels than Duroc. Berg et al. (2003) studied several breeds and found higher WHC, IMF content, and pHu along with lower lightness for the LD muscle of Duroc pigs compared to Landrace.
Jeleníková et al. (2008) observed the influence of pig breed on meat shear force. Differences in shear force of heat-treated musculuslongissimus lumborum et thoracis between different breeds (Large White, Czech, Duroc, and Landrace) were found to be statistically significant. Among these, the Duroc breed was discovered to be the most tender. This may be related to different sample processing methods used in the experiment. Additionally, meat color, redness, moisture, Prosolu measurements, and MCL were found to not be significantly affected by breed. On the other hand, differences in Warner-Bratzler shear force of musculus longissimus lumborum et thoracis between different pure breeds were observed to be statistically significant (Jeleníková et al., 2008). These findings demonstrate that Duroc and other breeds are quite different in terms of meat quality traits. This may be explained by both breed origin and the animal selection methods used. Furthermore, the Duroc genetic line has a stronger effect than Yorkshire and Landrace, indicating that breed differences might influence meat trait relationships.
Results presented in Table 3 indicated that gender exerted various influences on meat quality characteristics. MS had the highest degree of variation between the genders (p<0.001) with female animals obtaining the highest scores. Vaz et al. (2002, 2010) also reported higher MS values for females compared to males. C_bf was also affected by gender with higher values for female than male pigs. MS has an intimate relationship with IMF. Fernandeza et al. (1999) reported that MS is significantly affected by IMF. Numerous studies also reported that animal gender influences IMF.
The larger difference in meat quality traits observed for male and female Duroc pigs compared to Landrace animals is supported by data from Jelenikova et al. (2008). This group estimated the differences between Landrace and Duroc animals (among other breeds), and between females and castrates. Traits related to tenderness and IMF were analyzed and showed that meat from females has greater tenderness and juiciness compared to castrates. Contrary to most studies, this investigation demonstrated that females have higher IMF contents than castrates. Latorre et al. (2003) found significantly higher IMF contents along with less moisture and protein in meat from castrates compared to females, whereas same results observed in the study. Mears et al. (2001) reported that MS is not affected by breed (p>0.1) among cattle. However, calf gender significantly affects slaughter live weight and average back fat depth at the 12th to 13th rib. Malau-Aduli (2000) also reported that MS is highly affected (p>0.01) by sire-breed and gender by year interaction.
Correlations among meat quality traits are presented in Table 4. Results showed that pHu had positive correlations with CW, C_bf, MS, and meat color but was negatively correlated with lightness, CL, and MCL. Data obtained were similar to those from a previous study by De Vol et al. (1988) showing significant correlations between loin pHu and subjective color as well as subjective firmness (r = 0.62 and 0.73, respectively). Moreover, Bidner et al. (2007) reported that the strength of the relationships between pHu and meat quality vary among studies for several possible reasons. pHu of meat is considered to be a factor that influences the color of pork. This was confirmed in the present study. pHu had a positive correlation with meat color (r = 0.16, p<0.05). Bidner et al. (1999) also reported that loin pHu is significantly correlated with drip loss, lightness, redness, and yellowness (r = −0.49, −0.62, −0.68, −0.23, and −0.47, respectively). Herring et al. (1971) found that salt-soluble protein contents of the loin are significantly related to loin pH (r = 0.42). Increasing value of pH, increases protein functionality and the amount of salt-soluble protein that can be extracted (Price and Schweigert et al., 1987), however results showed that the pHu had low correlation with lightness and protein content (r = −0.18 and 0.07, respectively) and not significantly correlated with redness, and yellowness which could be possibly related to breed differences.
Lundstrom et al. (1998) reported that pH is not significantly related to shear force (R2 = 0.03). Bidner et al. (2007) also found that pHu is negatively correlated with MCL; MCL decreases as pHu increases. Results indicated that CW had positive correlations with MS and lightness (r = 0.63, 0.19, and 0.16, respectively) but was negatively correlated with moisture and Prosolu values (r = −0.30 and −0.32, respectively).
Relationships between BFT and CW have been investigated by many authors. Unlike the present study, Hick et al. (1998) and Szyndler-Nedza et al. (2004) identified a very weak correlation between CW and BFT (r = −0.33). Higher correlations were observed between BFT and CW (0.63). C_bf also showed a positive correlation with MS, lightness, and CF (r = 0.3, 0.26, and 0.3, respectively) but was found to have a negative correlation with moisture (r = −0.43).
Cooking and drip loss are important indicators of fresh pork quality. Huff-Lonergan et al. (2002) reported a low but statistically significant phenotypic correlation (0.16) between drip loss and cooking loss. Using the same method, Suzuki et al. (2001) also reported a low phenotypic correlation (0.19) between drip loss and cooking loss. In the study, CL had positive correlations with lightness and MCL (r = 0.37 and 0.33, respectively).
IMF and pH have been found to be positively correlated while color lightness and moisture content are negatively correlated with flavor, tenderness, and acceptability (Cameron et al., 1990). Consumer preference for meat seems to be strongly affected by changes in color, appearance, and texture (Risvik, 1994). Moreover, yellowness is positively correlated with lightness, redness, and CF (r = 0.32, 0.17, and 0.19, respectively) but negatively associatedwith moisture, Prosolu value, and MCL (r = −0.34, −0.32, and −0.32, respectively).
MS of pork was positively correlated with CF content (r = 0.39). In contrast, fat content was negatively correlated with shear force(r = −0.42). The reason for this could be that as FC increased, shear force decreased due to marbling.
IMPLICATIONS
Results from the present investigation demonstrated that breed and gender influence pork quality traits. The effects of pHu, CW, C_bf, MS, meat color, CL, moisture, CF, Prosolu values, and MCL on meat characteristics were verified. pHu was affected by breed and gender but not related to redness, yellowness, moisture, CF, or Prosolu values. Systematic evaluation of the effects and correlations among meat quality parameters could be used for further studies conducted to improve the production of high quality pork.
Acknowledgements
This work was carried out with the support of “Cooperative Research Program for Agriculture Science and Technology Development (project no. PJ9071172011)” Rural Development Administration, Republic of Korea.