


INTRODUCTION
Increases in world population, changes in human diets (Godfray et al., 2010) and new intensive livestock production methods are causing a massive increase in collected excreta (Bouwman et al., 2011). In Vietnam, the amount of manure collected is also increasing, not only because of the increase in livestock production, but also because livestock is increasingly being raised in animal houses. Manure management has to be adapted to the new production systems in order to prevent the expansion in livestock production from causing excessive pollution in the form of greenhouse gases (GHG), eutrophication, the spread of diseases and odour (Xiong et al., 2008; Davidson, 2009; Sutton et al., 2011).
One of the most cost-effective technologies for reducing environmental pollution related to manure management is biogas production, which is known to improve hygiene, reduce odours and GHG emissions, and also reduce the need for mineral fertilizers and pesticides (Sommer et al., 2004; Jiang et al., 2011; Triolo et al., 2012). In regions without energy infrastructure, clean biogas energy is very important in reducing the costly use of fossil fuels, limiting deforestation and improving the livelihood of women cooking food (Cu et al., 2012). Consequently, the Vietnamese government supports the construction of biogas digesters, with plans for 180,000 farm biogas digesters to be in operation by 2011 (Cu et al., 2012). For similar reasons, the Chinese government has supported the construction of 30 million small biogas plants, and in India about 4 million biogas plants are planned or already in operation (Bhattacharya and Jana, 2009; Jiang et al., 2011). Due to the many benefits of biogas digestion, it is anticipated that this technology will also be promoted in other developing countries, such as the Philippines, Thailand, Nepal and Brazil. However, to support efficient use of the technology, there must be strong local competence to assess the biogas production potential and to develop appropriate management schemes.
At present, end-users in Vietnam, China and India often fail to control the technology efficiently, due to poor management competence (Jiang et al., 2011). This leads to production being inadequate in periods of high demand in low temperature regions during winter, and excessive during periods of high temperature and high production of excreta (Cu et al., 2012). There is thus a need to improve knowledge about biogas production potential using local biomass, in order to develop digesters adapted to the local environment and individual management schemes, thus ensuring production of the gas needed for cooking, heating and light (Vu et al., 2007; Cu et al., 2012). Hence, there is an associated need to review, develop and validate methods to assess biogas production which can be used in laboratories with limited access to analytical instruments. Research carried out at laboratories in regions with limited access to high-tech instruments must be of international standard, so as to ensure useful results and contribute to progress in development of the technology.
Biochemical methane potential (BMP), the maximum methane production capacity of each feedstock, is a key parameter in designing and operating a successful real-scale biogas plant. A recent study using data from different laboratories gave the impression that the data may vary between laboratories (Triolo et al., 2011), confirming observations by Angelidaki et al. (2009). Thus BMP values determined by different researchers and institutes cannot usually be compared, due to differences in the experimental design and equipment used and variations in temperature and experimental conditions (Hansen et al., 2006; Kiilholma, 2009; Raposo et al., 2011).
The aim of the present study was therefore to test and validate methods and analytical procedures suitable for use in simple laboratories. The specific objective was to determine and compare the analytical precision of the most widely used BMP and gas volume measurement methods. Determination of methane concentration in biogas by gas chromatography (GC) and by absorption of CO2 in alkaline liquid was compared in order to test the precision of an alternative method for determining methane concentration in laboratories with limited access to analytical equipment.
MATERIAL AND METHODS
Overview of methods tested
The fermentation procedures, gas volume measurement methods and precision tests evaluated are summarised in Table 1. Regarding the fermentation procedures, the three most widely used were tested, which were the German standard procedure VDI 4630 (VDI, 2006) (‘VDI method’), the BMP procedure used by Møller et al. (2004) (‘Moller method’) and the procedure proposed by Hansen et al. (2004) (‘Hansen method’). Regarding the gas volume measurement methods, two liquid replacement tests were compared with the large syringe method. The precision of gas concentrations determined by absorbing CO2 in alkaline liquid was tested by comparing the results obtained by GC; the gas-tightness of liquid replacement was tested using different tubes; and the analytical precision in determination of dry matter (DM) and volatile solids (VS) was tested.
Comparison of BMP by different batch protocols
Substrate and inoculum used:
The fattening pig manure (‘pig manure’) and dairy cow manure (‘cow manure’) used as substrates were collected from Fangel biogas plant. Microcrystalline Cellulose (Sigma Aldrich) was used as a standard substrate for all three methods according to VDI 4630 (VDI 2006). Microcrystalline Cellulose is commonly used reference substrate to estimate quality of batch experiment. Most widely used two different digestion temperatures were chosen, thermophilic (≈55°C) and mesophilic (≈35°C). Since the Hansen and Moller methods describe anaerobic digestion at thermophilic and mesophilic conditions, respectively, thermophilic digestions were carried out for the Hansen method and mesophilic digestions for the Moller method. VID4630 (VDI2006) describes both thermophilic and mesophilic conditions, hence the mesophilic condition was chosen for VDI 4630. Two different inocula were used, mesophilic inoculum from Fangel biogas plant for the VDI and Moller methods, and thermophilic inoculum from Linko biogas plant for the Hansen method. The average pH, total ammoniacal nitrogen (TAN = NH3+NH4+), DM and VS content of the mesophilic inoculum obtained was 8.01, 3.29g/kg, 3.98% (of total mass) and 63.9% (of DM), respectively. The pH of the thermophilic inoculum was 7.92, TAN 2.64 g/kg, DM 4.60% (of total mass) and VS 64.4% (of DM).
Prior to the BMP test, biochemical and physiochemical analyses of the pig manure and cow manure were carried out (Table 2). DM, VS, crude lipid, total ammoniacal nitrogen (TAN = NH3+NH4+) and total Kjeldahl nitrogen (TKN) were determined according to standard procedures (APHA, 2005). “The protein content was determined by multiplying the difference between TAN, and TKN with factor 6.25” (Triolo et al., 2011).
Volatile fatty acids (VFA) were determined according to the method of Lahav et al. (2002) Ash-free acid detergent lignin (ADL) was determined by acid detergent extraction, as described in ISO Standard 13906 (ISO13906, 2009).
BMP assays:
Each of the three methods was monitored by triplicate measurements of gas production from each of the substrates (pig manure, cow manure and cellulose). Twelve 1-litre digester glass bottles (reactors) were used for each of the batch fermentation tests.
VDI 4630:
The preparations for fermentation were carried out according to VDI 4630 (VDI, 2006). A test medium was prepared to ensure sufficient nutrients for bacterial growth and standard pH buffer capacity following the recommendations of VDI 4630 and ISO Standard 11734 (ISO11734, 1995). The composition of the medium used was as follows: anhydrous potassium dihydrogen phosphate (KH2PO4) 0.27 g; disodium hydrogen phosphate dodecahydrate (Na2HPO4·12H2O) 1.12 g; ammonium chloride (NH4Cl) 0.53 g; calcium chloride dihydrate (CaCl2·2H2O) 0.075 g; magnesium chloride hexahydrate (MgCl2·6H2O) 0.10 g; iron (II) chloride tetrahydrate (FeCl2·4H2O) 0.02 g; sodium sulphide nonahydrate (Na2S·9H2O) 0.1 g. The constituents were added to 1 liter distilled water containing less than 1 mg/L dissolved oxygen. The test medium prepared was flushed with nitrogen before the batch test to remove oxygen, and then 150 ml of the prepared test medium were added to reactors. The inoculum was degassed for two weeks. The inoculum and substrate (i.e. manure and test substrate) were added at a ratio of 2:1 (VS basis), allowing the volume of mixture of inoculum and substrate to be 620 ml. Three reactors containing 620 ml inoculum were used to measure gas production from the inoculum.
Moller method:
The preparations of fermentation were carried out according to Møller et al. (2004). The same inoculum as used for VDI 4630 was applied. The difference between the Moller and VDI methods is in the I:SR and buffer solution. The inoculum and substrate was added at a ratio of 1:1 (VS basis) and buffer solution was not added. The reactors were each filled with 770 ml inoculum, which was gently homogenised.
Hansen method:
The preparations for fermentation were carried out according to Hansen et al. (2004). Thermophilic inoculum was degassed for 3 days at 55°C prior to the batch test. Then 50 ml of each pig and cow manure sample were mixed with 200 ml inoculum and the mixture was homogenised by mixing carefully. Buffer solution was not added.
After mixing substrates with inoculum according to three different methods, all reactors were closed carefully with butyl rubber bungs. The headspace of all reactors was flushed with nitrogen gas to ensure anaerobic conditions. The reactors were placed in a climate chamber at 37°C for the Moller method and at 55°C for the Hansen method, and in a thermostat-controlled water bath at 37°C for the VDI method.
In the Moller and Hansen methods, the volume of biogas was measured using a 1,000-ml syringe (Hamilton Super Syringe) supplied with a tube with a needle at the open end. Gas volume produced using the VDI method was measured by continuous connection to a liquid replacement system (CLRS). For all three methods, the gas yield was measured daily during the first week of incubation, every 2 or 3 d in the second week, and then weekly or every 2 weeks during the following incubation period. Incubation was stopped when the gas production rate was less than 1% of the accumulated gas produced.
The methane concentration in the collected biogas was measured weekly over the whole experimental period for all three methods. The gas samples were stored in 10-ml vials with butyl bungs, which were filled by flushing gas through the vial using a 1,000-ml syringe. The CH4 and CO2 concentrations were measured using a gas chromatograph (HP 6890 series) equipped with a thermal conductivity detector (TCD) and a 30 m×0.32 mm column (J&W 113-4332). The carrier gas was helium (30 cm/s). Injector temperature was 110°C, and detector and oven temperature was 250°C. Injection volume was 0.4 ml and the split rate was 1:100.
Methods to measure volume of biogas produced
Three techniques were used to measure the biogas produced. For each technique, the VDI batch fermentation method was used to ferment pig manure, cow manure, cellulose and inoculum samples in triplicate. The measurements of biogas produced were carried out using a syringe, the liquid replacement system used intermittently (LRS), and a liquid replacement system continuously connected to the reactors (CLRS).
Intermittent measurements with syringe:
Biogas volume was measured using a 1,000-ml syringe. The syringe was connected to the reactors by injecting the needle through the butyl bung, then drawing the plunger out until the pressure in the headspace dropped to ambient pressure. The volume of gas in the syringe was taken as a measurement of the gas produced.
Intermittent measurements with liquid replacement system (LRS):
Biogas volume was measured using a LRS, which was connected to the reactors with a needle for each measurement time. The volume of gas produced was measured by replacing liquid, i.e. the headspace of the batch fermentation flask was connected to a cylindrical flask filled with the liquid and with the opening connected with a hanging tube to a container of the same liquid; the biogas produced flowed from the headspace up into the cylindrical flask and replaced the liquid. The hanging tube prevented the gas from flowing from the cylindrical measuring flask to the liquid container. The volume of gas was taken as the volume of released water. LRS was connected to reactors at the same time intervals as when measuring biogas volume production using a syringe.
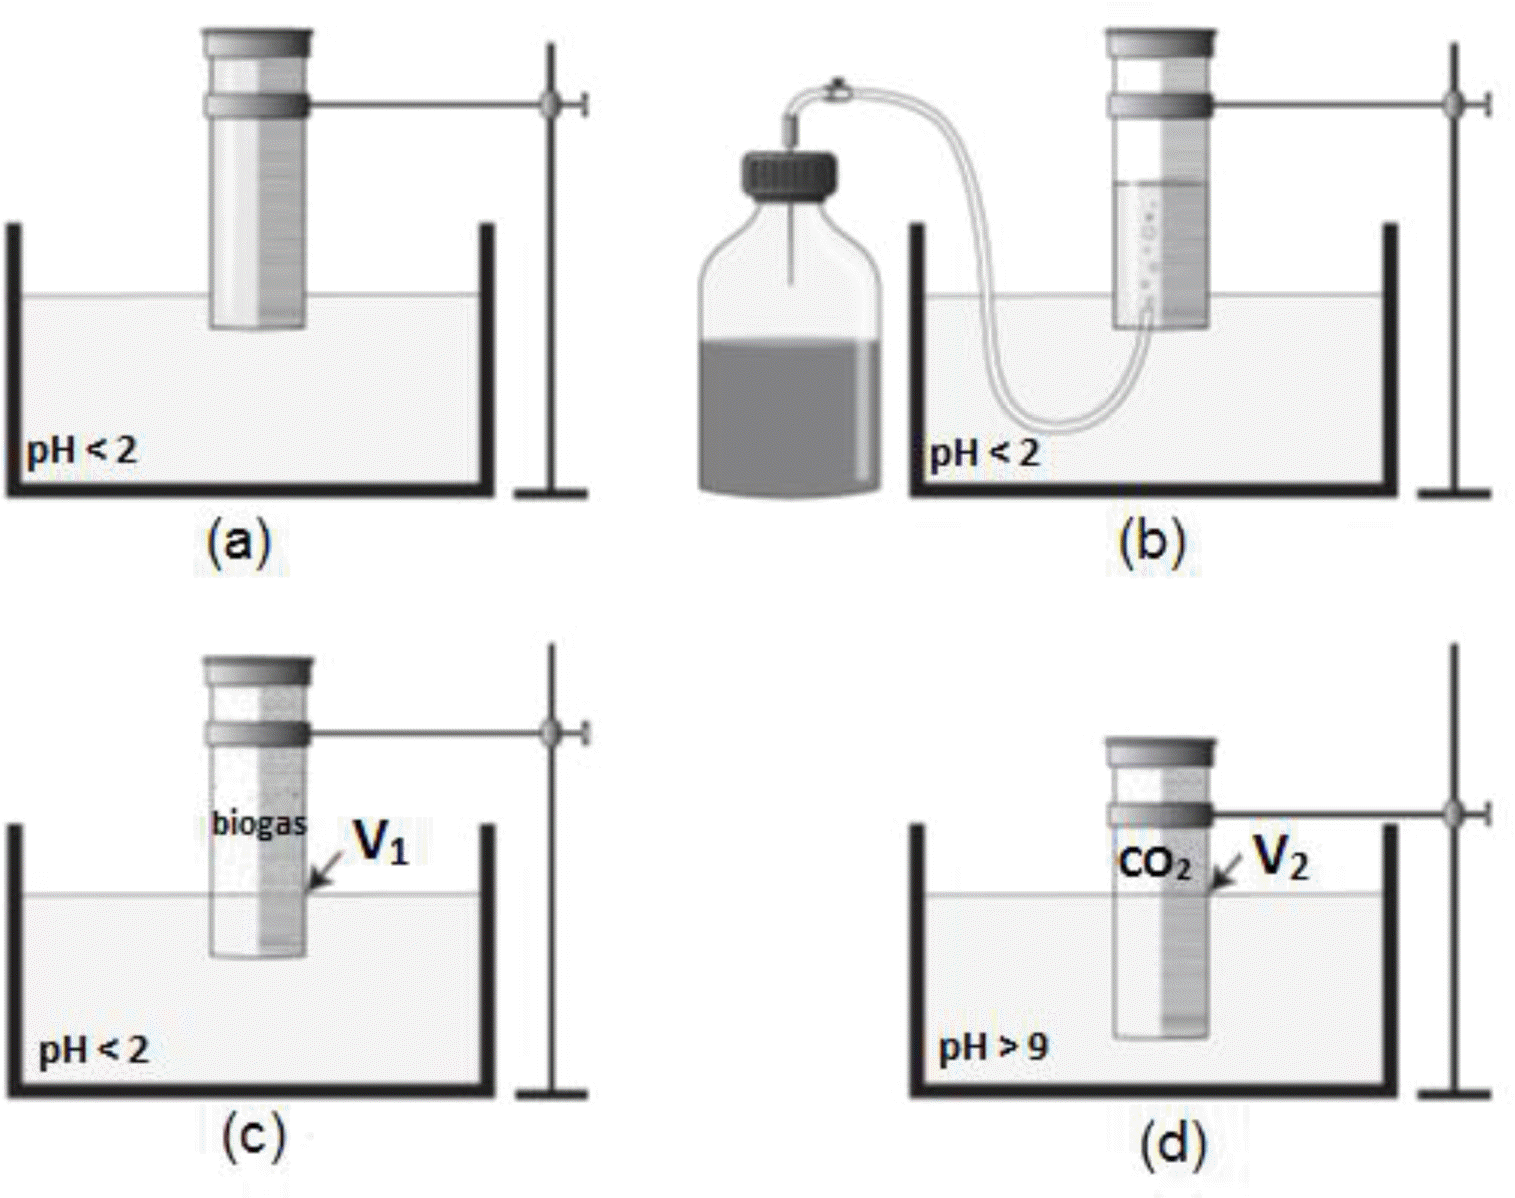
Wet chemistry CH4 measuring method
The concentration of CH4 in biogas was often measured by absorbing CO2 in an alkaline liquid (Guwy, 2004; Rozzi and Remigi, 2004; Raposo et al., 2011). A cylindrical flask was filled with liquid and placed with the opening in the same liquid in a container (Figure 1), so that the flask remains full of liquid. To the inside of the cylindrical flask was attached a tube closed with a clamp and with a syringe at the other end. The syringe was injected through the butyl bung of the reactor, the clamp was opened, and the gas produced flows into the cylindrical flask and replaces the liquid. The amount of liquid replaced corresponds to the volume of gas produced. If the liquid was acid, the volume of biogas produced was measured, while if the liquid was basic, the CH4 production was measured.
In the test, a 50-ml graduated measuring cylinder and a 1liter container were used, as described above. About 700 ml 0.5 M hydrochloric acid (HCl) were used to fill the cylinder and added to the container. On injecting the needle into the bung of a reactor, biogas bubbles through the liquid and fills the cylinder, replacing the liquid, and the gas volume can then be read (V1, ml). Thereafter, KOH was added to increase pH to above 9 and to absorb CO2 and H2S. This absorption reduces the volume of gas in the measuring cylinder (V2, ml). The volume V2 was an estimate of CH4 in the gas; the difference between initial and final volume corresponds to the CO2 content in the biogas, i.e. H2S concentration wa taken as negligible compared with CO2 concentration.
Statistical analysis
Data were evaluated using analysis of variance (ANOVA) followed by the Ryan-Einot-Gabriel-Welsch multiple-range test where appropriate (SAS 9.2 TS Level 2M0). In all cases, a significance level of α = 0.05 was used. When necessary, data were transformed to obtain normality and homogeneity of variances.
Calculating the methane potential in terms of standard temperature and pressure (STP):
The ultimate methane and biogas production in terms of standard temperature and pressure (STP) (eq. 1), litres of CH4 and biogas per kg organic matter expressed as volatile solids (VS) were presented in Table 3:
where V0dr was the volume of the dry gas in the normal state (NL); V was the volume of the gas as read off (ml); P was the pressure of the gas phase at the time of reading (hPa); Pw was the vapour pressure of the water as a function of the temperature of the ambient space (hPa); T0 was normal temperature (= 273°K), p0 was normal pressure (= 1,013 hPa), and T was the temperature of the fermentation gas or of the ambient space (°K).
Biodegradability and the rate of methane production:
Anaerobic biodegradability can be determined by comparing the ratio of BMP obtained to theoretical BMP (TBMP) ((BMP/TBMP)·100(%)) (Triolo et al., 2011; Triolo et al., 2012). In the present study, TBMP was determined according to Triolo et al. (2011) as:
with TBMP as CH4 NL (kg VS)−1, and lipid, protein, carbohydrate and lignin as g (kg VS)−1.
The coefficients in equation (2) were unit methane formations derived from Buswell’s anaerobic degradation equation (Symons and Buswell, 1933) for each organic compound, using an average formula. The empirical formula of lignin was C10H13O3 according to Triolo et al. (2011).
Anaerobic degradation rate of each BMP method was compared, employing a nonlinear regression test using Sigma Plot 5 (GraphPad Software, USA). Cumulative methane production curves were fitted to the first-order kinetic model and first-order kinetic constants (k) were obtained, assuming hydrolysis to be the rate-limiting step (eq. 3):
where Bt (CH4 NL (kg VS)−1) was the cumulative methane yield at time t, B0 (CH4 NL (kg VS)−1) was the maximum value of BMP, k (d−1) was the first-order kinetic constant, and t was the time (days).
Evaluation of precision:
A method for assessing the detection limit, repeatability and reproducibility of biogas measurements has been developed by Hansen et al. (2004). This method can be used by researchers who have access to Excel data treatment programs.
Repeatability:
The repeatability and reproducibility of the batch fermentation methods can be determined using the series of triplicate measurements of the methane potential of cellulose, which was the biomass at its most homogeneous, i.e. biomass characteristics do not contribute to variation in measurements. The repeatability (r) was defined as ‘the uncertainty of repeated measurements of the same sample within the same analytical series’ (ISO5725-2, 1994; Hansen et al., 2004). The repeatability of two measurements of one sample was (eq. 4):
where sr was the standard deviation of the average of the cellulose measurements from the series of measurements carried out using a specific method. This repeatability represents the interval ±r1, where two measurements of the same sample are similar.
The repeatability r2 of three samples is (eq. 5):
Reproducibility:
The reproducibility of the measurements can also be estimated using the standard deviation sR of the measured gas production between series of measurements of biogas production from fermentation of cellulose. Hansen et al. (2004) recommend the use of the ISO 5725 formula (ISO5725-2, 1994):
where R was the reproducibility, which reflects variation in measurements due to differences caused by the data coming from measurements not being carried out in the same series (period), adding effects such as variation in inoculum, variation in environment (e.g. incubators performing slightly differently between series) and effects of management. The R value indicates the interval where two average values from two series are equal.
In the present study, the precision of BMP results was estimated by employing the repeatability relative standard deviation (RSDr) and reproducibility relative standard deviation (RSDR) according to the practical guide for ISO 2005 (ISO/TR22971ISO/TR22005).
RSDr was calculated using equation (7):
Where ō was the mean of triplicate values and SDr was repeatability standard deviation from triplicate results.
RSDR was calculated using equation (8):
where ō was the overall mean and SDR was reproducibility standard deviation between triplicates from the different groups.
RESULTS AND DISCUSSION
BMP results using different fermentation protocols
The results for BMP showed large variations depending on the procedure used (Table 3). These large differences in BMP measured by different procedures are in agreement with Raposo et al. (2011), who reported that the relative reproducibility standard deviation of BMP measured by different laboratories was large, ranging from 15 to 34% with outliers, and from 8% to 11% excluding outliers.
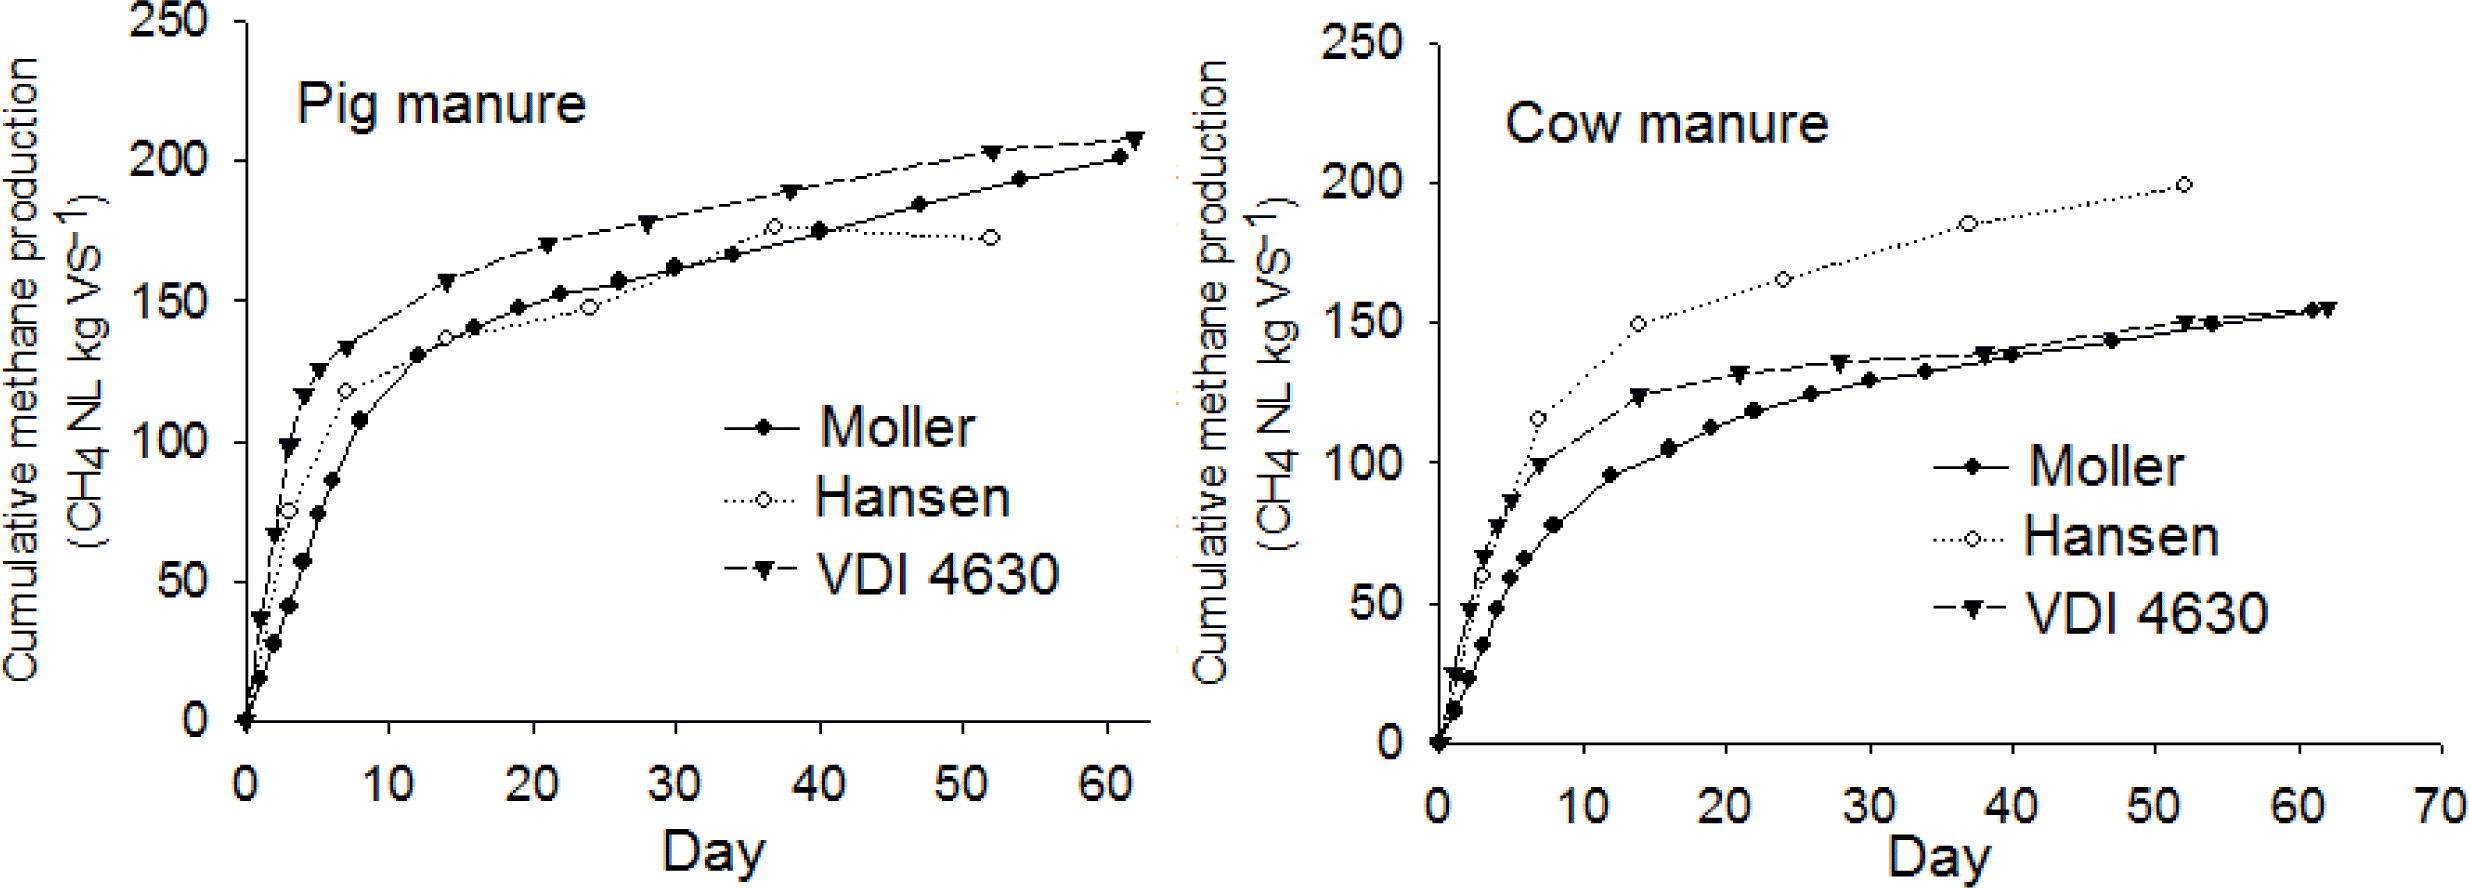
Overall results of cumulative methane production of pig manure and dairy cow manure using three different batch fermentation techniques were present in Figure 2, where they fit very well to the first-order kinetic curves as can be seen in Figure 3.
The BMP (CH4 NL kg−1 VS) of pig manure, cow manure and cellulose determined with the Moller and VDI methods was not significantly different in this test (p>0.05) (Table 3). However, the CH4 production from cow manure and cellulose measured with the Hansen method differed significantly from the Moller or VDI methods. All methods gave similar estimates of biogas production from pig manure. The BMP measured with the Hansen method was higher for cow manure and lower for cellulose than estimates using the VDI or Moller methods.
Some recent studies have indicated that high-temperature incubation increases gas production from organic matter with a high concentration of slowly digestible organic matter (Alvarez and Lidén, 2008; Ferrer et al., 2008). Thus the results obtained here with the Hansen method can be expected, as the cow manure with its higher concentration of slowly digestible organic material produced more gas than the two other substrates. The low gas production from pig manure measured with the Hansen method was probably due to NH3 inhibition, as can be seen in Table 3. Similarly, Angelidaki and Ahring (1994) reported increasing NH3 inhibition at increasing temperature. Hence, it was often the case that biogas digesters fed with pig manure are run at mesophilic temperatures (35 to 37°C).
Precision:
The precision of the batch methods tested was evaluated employing RSDr, RSDR and the ratio between BMP and TBMP, using cellulose as the standard substrate (Table 4). RSDr for all the batch methods was very low (4.8 to 8.1%). On the other hand, RSDR showed large variation, ranging from 7.3 to 19.8%. Nevertheless, BMP/TBMP was close to 0.90 using the Moller and VDI methods. Thus a fraction of the VS is not transformed into biogas, due to the use of carbon for growth of the microorganisms. VDI 4630 (VDI, 2006) states that BMP/TBMP must reach at least 80% in control batches. BMP/TBMP was only 0.61 in the Hansen method and this together with a very low RSDR shows that the BMP obtained was consistently low. The low BMP of cellulose results obtained using the Hansen method could have been caused by a large amount of gas production at the start of the fermentation period. This gas production results in high pressure in the headspace of the batch reactors at high temperature and with active inoculums, as rising pressure creates a back-pressure resulting in higher gas losses (VDI, 2006). Such gas production probably occurred for complex reasons, including the thermophilic conditions; gas production from the inoculum being subjected to only 3 days of degassing; and fast degradation of cellulose.
Biodegradability and degradation rate:
The biodegradability according to BMP/TBMP ratio was slightly higher using the Hansen method, but there was no clear difference between methods. The values obtained were 34.2 (±1.14)% for the Hansen method, 32.9 (±7.9)% for the Moller method and 33.8 (±9.1)% for the VDI method. On the other hand, biodegradability clearly varied within the two manures tested, being 37.4 (±3.5)% for pig manure to 29.9 (±4.4)% for cow manure.
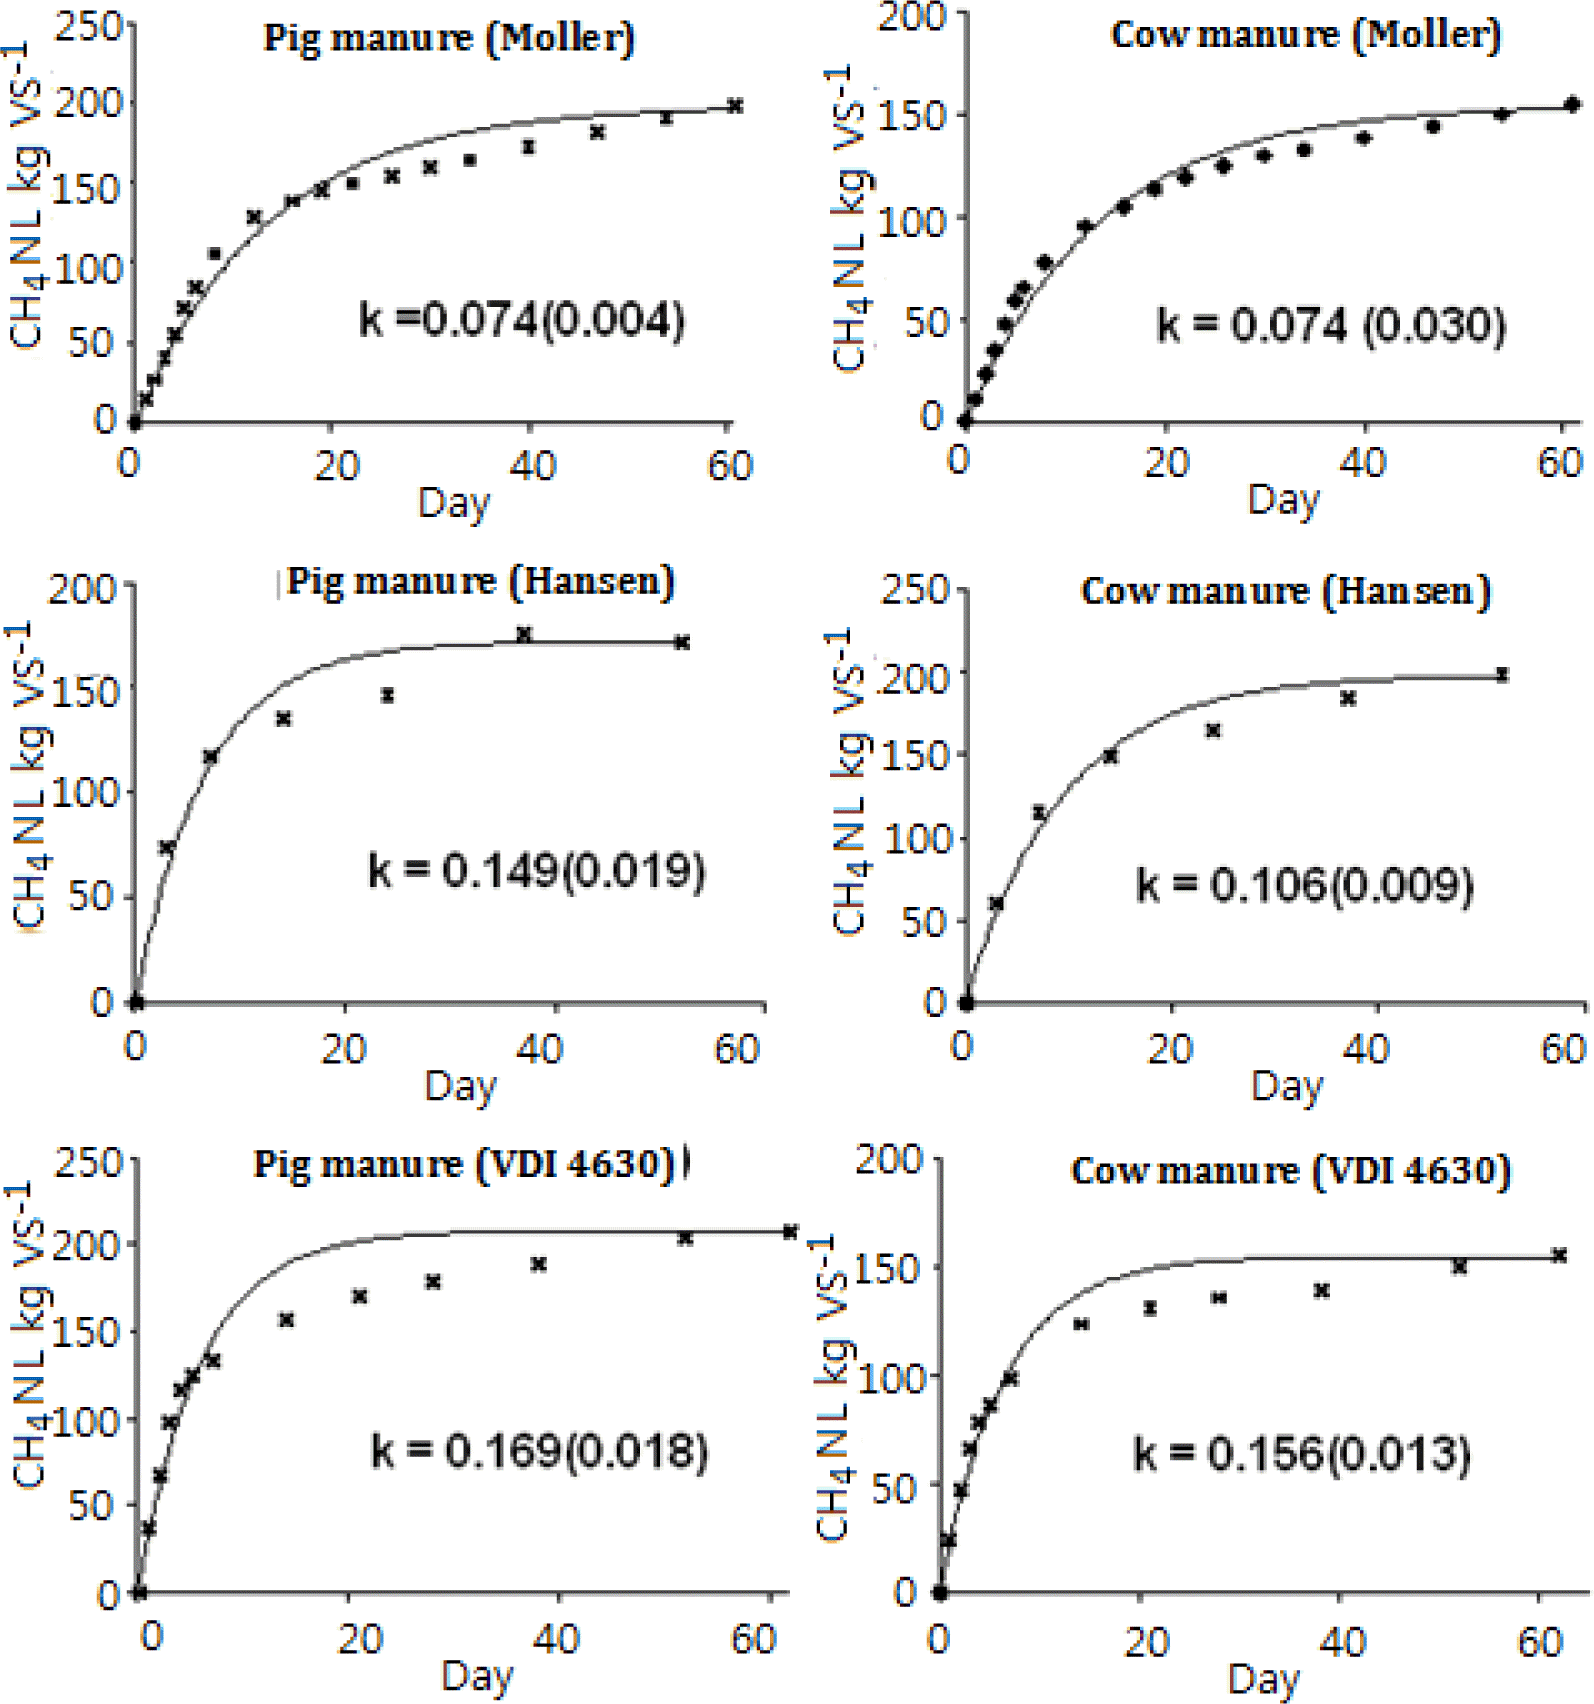
Degradation rate assessed by methane formation rate showed wide variation between the three batch methods. The curve of cumulative methane production of pig and cow manure using each batch method and the best fitted first-order kinetic curves are presented in Figure 3. As can be seen from the diagram, the curve of cumulative methane production using the Moller method fitted the first-order kinetic curves best. However, all cumulative methane production curves also showed good agreement with first-order kinetic curves for the Hansen and VDI methods. The coefficient of determination (R2) between the cumulative methane production curve and first-order kinetic curves was highest for the Moller method, i.e. 0.9713 for pig manure and 0.9827 for cow manure. For the Hansen method, the values obtained were similar, 0.9654 for pig manure and 0.9815 for cow manure, while for the VDI method, R2 was comparatively low, 0.9256 for pig manure and 0.9591 for cow manure. There was a tendency for cow manure to have slightly higher R2. The results may indicate that hydrolysis was the dominant rate-limiting step for the degradation of cow manure, while the lower R2 of pig manure shows that the methanogenesis from a high content of hydrolyzed components, i.e. VFA, could be the dominant and rate-limiting step at the beginning of the fermentation procedure.
The first-order kinetic constant k was highest when the two animal manures were fermented using the VDI method, showing rapid degradation of substrate. The results indicate that the VDI method reached steady conditions in a shorter time, reducing the fermentation duration. The reason for the higher degradation rate with the VDI method is probably the higher I:SR, giving a kinetic advantage due to a larger bacterial population within the substrate (Raposo et al., 2006). This study showed that increasing I:SR to some extent has a positive influence on shortening duration of the fermentation. Thus, the medium added as buffer solution for the VDI method could accelerate microbial activity, resulting in increased degradation rate.
Surprisingly, the Hansen method had a slightly lower k value than the VDI method, even though thermophilic conditions provide a kinetic advantage for the degradation rate. This could be because the degassing period of 3 days was short, allowing considerably higher methane potential for the inoculum itself, which consequently delayed degradation of the substrate.
Comparison of biogas volume determination with three different measurement techniques
CLRS and syringe extraction were two widely used methods for measuring biogas volume in different studies related to biogas research (Abu-Dahrieh et al., 2011), but LRS was used for this purpose the first time in the present study.
The differences in gas volumes obtained using these three different measurement techniques were much less than the differences caused by different fermentation procedures and gas measurement techniques (Figure 4). Nevertheless, LRS showed a tendency for higher gas volume measurements than the syringe and CLRS methods. The reason could be that the syringe plunger was not withdrawn far enough to get the total production in each test and left a higher pressure in the headspace. The CLRS method is more subject to small leaks in the set-up, as the biogas is contained not only in the digester but also through the whole water replacement system.
Test of gas concentration measuring techniques:
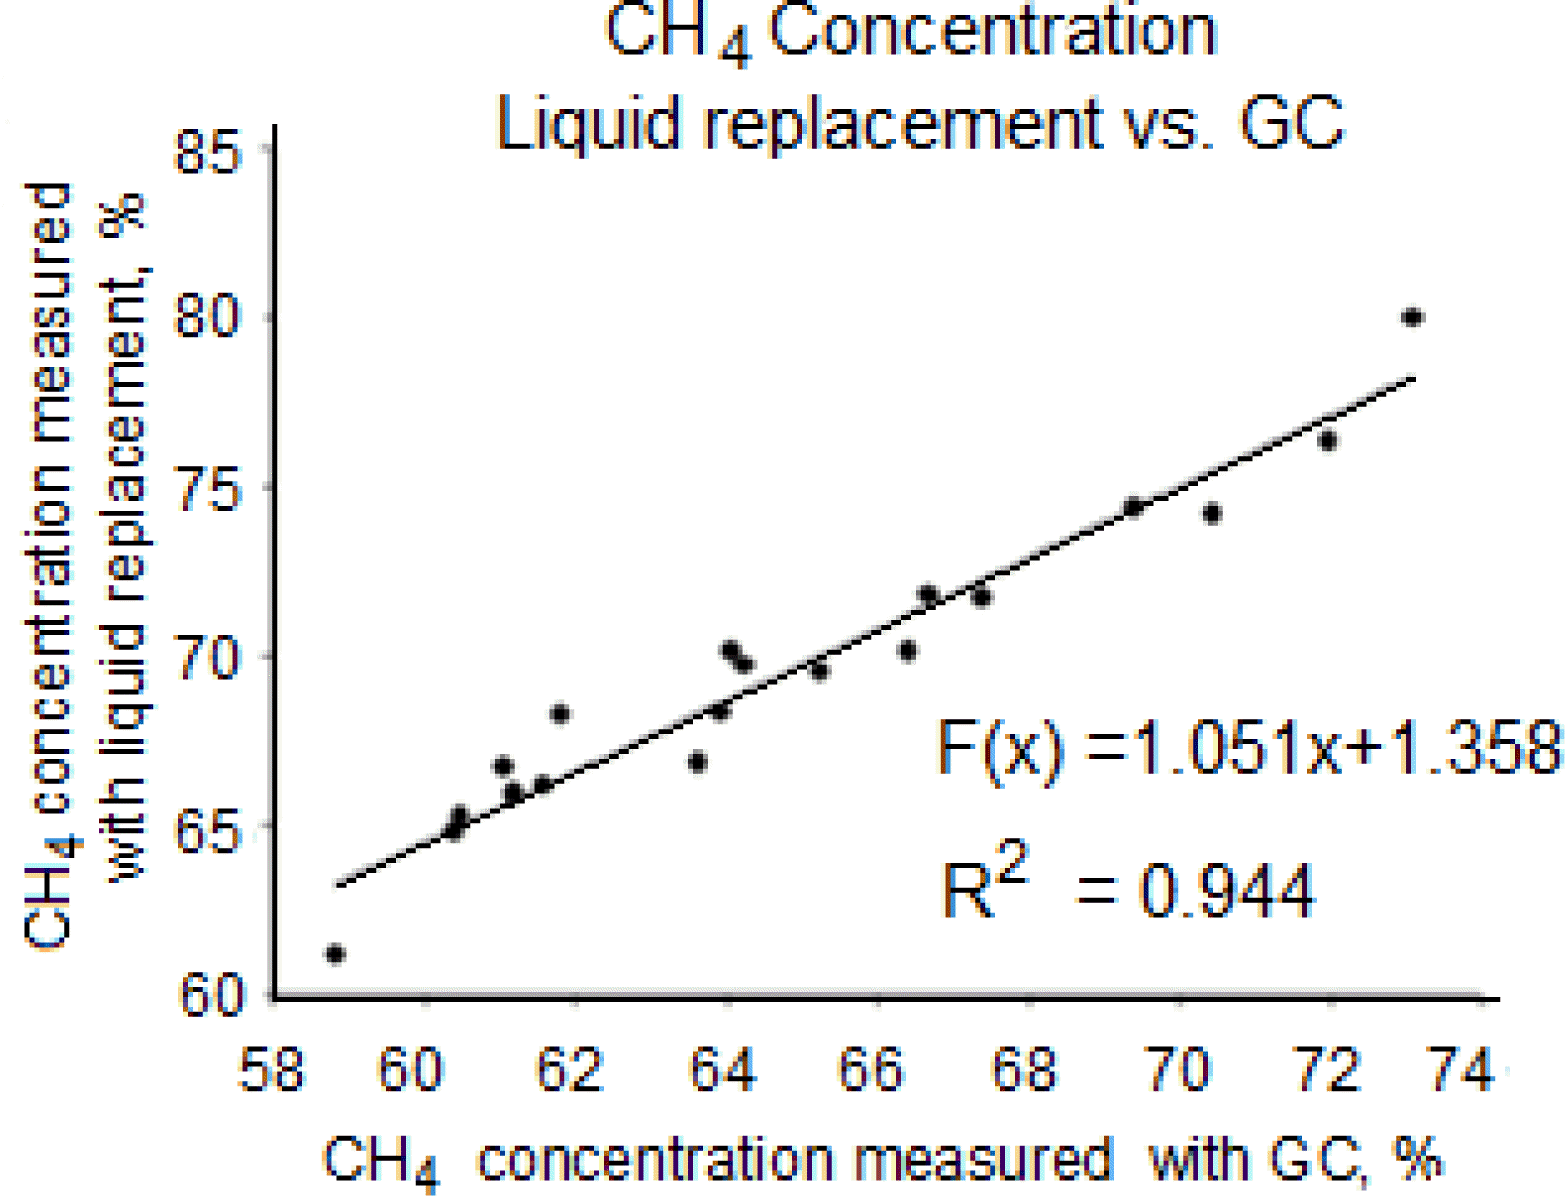
Most researchers measure CH4 concentration in biogas by GC, which is precise at the concentration levels in the gas (Shahriari et al., 2012). Alternatively, CH4 concentration can be determined by the liquid replacement method (Demirer et al., 2000), whereby the biogas volume produced is determined by replacement of an acid liquid, then a base was added to the liquid and CO2 is absorbed in the liquid. This wet chemistry method can be used in all laboratories where scientists have access to acids and bases and was simple and cheap compared with the GC method. Therefore, the accuracy of the method was tested here. The results showed that if raw data from the liquid replacement method (LRM) were used when comparing the methods, then the CH4 concentration (%) measured with LRM was linearly related to that measured with GC (Figure 4).
This was the case for measurements of CH4 gas production from each substrate and of pooled estimates. There are gases other than CH4 and CO2 in the biogas, i.e. H2O, NH3, H2S and NO2 (VDI, 2006; Chen et al., 2008). H2S will also be absorbed in the basic liquid and, of the remaining gases, H2O was without doubt the most abundant. By assessing the water gas concentration of the gas, the CH4 determined was slightly higher using the LRM method (68.00%) than the GC method (64.94%). Standard deviation and relative standard deviation between the two methods were 3.15% and 4.70%, respectively, showing that the differences were not very great. Nevertheless, there was a tendency for higher CH4 concentrations to be measured when using LRM than when using GC. This could be due to a low amount of CO2 (less than 5%) not being dissolved in the base liquid. In addition, trace gases such as NH3 and N2O could affect the results to some extent. However, the very low differences when using LRM indicate that in laboratories with limited access to expensive equipment such as GC, the simple, cheap and affordable LRM method could be used to measure biogas content.
CONCLUSIONS
Biodegradability was slightly higher using the Hansen method, but the differences were not significant. The higher degradation rate combined with no apparent system instability of the VDI method suggests that it could be the most suitable batch method to determine the BMP for pig slurry, with the shortest fermentation duration. However, the Hansen method could be preferable for determining the BMP of cow slurry, which contain highly resistant organic compounds and a little TAN. With regard to determination of biomethane concentrations, the LRM method differed only slightly from GC and could thus be used to determine biomethane concentrations in biogas in laboratories with limited access to GC.
 PDF Links
 PubReader
 ePub Link
 Full text via DOI
 Full text via PMC
 Download Citation
 Print
Print


