Nitrogen-corrected True Metabolizable Energy and Amino Acid Digestibility of Chinese Corn Distillers Dried Grains with Solubles in Adult Cecectomized Roosters
Article information
Abstract
This study was conducted to evaluate chemical composition, nitrogen-corrected true metabolizable energy (TMEn) and true amino acids digestibility of corn distillers dried grains with solubles (DDGS) produced in China. Twenty five sources of corn DDGS was collected from 8 provinces of China. A precision-fed rooster assay was used to determine TMEn and amino acids digestibility with 35 adult cecectomized roosters, in which each DDGS sample was tube fed (30 g). The average content of ash, crude protein, total amino acid, ether extract, crude fiber and neutral detergent fiber were 4.81, 27.91, 22.51, 15.22, 6.35 and 37.58%, respectively. TMEn of DDGS ranged from 1,779 to 3,071 kcal/kg and averaged 2,517 kcal/kg. Coefficient of variation for non-amino acid crude protein, ether extract, crude fiber and TMEn were 55.0, 15.7, 15.9 and 17.1%, respectively. The average true amino acid digestibility was 77.32%. Stepwise regression analysis obtained the following equation: TMEn, kcal/kg = −2,995.6+0.88×gross energy+49.63×a* (BIC = 248.8; RMSE = 190.8; p<0.01). Removing gross energy from the model obtained the following equation: TMEn, kcal/kg = 57.88×ether extracts+87.62×a* (BIC = 254.3, RMSE = 223.5; p<0.01). No correlation was found between color scores and lysine true digestibility (p>0.05). These results suggest that corn DDGS produced in China has a large variation in chemical composition, and gross energy and a* value can be used to generate TMEn predict equation.
INTRODUCTION
Distillers dried grains with solubles (DDGS) has been commonly used as an ingredient in poultry diets for many decades. A recent study indicated that diets containing up to 24% DDGS had no adverse effect on performance of broilers (Shim et al., 2011). However, large variability of DDGS composition and poor protein quality may ultimately limit its utilization in poultry diets (Cromwell et al., 1993; Fastinger et al., 2006). Many studies were conducted to develop some useful parameters (i.e. color scores or chemical composition) to predict amino acid digestibility and nitrogen-corrected true metabolizable energy (TMEn) of DDGS (Batal and Dale, 2006; Fastinger et al., 2006). Color score was found to be a fast method to determine corn DDGS quality (Ergul et al., 2003). A previous study has found that lighter colored DDGS had a greater concentration of bioavailable lysine (Pahm et al., 2009). In addition, some regression equations have been established to predict energy utilization based on chemical composition for poultry. Several equations were established to estimate the TMEn based on proximate composition, however, the accuracy of the prediction equation was low (Batal and Dale, 2006). And the color scores included in the model also improved the equation for wheat DDGS (Cozannet et al., 2010).
Unlike commercial databases, China DDGS nutrient data were always reported as the average value of many samples and lacked of proper prediction methods. This results in some misleading conception in using DDGS in poultry diets. The objective of this study was to determine the chemical composition and amino acids (AA) digestibility of Chinese corn DDGS and their correlation with color scores. The second objective was to establish a TMEn predicting equation for cecectomized roosters based on chemical composition and color scores.
MATERIAL AND METHODS
Samples, animals and experimental design
All procedures used in this study were approved by the Animal Care Committee of Northwest A&F University.
Twenty five corn DDGS samples (1 to 2 kg per sample) were collected from 8 provinces of China. Samples were ground through a 1 mm screen and stored at −20°C for further analysis. Thirty-five roosters were cecectomized according to the procedures described as Parsons (1985) at the age of 45 wk. After 1 month recovery, the roosters were randomly divided into 7 groups, 5 birds per group with similar body weight. Roosters were individually housed in stainless cages.
An experiment with 6 periods was used to determine TMEn and true digestible amino acid (TDAA) of DDGS. From periods 1 to period 3, seven DDGS samples were randomly assigned to each group with 5 replicates (1 bird per replicate). The other four samples were studied in period 4 with 5 replicates (1 bird per replicate) per group. In each period, birds were given 50 ml of 60% glucose solution after a 24 h fast. After a further 24 h, each bird was accurately tube fed 30 g of DDGS. All excreta were collected for the subsequent 48 h. Excreta samples were weighted, 10% HCl (1 ml/10 g excreta) added and stored at −20°C. After sample collection, all birds were fed a conventional corn-soybean meal diet for approximately 10 to 14 d to recovery body condition and randomly assigned to each group based on similar body weight before next period. Another 2 periods were used to estimate individual bird endogenous AA and energy losses. All roosters were fasted for 24 h and then perfused with a glucose solution. The excreta were collected for 48 h as described.
Samples analyses
Color scores including degree of lightness (L*), redness (a*), and yellowness (b*) for the DDGS samples were measured using a color-difference meter (WSC-S, Shanghaishenguang Co., Ltd., Shanghai, China). Samples were held tight and flat in the test container. Reported color scores were the mean of 5 measurements, with the sample being re-mixed and leveled between each determination. Low values for L* indicated a dark color; whereas higher scores indicated a light color (0 = black; 100 = white). Higher values of a* and b* indicated greater degrees of redness and yellowness, respectively.
All samples were analyzed for proximate composition DM, CP, ether extracts (EE), crude fiber (CF), ash and acid detergent fiber (ADF) by the method of AOAC (2006). Neutral detergent fiber (NDF) was determined according to Van Soest et al. (1991). Amino acid in DDGS samples and excreta were determined using an amino acid analyzer (Model 121MB, Beckman Coulter, Inc., Fullerton, CA, USA) with the method outlined by AOAC methods 994.12 (sulfur and regular). Gross energy (GE) was analyzed using an adiabatic oxygen bomb calorimeter (Model 6300, Parr Instruments, Moline, IL, USA). Reported values were expressed as the average of duplicate sample.
Calculations
True digestibility of AA (TDAA) using the following equation:
TMEn was calculated according to the procedure outlined by Farhat et al. (1998).
Statistical analysis
Coefficient of variation (CV) was calculated among all DDGS samples. Pearson’s correlation analysis was performed to establish the relationship between chemical compositions and color score (using PROC Corr; SAS Institute Inc., Cary, NC, 2003). Significance was declared at p<0.05.
Outliers were determined when the values (ratio of TMEn to GE) were more than 2 SD above or below the mean. Two samples were removed from the data set. The regression analysis was performed by the new database. Prediction equations of TMEn with individual proximate compositions and color scores were established by regression analysis with stepwise method (using PROC Reg of SAS). The best fit equations were defined by Root MSE, Mallows statistic C(p) and BIC. If the intercept was not significant (p>0.15) in the equation, it was removed from the model and the R2 was calculated using the NOINT option of SAS.
RESULTS
Nutrient composition and color score
Nutrient composition and color scores of 25 DDGS samples are presented in Table 1. The GE ranged from 4,215 to 5,147 kcal/kg and average 4,642 kcal/kg. Data of TMEn ranged from 1,172 to 2,782 kcal/kg and 17.1% of CV. Among all proximate compositions, ADF had the highest variation (CV = 23.5%), and DM had the lowest variation (CV = 2.2%). CV for the other nutrients ranged from 4.9% to 15.9%. EE content ranged from 9.80 to 19.40% and averaged 15.22%. Values of NAACP between 0.14 and 11.82% and 55.0% of CV. CV for L*, a* and b* were 12.5%, 9.1% and 13.3%, respectively.

Nutrient composition and color scores of corn distillers dried grains with solubles (as-fed bases, n = 25)
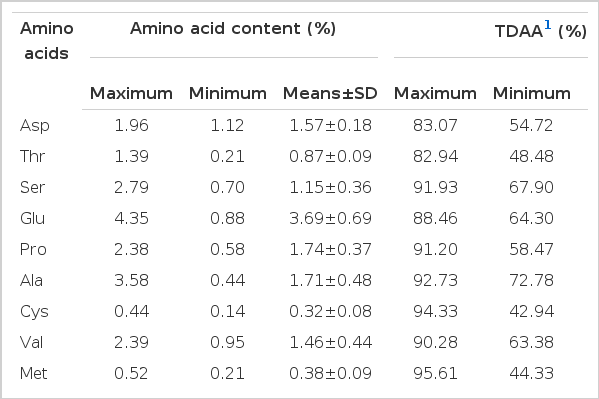
Among all DDGS sources (Table 2), glutamic acid was the highest (3.69%), followed by leucine (2.26%), proline (1.74%) and alanine (1.71%), while cystine concentration was the lowest (0.32%). The highest TDAA was arginine (86.79%), followed by alanine (83.88%) and leucine (83.47%). True digestible methionine and lysine were 75.28% and 80.86%, respectively.
Correlation between variables
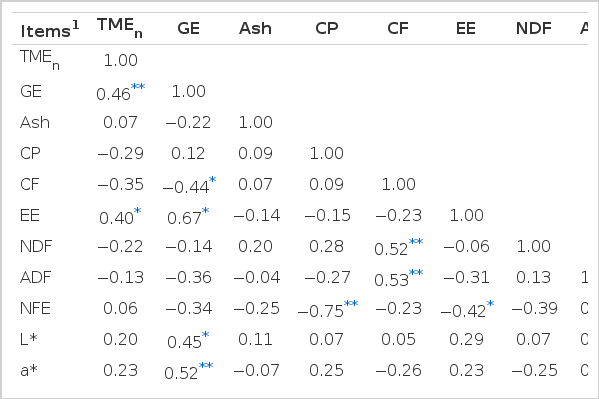
Pearson’s correlation coefficients among nutrient composition and color scores (Table 3) demonstrated that TMEn was positively correlated with GE and EE (p<0.05) and negatively correlated with CF (p<0.01). GE was (p<0.05) positively correlated with EE and color scores. There were no significant (p>0.10) correlations of color scores with ash, CP, CF, NDF, ADF and NFE. Ether extract was positively correlated with b* value (p<0.05) and negatively (p<0.05) correlated with NFE.

Correlation matrix of TMEn with nutrient composition and color scores of corn distillers dried grains with solubles (DM basis, n = 25)
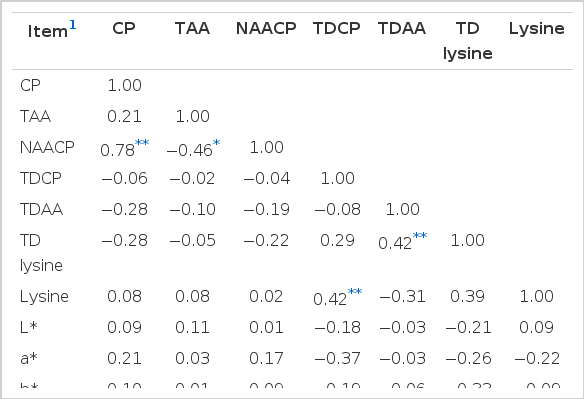
Correlation relationship of crude protein and amino acid digestibility parameters with color scores are presented in Table 4. NAACP was positively correlated with CP and negatively correlated with TAA (p<0.05).
Prediction equations
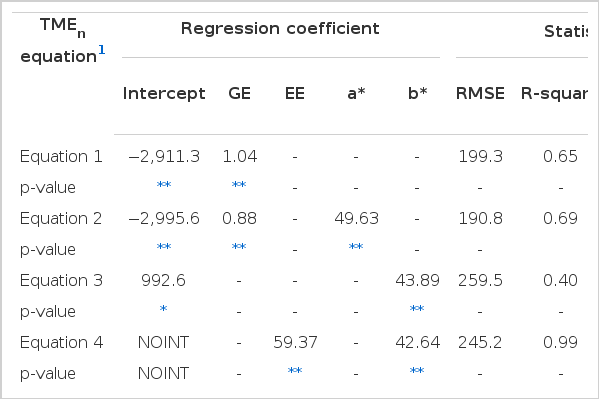
Stepwise selection method was used to estimate the GE, chemical composition and color score that contributed to the predictors of TMEn of 23 DDGS samples (Table 5). GE was the first independent variable included in the model in equation 1 (R2 = 0.65; BIC = 249.3; RMSE = 199.3). The model was improved with the addition a* in equation 2 with a R2 of 0.69. And the best fit equation was: TMEn, kcal/kg = −2,995.6+0.88×GE+49.63×a* (R2 = 0.69; BIC = 248.8; RMSE = 190.8) at DM bases. After removing GE from the model, the best single factor to predict TMEn was b* value (equation 3; RMSE = 259.5), followed by EE and a*. When a* was included in the model, b* was discarded (p = 0.69). In this condition, the best fit model was: TMEn, kcal/kg = 57.88×EE+87.62×a* (BIC = 254.3, RMSE = 223.5) at DM bases.
DISCUSSION
In general, excepting DM and GE, nutrient composition in the 25 sources of DDGS produced in China had considerable differences in the reported data. The average concentration of DM, CP, CF and ADF of DDGS in the present study are in agreement with the published values (Batal and Dale, 2006; Pedersen et al., 2007; Waldroup et al., 2007), while content of ash and NDF are higher than the results reported by Pedersen (2007), but similar with the results of Stein et al. (2006) (n = 10, NDF = 40.1%). Values of EE are higher than the values (9.00, 9.69 and 9.88%, respectively) reported by NRC (1994), Spiehs et al. (2002) and Fiene et al. (2006), respectively, but similar to the results reported by Parsons et al. (2006) and Pahm et al. (2009). Many factors contribute to the large variability in chemical composition of DDGS, which include ethanol sources, fermentation technology (Cromwell et al., 1993), ratio of distillers grains to distillers solubles, drying temperatures and drying time (Noll et al., 2006). In the present study, DDGS samples were collected from 8 provinces of China, including northeast, northwest and central plains regions. Thus, corn varieties, climate and soil conditions in these areas may be a source of the differences.
The regression equation based on the whole data (n = 25) cannot predict TMEn precisely (R2 = 0.34; RMSE = 361.9, data not shown), so the outliers were removed from the data set for further analysis. Because of the high correlation between GE and TMEn and the ratio of TMEn to GE being relatively stable, the outliers were removed when the ratio (TMEn to GE) was below or above 2 SD of the average value. Unlike the previous report, no proximate composition parameters were included in the model when gross energy and a* were in the equation. Rochell et al. (2011) reported that nutrients including NDF, GE and CP can be used to generate AMEn prediction equations for corn co-products (R2 = 0.87), but they did not observe a correlation between AMEn and GE (r = 0.214, p = 0.44). Gross energy was strongly correlated with TMEn in the present study.
Gross energy usually cannot be determined by the feed industry in China; therefore, the present study wanted to develop a more practical model for commercial application with proximate composition and color scores. Fat and a* were in the final equation without an intercept. Similar to the results in this study, Batal and Dale (2006) found the best single predictor of TMEn was EE and followed by CF, CP and ash, but these equations may only be used as a general guide (R2 = 0.45). In contrast to the results of the current study, Cozannet et al. (2011) predicted AMEn of wheat DDGS with L* (R2 = 0.77) instead of a*, while this study did not determined a* or b* values.
Results of TMEn showed considerable variation among samples (CV = 17.1%, n = 25) and the range spaned 1,610 kcal/kg. Small variation in TMEn values of DDGS, however, was reported by Parsons et al. (2006), who determined 20 DDGS on samples from feed mills in Minnesota with a CV of 3.6%; another study (Batal and Dale, 2006) determined 17 DDGS samples from 6 different plants in the Midwestern United States with the TMEn ranging from 2,490 to 3,190 kcal/kg (86% DM basis) and a CV of 6.4%. Although DDGS samples were high in fat, lower TMEn (Average = 2,144 kcal/kg, 46% of GE) was observed in the present study compared to the values in the United States in which TMEn takes nearly 60% of GE (Fastinger et al., 2006; Kim et al., 2010). One possibility of low TMEn is that DDGS in the present study were high in NDF, which cannot be digested by poultry (except turkey), and a high fiber diet enhanced intestinal movement that reduced feed retention time and feed digestibility. It is well known that most starch and sugar in DDGS were fermented to ethanol, and less than 7.0% starch is in the DDGS (Belyea et al., 2004; Stein et al., 2006). NFE is considered as a measure of the digestible carbohydrates (Leeson and Summers, 2009), thus another possible contributor to a low TMEn could be the low concentration of NFE in DDGS samples.
In contrast to previous reports, no correlation was found between color scores and TDAA or true digestible lysine. Previous studies demonstrated that sources of DDGS with a lighter and more yellow color tend to have greater TDAA and true digestible lysine (Batal and Dale, 2006; Babcock et al., 2008; Pahm et al., 2009). Colors of DDGS are changed by the drying process (drying temperature and time), in part, this represents the degree of the Maillard-reaction, and this reaction decreased AA digestibility of DDGS. However, factors more than heat processing also affect the products color, darker and less yellow color was produced by increasing the soluble fraction into DDGS (Noll et al., 2005; Noll et al., 2007), but this change has no substantial effect on digestibility of AA. This suggests that color scores are not good indicator of AA digestibility for the present DDGS samples.
In addition, no correlation was found between CP and TAA in this study, and NAACP had a large variation between samples (CV = 55.01%). These results indicated that CP or color scores could not represent amino acid nutritional characteristics of DDGS.
In summary, the present results indicate that corn DDGS in China have a variable chemical composition and TMEn. In addition, gross energy is the best single indicator of TMEn. Finally, in this study, color score cannot predict TDAA or TD lysine of DDGS.
Acknowledgements
The work was supported by the Science & Technological Project of Shaanxi Province, China (2011KTDZ02-01-01, 2011KTCQ02-02), the National Key Technologies R&D Program of China (2011BAD26B03) and the R&D Fund of Shenzhen Kondarl Gaoling Feed Co. Ltd., Shaanxi, China.


