


INTRODUCTION
Beef meat characteristics, such as meat tenderness, colour and marbling (intramuscular fat quantity) are important factors which establish meat quality perceived by consumers, and as a consequence shape market demand. The structure of muscle, including intrinsic structure (sarcomere length, myofilament diameter, fiber types) and its basic chemical composition (moisture, fat, protein, ash and collagen content) are also important, because meat quality depends on them. Beef quality may be partly explained by understanding of these factors. The strongest single beef quality attribute is the marbling score, so in many countries it is the basis for the carcasses evaluation (Hocquette et al., 2005), e.g. it is the major factor in determination of beef ŌĆ£quality gradeŌĆØ in USA (Indurain et al., 2009). However, in European countries, evaluation of meat quality is based only on conformation and fat EUROP classification. It is concluded that there is a positive relationship between marbling score and quality grade, while there is weaker relationship between maturity score and quality grade (Park et al., 2002). On the other hand, it is suggested, that when animal is getting older, marbling score is increasing, but tenderness is decreasing (Wulf et al., 1996). Simultaneously, the most variable factors in the meat production, even in similar conditions, that may also influence meat quality, are the weight of animal and pH of meat. All the mentioned factors contribute to meat quality, however it is still not well known if it is possible to create meat quality and specified desired quality traits, by planning conformation and fat class of carcasses during production accompanied by controlling weight of animal and age of slaughter.
The aim of the present study was to determine the influence of age of animal, hot carcass weight, pH, conformation and fat class on basic beef quality attributes (tenderness, sarcomere length, basic chemical composition, marbling and colour), that was analysed on a small homogenous group of purebred animals.
MATERIAL AND METHODS
Sample preparation
The object of the study was beef of Limousin bulls characterized by hot carcass weight of 432┬▒31 kg (388 to 466 kg), ŌĆ£UŌĆØ conformation class and ŌĆ£2ŌĆØŌĆōŌĆ£3ŌĆØ fat class. Animals were raised using typical practices, dam-reared to the age of natural weaning (8 to 9 months) and after that raised on natural pastures. No feeding supplementation was applied. All the animals were slaughtered at the age of 25 to 27 months. Carcasses were aged at 4┬░C for 5 days post mortem. The range of pH values was typical (5,48 to 5,87) - no defects of carcasses were observed. Cuts (3 to 9 for each group) were obtained from each carcass - it was Infraspinatus muscle from the blade (slow twitch oxidative fibers - type I) and Longissimus dorsi muscle (fast twitch glycolytic fibers - type IIB) from the cube roll and the striploin. As Longissimus dorsi is the longest muscle in beef cattle, it was decided to analyse two cuts within this muscle - anterior and posterior (Longissimus dorsi et thoracis and Longissimus dorsi et lumborum). Cuts were obtained from a commercial abattoir without an excessive amount of intramuscular fat tissue and connective tissue.
Texture analysis
After slaughter, the meat was aged for 5 d to 2 d in carcasses and afterwards 3 d in steaks in a vacuum at a temperature of 0┬░C. After ageing, steaks were stored in a vacuum at a temperature of ŌłÆ18┬░C. For texture analysis (Warner-Bratzler shear force), the representative beef steaks were thawed in a refrigerator until an internal temperature of 2┬░C was reached. Thermal treatment was conducted using Silex High Speed Contact Grill S-165K (Silex Grills, Stanmore, Australia) until an internal temperature of 71┬░C was reached, according to widely applied methodology (AMSA, 1995). After thermal treatment steaks were chilled at 2┬▒1┬░C before coring to obtain uniform diameter cores. Six 1.27-cm cores were sheared once perpendicular to the longitudinal orientation of the muscle fibers with a Instron 4301 Universal Testing Machine (Instron, Canton, Massachusetts, USA) equipped with a 500 N load cell and V-notch blade with a cut rate of 200 mm/min was used. The tenderness of samples [N] was recorded as the first significant peak of the force-deformation curve (where the force falls off).
Sarcomere length measurement
Sarcomere length was measured according to the method of Cross et al. (1981) with some modifications (quantity of myofibrils and sarcomeres measured was modified to allow obtaining representative results), as published previously (Guzek et al., 2012). For each cut, representative 5 g meat samples were collected and microscopic preparations were obtained from a sucrose solution - samples were homogenized in 30 ml of cold 0.25 M sucrose at low speed (mechanical homogeniser PRO 200, PRO Scientific Inc., Connecticut, USA ŌĆō 5,000 rpm, 60 seconds). The evaluation of the sarcomere length was conducted using a Carl Zeiss Axio Imager.M2 microscope (Carl Zeiss, Oberkochen, Germany) with the EC Plan-Neofluar 100x/1.30 Oil Ph 3 M27 objective and AxioCamMR5 camera. Microscopic preparations were observed under DIC - differential interference contrast. Sarcomere length was measured using the AxioVision Rel.4.8.2 software (Carl Zeiss, Oberkochen, Germany). Three myofibrils were selected for every sample and length of 25 sarcomeres for each myofibril was measured.
Basic chemical composition measured using near-infrared spectroscopy (NIR)
For each cut, representative 150 g meat samples were collected and homogenized with a blender for at least 30 seconds, but no longer than 60 s, in order to obtain a homogenous mixture. Samples were placed on petri dish (diameter - 90 mm) in NIR device (NIR Flex Solids N-500, B├╝chi, Flawil, Switzerland - spectral range - 800 to 2,500 nm). For each sample, scanning with spectrophotometer was performed three times, according to widely applied methodology (Prevolnik et al., 2004). Spectral analysis software NIR Ware 1.1, NIR Cal 5.1 (B├╝chi, Flawil, Switzerland) was used. Moisture, fat, protein, ash and collagen content (%) was measured for each sample.
Intramuscular fat tissue measured using computer image analysis
Intramuscular fat tissue quantity (marbling) (%) for each meat sample was determined using computer image analysis, according to widely applied methodology (Yang et al., 2006). The representative beef steaks, after blooming for half an hour, were placed on a matt green background to ensure easier segmentation. The pictures of beef steaks were taken using CD QImaging MicroPublisher 5.0 RTV camera (QImaging, Surrey, Canada) under fluorescent light in standard conditions (colour temperature of 5400K - similar to sunlight). Each image was captured and saved in TIFF format. The area of intramuscular fat tissue was calculated using Image-Pro Plus 7 (Media Cybernetics, Silver Spring, Maryland, USA).
Components of colour analysis
The colour of meat samples was measured using a Hunter Lab chromometer Minolta CR-400 (Minolta Camera Co., Osaka, Japan) with an 8 mm diameter measurement area, using a D65 standard illuminant. The chromometer was previously calibrated against a standard white reference tile (CR-A43). Ten measurements were taken for each sample in various steak locations, with the exception of marbling areas, according to recommended methodology (Hunt et al., 1991). The L* (lightness), a* (bluish-green/red-purple hue component) and b* (yellow/blue hue component) values were collected for all the samples.
Statistical analysis
To verify the normality of distribution the W Shapiro-Wilk test was used. Differences between the characteristics of analysed samples were assessed using t-Student test (in case of normal distribution) or U Mann-Whitney test (in case of distribution different from normal), as age, conformation class and fat class in some groups were not independent variables. Analysis of correlation for the characteristics of analysed samples was conducted using PearsonŌĆÖs correlation (in case of normal distribution) or SpearmanŌĆÖs rank correlation (in case of distribution different from normal). Level of significance pŌēż0.05 was used, but for the samples comparisons and correlations of characteristic of analysed samples, level pŌēż0.1 was also indicated as close to significance. Statistical analysis was conducted using Statistica software version 8.0 (StatSoft, Tulsa, Oklahoma, USA).
RESULTS AND DISCUSSION
Attributes, such as meat tenderness, colour and fat tissue characteristics, as well as structure of muscle and basic chemical composition are important factors influencing meat characteristics. However, to understand associations between these factors, not only is research comparing features between various feeding systems and breeds required (Dymnicka et al., 2004; Nuernberg et al., 2005; Scollan et al., 2006; Xie et al., 2012), but also between age groups, conformation or fat classes.
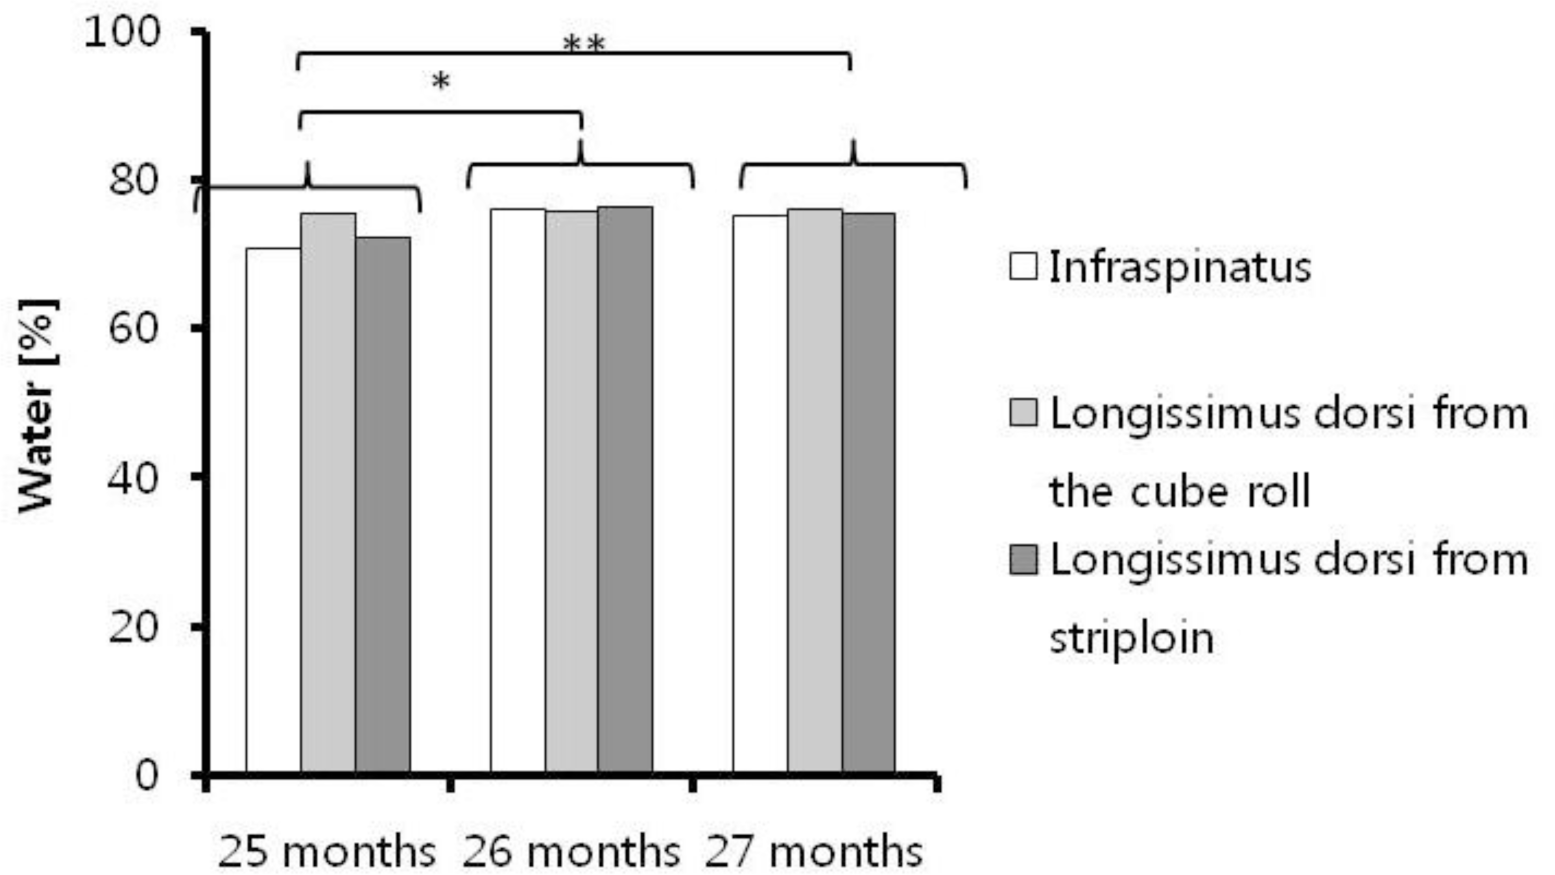
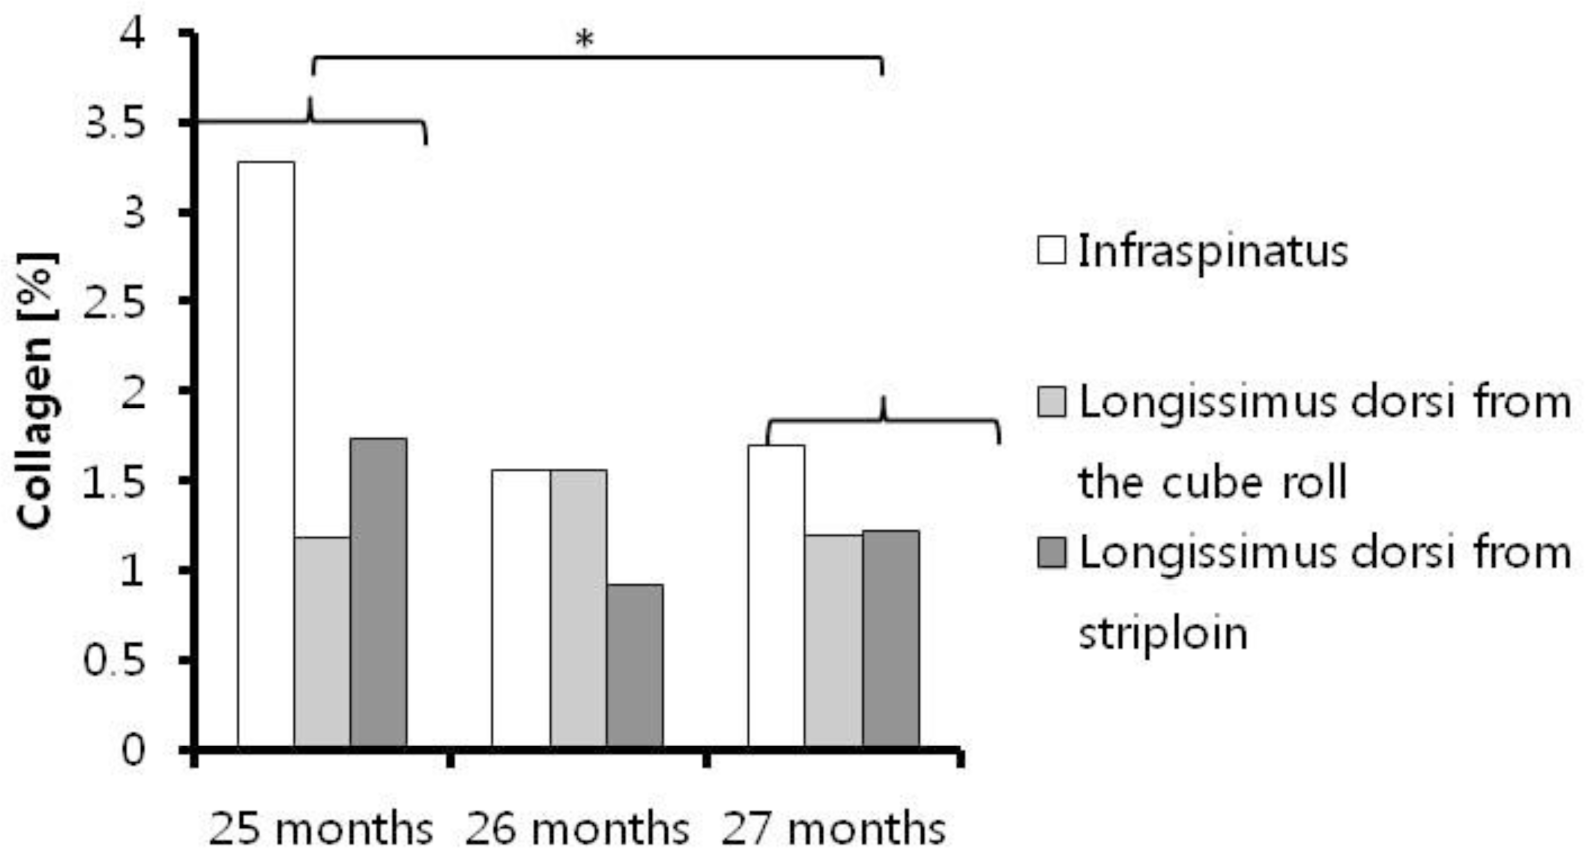
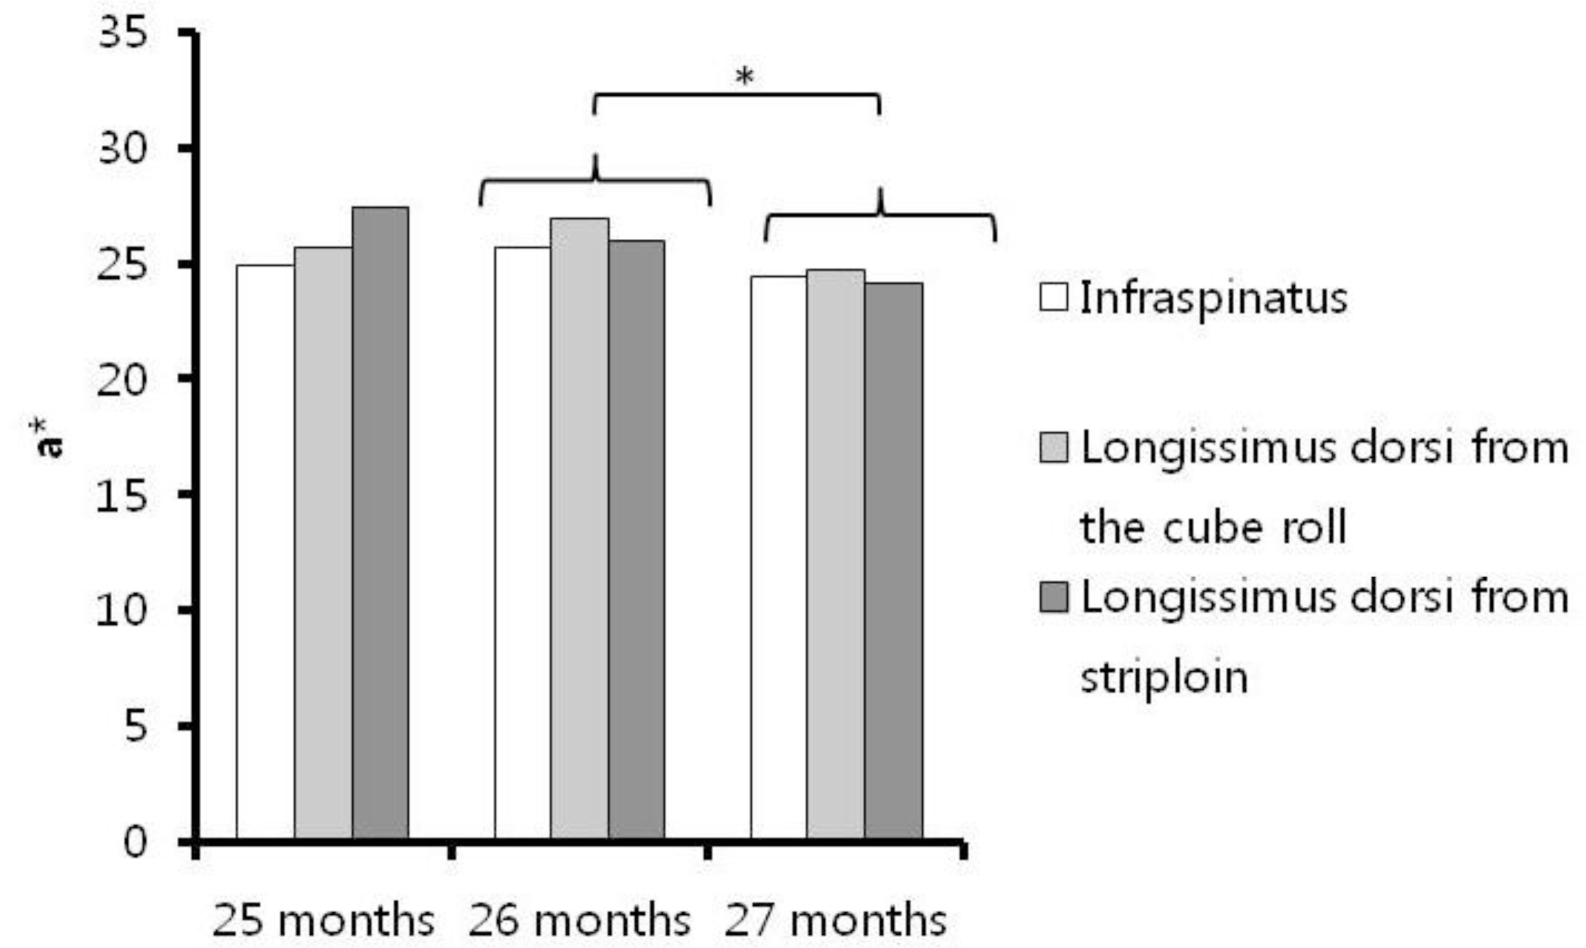
Tenderness, sarcomere length, basic chemical composition and components of colour in the age groups did not differ in many cases. Differences were observed for moisture (Figure 1), fat (Figure 2) and collagen content (Figure 3), as well as for the a* component of colour (Figure 4). It may be concluded that no differences in tenderness and sarcomere length were obzserved in the age groups of Limousin bulls slaughtered at the age of 25 to 27 months (p>0.05). It is consistent with previous observations (Shackelford et al., 1995). Significant influence of age on basic chemical composition and meat colour, which was observed, is consistent with the statement that meat colour is influenced by carcass fatness, pH value, age and intramuscular fat content (Priolo et al., 2001).
In case of basic chemical composition, such as moisture (p = 0.0123), fat (p = 0.0250) and collagen content (p = 0.0901), significant (pŌēż0.05) or close to significance (pŌēż0.1) differences for beef meat of animals slaughtered at the age of 25 and 27 months were observed. Meat of younger Limousin bulls was characterized by lower moisture content and higher fat and collagen content. Observations are consistent with the conclusion that age has a great influence on meat quality, even greater than breed (du Plessis and Hoffman, 2007). On the other hand, research of other authors indicates that fat content in beef meat of animals slaughtered at the age of 18 months does not differ in case of various breeds (Muchenje et al., 2009).
Close to significance difference observed in case of moisture content for 25 and 26 months bulls suggests that for animals slaughtered at the age of 25 months, in comparison to other age groups, moisture content was lower than for older animals (p = 0.0882). In spite of fat content differences, no marbling differences were observed. This result may be connected with the fact that fat cover differences are not associated with changes in intramuscular fat quantity as indicated by Jones et al. (1992) from their observations that only 1 to 3% of the marbling variation is accounted by the subcutaneous fat thickness.
In case of L*a*b* components of colour, differences close to significance (p = 0.0710) for age groups were observed only in a* component for animals slaughtered at the age of 26 and 27 months. Older animals were characterized by lower values of a* component of colour (lower intensity of red colour). It is confirmed by observations of other authors, that a less red colour of meat (lower values of a* component of colour) is obtained from older bulls rather than from younger (W─Öglarz, 2010).
Analysis of correlation of hot carcass weight and pH of raw beef meat with tenderness, sarcomere length, basic chemical composition and components of colour is presented in Table 1. No influence of pH on tenderness was observed, but at the same time, influence on sarcomere length, marbling score and colour (b*) was found. Simultaneously, it may be concluded that in case of Limousin bulls slaughtered at the age of 25 to 27 months, hot carcass weight does not influence any of analysed beef features. Also other authors conclude, that slaughter weight does not influence fatty acid profile of meat (Holl├│ et al., 2001a), however, in some research they indicate an influence on monounsaturated fatty acids (Holl├│ et al., 2001b).
In sarcomere length (p = 0.039; R = 0.5354) and marbling (p = 0.080; R = 0.4654), a positive correlation with pH was observed - for sarcomere length it was significant and for intramuscular fat quantity it was close to significance. It may be stated, that in case of higher pH, beef meat is characterized by longer sarcomeres and this fact may influence general beef quality, including texture (Wheeler et al., 2000; Maher et al., 2005), however, no correlation between pH and meat tenderness was observed.
In components of colour, b* component was significantly correlated with pH (p = 0.045; R = -0.5246), but for other components such correlations were not observed.
All presented correlations were moderate (R coefficient lower than 0.7), so it may be suggested that pH value is not the only factor influencing analysed beef features. This conclusion is supported by differences in beef quality within age groups presented previously, as well as differences in beef quality within conformation class groups and fat class groups presented below.
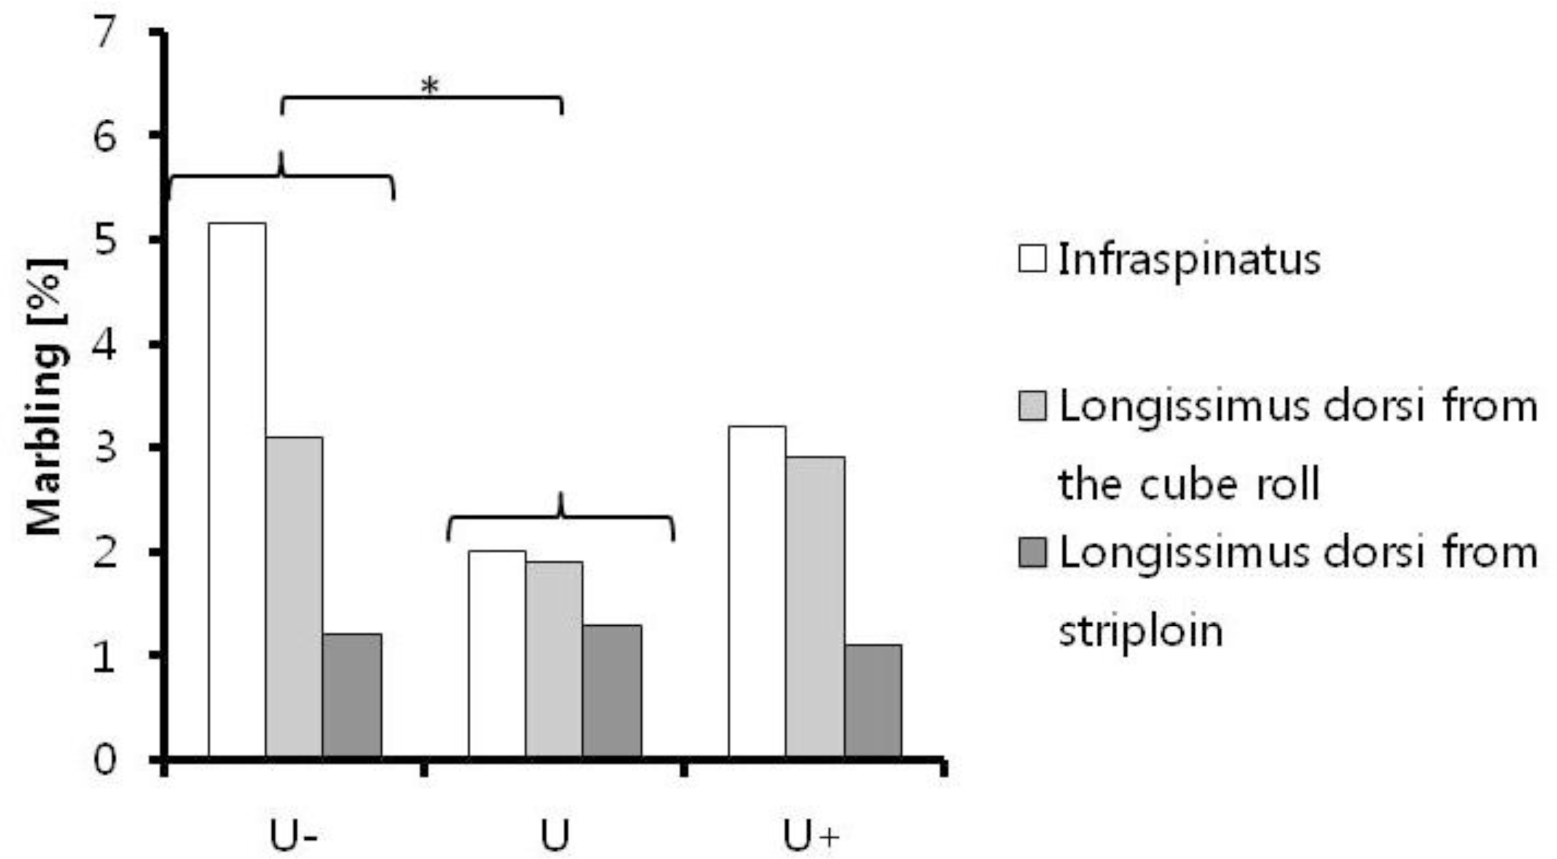
Tenderness, sarcomere length, basic chemical composition and components of colour in the conformation class groups did not differ in general. Also other authors conclude, that the conformation type of heifers did not differentiate the traits decisive for the meat quality (Nogalski and Pogorzelska, 2001). The only difference was observed for marbling (Figure 5). It was concluded that for ŌĆ£U-ŌĆØ, ŌĆ£UŌĆØ and ŌĆ£U+ŌĆØ conformation classes, there were no differences in tenderness, sarcomere length and components of colour.
Differences observed in marbling between ŌĆ£U-ŌĆØ and ŌĆ£UŌĆØ samples were close to statistical significance (p = 0.0942). Samples from carcasses assessed as ŌĆ£U-ŌĆØ conformation class were characterized by higher quantity of intramuscular fat tissue than in case of samples from carcasses assessed as ŌĆ£UŌĆØ conformation class. It may be concluded, that for Limousin bulls slaughtered at the age of 25 to 27 months, in ŌĆ£UŌĆØ conformation subclasses, differences in beef meat characteristics are rather minor and conformation class does not influence meat quality. It has been previously suggested by other authors, that carcasses conformation class, as well as fat class are relatively poor predictors of carcass composition (Pabiou et al., 2011). Marbling is the only exception and it may be correlated with carcass classification (Janz et al., 2004).
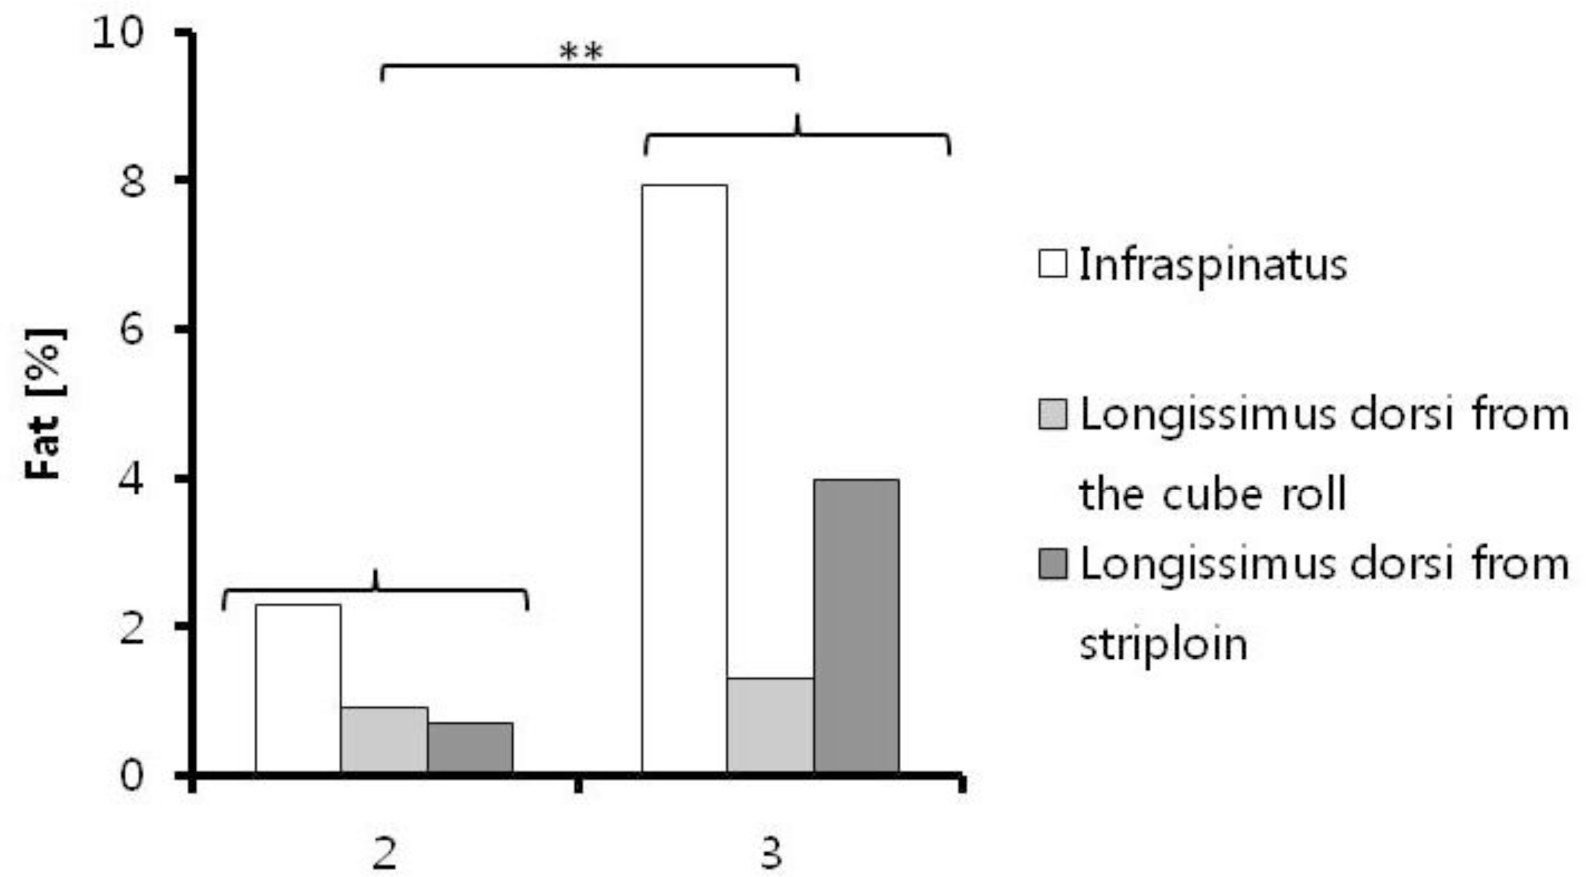
Tenderness, sarcomere length, basic chemical composition and components of colour in the fat class groups did not differ in general, as was the case in the conformation class groups. The differences were observed only for basic chemical composition: moisture (Figure 6), fat (Figure 7) and collagen content (Figure 8). It may be concluded, that in fat class range ŌĆ£2ŌĆØŌĆōŌĆ£3ŌĆØ, fat class does not influence tenderness, sarcomere length and colour of beef from ŌĆ£UŌĆØ conformation class Limousin bulls.
Beef meat from carcasses of class ŌĆ£3ŌĆØ was characterized by a higher fat content (p = 0.0086) than class ŌĆ£2ŌĆØ. Simultaneously, class ŌĆ£3ŌĆØ was characterized by higher collagen quantity (p = 0.0523) and lower moisture content (p = 0.0513), when compared to class ŌĆ£2ŌĆØ. No difference in marbling, observed at the same time, indicates that various fat classes were mainly associated with fat cover, not with intramuscular fat tissue quantity. Present observations support the breeding experiments conducted by Gwartney et al. (1996), indicating that it is possible to reduce carcass fatness (subcutaneous) while maintaining marbling and eating quality of beef.
IMPLICATION
It is important to evaluate the real influence of age of animal, hot carcass weight, pH, conformation and fat class on quality attributes to create desired traits of beef. In the age groups of Limousin bulls slaughtered at the age of 25 to 27 months, no differences in tenderness and sarcomere length were observed. Meat of younger bulls was characterized by lower moisture and higher fat content, but these factors were not associated with marbling. Hot carcass weight did not influence any of the analysed features. No influence of pH on tenderness was observed, but a positive correlation of pH with sarcomere length and negative with b* component of colour was found. For ŌĆ£UŌĆØ conformation class, in subclasses, as well as for fat classes ŌĆ£2ŌĆØŌĆōŌĆ£3ŌĆØ, there were no differences in tenderness, sarcomere length and colour. Higher fat content was observed in the higher fat class than in the lower, however, it was not associated with marbling. By planning conformation and fat class during production combined with controlling weight and age of slaughter of Limousin bulls, it is possible to modify chemical composition and colour of meat, but for ŌĆ£UŌĆØ conformation and ŌĆ£2ŌĆØŌĆōŌĆ£3ŌĆØ fat classes, it is difficult to modify marbling and tenderness, even if sarcomere length is altered.


 PDF Links
 PubReader
 ePub Link
 Full text via DOI
 Full text via PMC
 Download Citation
 Print
Print


