The Effect of Level of Crude Protein and Available Lysine on Finishing Pig Performance, Nitrogen Balance and Nutrient Digestibility
Article information
Abstract
Two trials were conducted to investigate the effect of decreasing the crude protein (CP) content of diets for finishing pigs containing two levels of available lysine on nutrient digestibility, nitrogen (N) balance and production performance. Ten finishing diets containing five levels of CP (on average 144, 155, 168, 182 and 193 g/kg fresh basis) and two levels of available lysine (6.9 and 8.2 g/kg fresh basis) were formulated. The diets were offered to pigs on a performance trial (n = 800 Large White (LW)×Landrace (LR) pigs) from 10 wk of age until finish at 21 wks+5 d of age. Average daily gain (ADG), average daily feed intake (ADFI) and feed conversion ratio (FCR) were calculated. In addition, a digestibility/N balance trial was conducted using pigs (n = 80 LW×LR) housed in metabolism crates. Digestibility of dry matter (DM), CP, oil, fibre and energy was determined. N balance values were determined through analysis of N content of urine and faeces (‘as determined’). N balance values were also calculated using ADG values and assuming that 16% of growth is protein deposition (“as calculated”). Pig performance was poor between 10 and 13 wk of age which indicated that the dietary treatments were nutritionally inadequate for pigs less than 40 kg. There was a significant (p<0.01) quadratic effect of increasing CP level on feed intake, ADG and FCR from 10 to 13 wk which indicated that the lower CP levels did not supply adequate levels of essential or non-essential amino acids. There was no effect of increasing available lysine level throughout the early period, which in conjunction with the response in older pigs, suggested that both 8.2 and 6.9 g/kg available lysine were insufficient to drive optimum growth. There was a positive response (p<0.05) to increasing available lysine level from 13 wk to finish which indicated that 6.9 g/kg available lysine was not adequate for finishing pigs. Energy digestibility decreased with decreasing CP level of diets containing 6.9 g/kg available lysine which may be attributed to the higher fibre content of the lower CP diets. Nitrogen excretion (g/d) was lowered when dietary CP was reduced regardless of whether the values were determined through balance or calculated using ADG. Calculated N excretion decreased linearly (p<0.001) and quadratically (p<0.001) with decreasing dietary CP content. When the N balance figures calculated in this study were compared with those quoted in the Northern Ireland and English Nitrates Directive Action Programmes, N excretion was less per pig (wean to finish) offered a 169 g/kg CP, 8.2 g/kg available lysine diet (2.39 kg vs 3.41 kg (Northern Ireland) and 2.93 kg (England)).
INTRODUCTION
Pigs must be supplied with adequate levels of protein, in an optimum ratio to dietary energy, to maximize growth and lean deposition (Van Lunen and Cole, 2001). Dietary protein is normally assessed in the form of crude protein (CP), which consists of amino acids in various proportions. It is the amount and proportion of amino acids present in CP which are important factors, rather than CP per se and it has been established that essential amino acids should be supplied to pigs in similar ratios to that of pig muscle - the “ideal protein” concept (ARC, 1981). As lysine is the first limiting amino acid in pig diets, ideal protein is set in ratio to lysine levels and pig diets are usually formulated to contain a specific level of lysine and CP to ensure an adequate supply of other amino acids. This can lead to an oversupply of CP in pig diets and may result in unnecessary excretion of nitrogen (N) to the environment. European legislation has been passed in an attempt to reduce the environmental impact of agriculture; Integrated Pollution Prevention and Control Directive (IPPC Directive 96/61/EC) and the Nitrates Directive (Directive 91/676/EEC). The IPPC Directive aims to reduce all polluting emissions to air, water and soil and to make more efficient use of resources. The Nitrates Directive aims to prevent pollution of surface and groundwater by excess N. Although the pig industry is not the only contributor to environmental pollution, both of these Directives have implications for pig producers and research is needed to quantify N excretion values for finishing pigs and to investigate means of reducing overall N excretion.
Animals are generally inefficient in using N. For example, dairy cows only retain approximately 20 to 30% of the N consumed in milk and the remainder is excreted (Agnew and Yan, 2004). The situation is somewhat better for pigs and the efficiency of N use can be as high as 40% (Rotz, 2004). Nitrogen losses are therefore inevitable, but nutrition can play an integral role in reducing excretion as N excretion is directly related to N intake. It is possible to reduce dietary CP content and maintain ideal protein through the addition of synthetic amino acids, although not all amino acids are available commercially. Lenis and Jongbloed (1989) reported that a reduction of 1% in dietary CP content resulted in a reduction in N excretion of 8.5%. However, it is difficult to formulate diets with sufficient levels of ideal protein and lysine if the target CP level is low. Also, reducing CP to a low level may result in deficiency of non-essential amino acids and have adverse effects on growth and therefore ultimately on the environment, as pigs will need to be retained longer to reach target “finish weight”. It is not known at what level of CP these adverse effects will occur in an entire boar production system. Currently, in the UK, diets for finishing pigs are as high as 180 g/kg but other European countries are restricted to lower levels, partly because their production is based on castrates and gilts. According to Weatherup et al. (2002) the high lean growth rates associated with genetic status of the Northern Ireland growing pig results in a dietary CP requirement of at least 180 g/kg for maximum production in terms of both economics and efficiency.
The aim of the current study was to investigate the effect of decreasing the CP content of diets for finishing pigs, containing two levels of available lysine, on nutrient digestibility, nitrogen balance and production performance.
MATERIALS AND METHODS
Animals, experimental design and diets
Two trials were conducted, a performance trial and a digestibility/N balance trial. Pigs used in both trials were Large White (LW)×Landrace (LR) from the Agri-Food and Biosciences Institute, Hillsborough pig herd. Both trials were designed as five×two factorial experiments with five dietary levels of CP and two dietary levels of available lysine. Thus, the ten pelleted finishing diets were formulated to contain increasing levels of CP (on average 136, 149, 162, 175 and 188 g/kg) at two levels of available lysine (8.0 and 9.0 g/kg) content. Available lysine can be defined as standardized ileal digestible lysine (British Society of Animal Science (BSAS), 2003). The diets were formulated to contain essential amino acids close to ideal protein as determined by Wang and Fuller (1990) and recommended by BSAS (2003). Diet formulations are detailed in Table 1. Actual dietary CP levels were higher than the formulated values although the proportionate differences between each CP level were similar to the formulated differences (Table 2). Actual lysine levels were lower than formulated values with average available lysine being 6.9 and 8.2 g/kg (fresh basis) as opposed to 8.0 and 9.0 g/kg. All other essential amino acids were supplied at or close to ileal protein. Neutral detergent fibre (NDF) and lipid levels reflected the dietary ingredient composition, ranging from 173.6 to 191.5 g/kg dry matter (DM) and 44.6 to 68.8 g/kg DM respectively. Ash and gross energy (GE) contents were consistent across the dietary treatments.
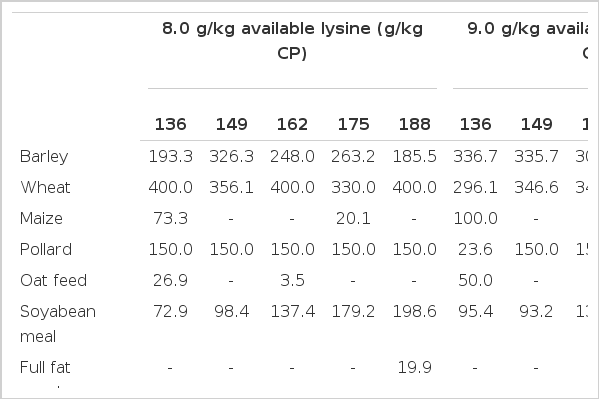
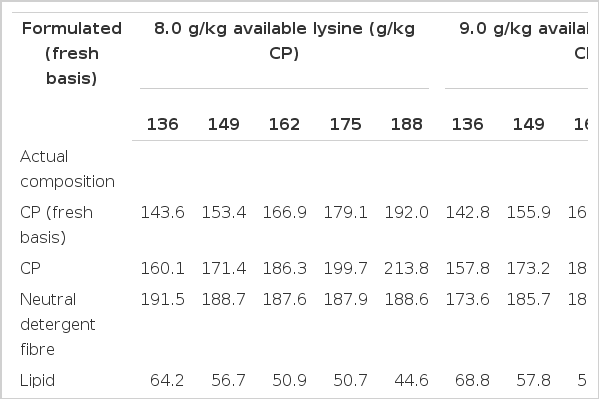
Chemical composition (g/kg DM) and energy content (MJ/kg DM) of experimental diets
Performance trial
The ten dietary treatments were offered to a total of 800 LW×LR pigs from 10 wks of age until finish at 21 wks+5 d of age. Equal numbers of entire males and gilts were used. The pigs were housed in groups of ten, balanced for weight and gender and there were eight replicates per treatment. The experimental period was from 10 wks of age until finish, with all pigs being weighed at 10 wks, 13 wks, 16 wks, and finish. Average daily liveweight gain (ADG), average daily feed intake (ADFI) and feed conversion ratio (FCR) were calculated over each of these time periods.
Digestibility/N balance trial
The diets were offered to a total of 80 entire male LW×LR pigs over eight time replicates. (For each time replicate, there were 10 pigs on trial and this was repeated eight times, utilising 80 pigs in total and giving eight pigs/treatment). The average start weight of the pigs was 39.1 kg and the pigs were housed in metabolizm crates for a period of 14 d (7 d pre-feed+7 d total collection period of faeces and urine). Samples of the diets and faeces were collected and analyzed to determine digestibility of DM, CP, lipid, NDF and energy. Urine was collected directly, using a funnel, into a plastic container containing sulphuric acid (25%). The funnel was washed four times daily with weak sulphuric acid (2%) to minimize volatilization. Proximate analyses were performed according to the methods outlined by the Association of Official Analytical Chemists (1990). Lipid content was measured by the Oil Procedure B method as outlined in the Official Journal of the European Communities (1998). Gross energy was determined using a Parr, Model 1271, bomb calorimeter. N excretion was determined from N analysis of urine and faeces and N retention determined using actual N intake values (termed “as determined through BALANCE”). N excretion and retention figures were also calculated using an equation to establish N retention (ADG×0.16)/6.25) which assumes that 16% of ADG is crude protein (Whittemore et al., 1988). This is referred to “as calculated”.
Statistical analysis
The data were analyzed by Analysis of Variance (ANOVA) using Genstat Version 8.0. The interactive effects of CP level×available lysine level were tested for by pairwise multiple comparisons, as were the main effects of CP and available lysine level. Linear and quadratic effects of CP level were also examined using polynomial contrasts. For the performance trial, pen was taken as the experimental unit and for the data for 13 wks onwards, 10 wks weight was used as the covariate. For the digestibility/N balance trial, individual pigs were taken as the experimental unit.
RESULTS
Performance trial
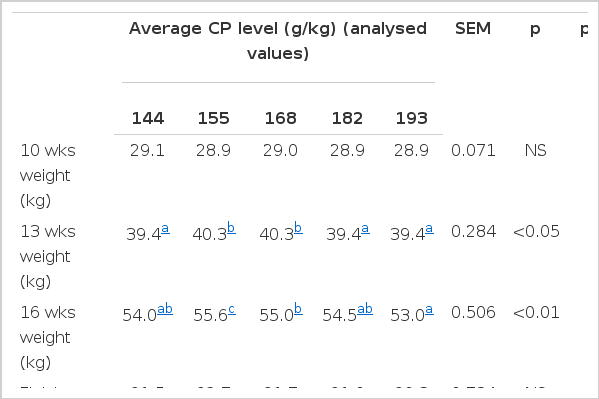
There was no interaction between CP and lysine level, therefore the main effects are presented and discussed. Pig performance was poor between 10 and 13 wks of age regardless of treatment (Table 3). There was a significant (p<0.01) quadratic effect of increasing CP level on feed intake, ADG and FCR from 10 to 13 wks. A quadratic effect was also observed for 13 wks and 16 wks live weight (p<0.01) although there was little effect of CP level on feed intake, liveweight gain (LWG) or FCR after 13 wks.
Dietary available lysine level significantly affected 16 wks weight, finish weight, killing out % and ADG between 10 wks and finish, 13 to 16 wks and 13 wks to finish, with the higher available lysine level resulting in improved performance (Table 4). Offering diets containing 8.2 g/kg available lysine improved feed efficiency at all stages apart from the 10 to 13 wks and 16 wks to finish period. Interestingly, there was no effect on any of the parameters from 10 to 13 wks of age.
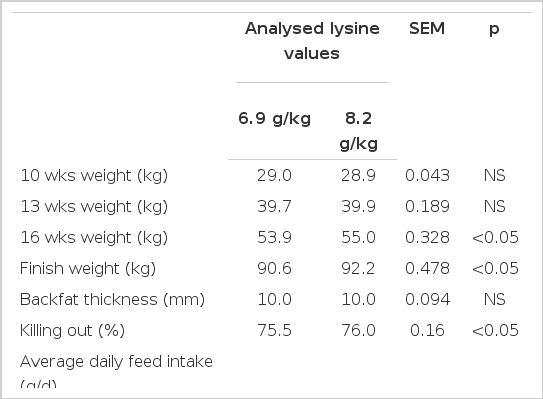
The effect of available lysine level on performance, killing out % and backfat thickness
Digestibility/N balance trial
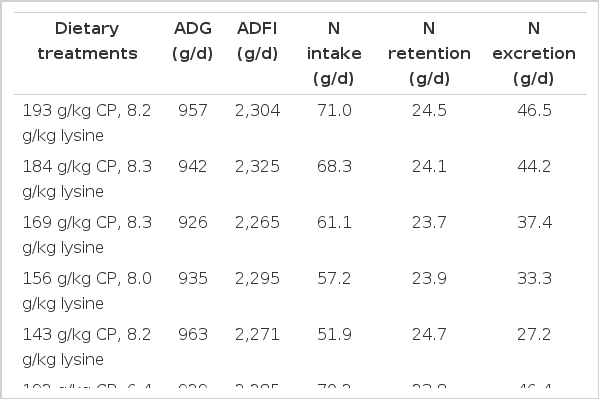
There was an interactive effect of CP and available lysine level on DM, energy and oil digestibility and on N excretion (Table 5). At 6.9 g/kg available lysine, DM and energy digestibility increased with increasing levels of CP but at 8.2 g/kg available lysine there was no consistent difference. For lipid digestibility, 143 g/kg CP and 8.2 g/kg lysine resulted in a significantly higher value compared with the other 8.2 g/kg lysine treatments, whereas, for 6.9 g/kg lysine, 144 and 153 g/kg CP resulted in significantly higher values. For the 8.2 g/kg lysine treatments, N excretion increased with increasing levels of CP, (up to 184 g/kg CP), but for the 6.9 g/kg lysine treatments there was no significant difference between 144 and 153 g/kg CP and then N excretion increased up to 192 g/kg CP. Overall, N excretion increased linearly (p<0.001) with increasing dietary CP content. N retention increased linearly (p<0.001) with increasing CP content.
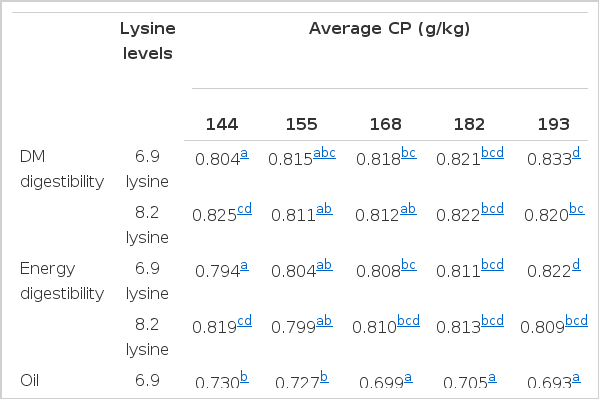
The effect of CP and available lysine level on nutrient digestibility and N balance of finishing male pigs (initial weight 39.1±2 kg)
Nitrogen excretion-comparison with UK nitrates directive action plans
The N balance figures as determined through balance are presented in Table 5. As stated in the materials and methods, performance figures were used to calculate N balance (as calculated). Table 6 and 7 present the N balance figures for pigs from 13 to 16 wks and 16 wks to finish respectively. It is apparent that N excretion values are lower when determined through balance compared with the calculated values. Using the average difference between calculated and determined N excretion (27.7 and 19.8 g/d respectively), the amount of N lost through volatilization was 29%. Assuming that 184 and 169 g/kg CP and 8.2 g/kg lysine diets are standard finishing rations, N excretion values per finishing pig (30 to 100 kg) were calculated.

N balance as calculated through performance data (13 to 16 wks, 39 to 55 kg) using the equation ADG×0.16/6.25 = N retention
N balance as calculated through performance data (16 wks to finish, 55 to 92 kg) using the equation ADG×0.16/6.25 = N retention
Table 8 compares N excretion (kg/pig) values given in the Northern Ireland (Anon, 2006) and English (Anon, 2008) Action Programmes with the values obtained in this study. When a 184 g/kg CP, 8.2 g/kg available lysine diet was offered from 40 to 100 kg, N excretion per pig from wean to finish was calculated to be 2.77 kg as opposed to 2.93 or 3.41 kg quoted by the English and Northern Ireland Action Programmes. N excretion can be reduced further (2.39 kg) by offering 169 g/kg CP, 8.2 g/kg available lysine in the finishing stage with no detrimental effect on performance.
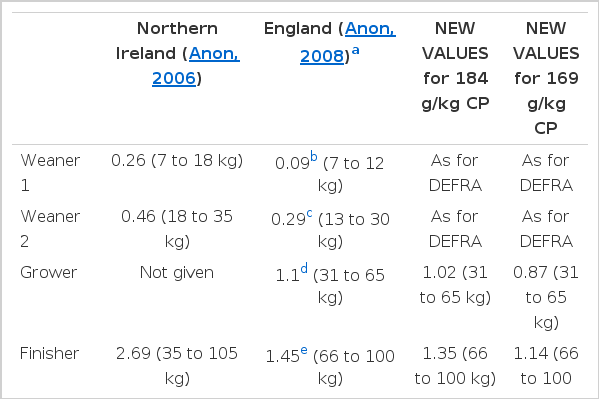
Comparison of N excretion values (kg/pig) for finishing pigs from Northern Ireland (Anon, 2006) and English (Anon, 2008) Nitrates Directive Action Programmes
DISCUSSION
Average daily gain of pigs from 10 to 13 wks of age was poor, with pigs only achieving on average 545 g/d. This is lower than growth levels previously reported for younger pigs between 7 and 10 wks of age (Magowan et al., 2008) and can be partly attributed to the stress the pigs were subjected to at 10 wks of age through transfer to the finishing accommodation, mixing and the change of diet. In addition, there was a low level of post-weaning multi-systematic wasting syndrome (PMWS) prevalent in the herd which would also have reduced performance. However, as the pigs took longer than average to recover from these stresses and performance was considerably lower than normal, it may be assumed that the dietary treatments were nutritionally inadequate for pigs less than 40 kg. This is a key finding, as in the commercial situation, many units would transfer pigs onto the finishing ration below this weight. Offering diets formulated to contain less than 8.2 g/kg lysine and an unbalanced CP level to pigs below 40 kg would severely restrict performance and throughput, hence increasing N excretion. This is supported by the fact that there was a quadratic response to CP level between 10 and 13 wks indicating that the lower levels of CP did not supply adequate essential or non-essential amino acids although it must be stated that ADG was low for all treatments which may have been a consequence of PMWS. The lack of response to increasing lysine level throughout this early period, suggests that both levels of available lysine content were inadequate for pigs between 10 to 13 wks which indicates an inappropriate balance of non-essential to essential amino acid thus increasing the energy required for deamination. Weatherup et al. (2002) investigated the effect of CP and lysine level on the performance of growing pigs from 19 to 37 kg and found that a diet formulated to contain 194 g/kg CP and 9.6 g/kg available lysine was adequate for optimum growth. It was therefore somewhat surprising that the highest level of CP and lysine in the current study resulted in such poor performance from 10 wks age (30 kg). This finding cannot be attributed to differences in feed intake between the two studies as when intake as a proportion of body weight was calculated for both trials, it was 0.03 for both studies. Therefore, it may be concluded from this study that diets formulated to contain 188 g/kg CP and 9.0 g/kg available lysine are inadequate to drive growth of pigs from 10 to 13 wks of age. However, it must be remembered that the actual available lysine in the diet was only 8.2 g/kg which is lower than Weatherup et al. (2002) but higher than the level recommended by BSAS (2003).
There was a growth response to lysine level after week 13 which suggested that 6.9 g/kg available lysine limited performance in pigs from 13 wks of age to slaughter. The importance of lysine in pig diets has been well established, and as lysine is the first limiting amino acids in pig diets, it is vital that supply is adequate. Hahn et al. (1995) reported that there was a positive linear response to lysine on growth, feed efficiency, eye muscle area and lean deposition in pigs.
Overall, the CP level of diets containing close to ideal protein had no significant effect on performance of pigs from 13 wks of age until slaughter. However, N retention as measured through the balance collection numerically decreased with decreasing dietary levels of CP and this is normally associated with a decrease in performance. Several studies report that reducing CP level while maintaining ideal protein has no effect on performance (e.g. Liu et al., 1999). However, below a certain level of dietary CP, the balance and supply of non-essential amino acids is sub-optimal and this can result in lower N retention which is reflected in poorer performance (Zervas and Zijlstra, 2002). As there was no reduction in performance of pigs 13 wks and older due to lower CP diets in the current study, it can be concluded that all diets supplied sufficient amino acids in the appropriate form to prevent problems with supply and absorption. The observed effect on N retention can therefore be attributed to the loss of N through volatilization (McCracken et al., 1980). This conclusion is supported by the fact that there was no difference in N retention values across the dietary CP levels when calculated using ADG×0.16.
It proved extremely difficult to formulate diets to contain low protein, while maintaining sufficiently high lysine content. This difficulty is reflected in the actual levels of CP and lysine determined in the diets. For example, diets formulated to contain 136 g/kg CP and 8.0 and 9.0 g/kg available lysine were found to contain 144 g/kg CP and 7.0 and 8.2 g/kg available lysine when analyzed.
Energy digestibility decreased with decreasing level of CP in diets containing 6.9 g/kg available lysine. This effect was also observed by Zervas and Zijlstra (2002) and was attributed to the lower level of fibre in the high protein diets (Just et al., 1983). However, in the current study there was little difference in the fibre content of any of the diets, although the diet with the lowest level of NDF was the 143 g/kg CP and 8.2 g/kg available lysine diet and the diet with the highest level of NDF was 144 g/kg CP and 6.9 g/kg available lysine. Therefore, the level of NDF in the diets may explain the interaction observed between CP and lysine level on energy digestibility. It is essential to consider the effect of CP level on nutrient digestibility as decreasing digestibility would reduce slurry dry matter concentration and ultimately increase slurry output. This is an important finding given the current restriction on land spreading of slurry (McCann et al., 2007).
Lowering the CP content of pig diets and maintaining available lysine at 8.2 g/kg decreased N excretion which would ultimately decrease N losses as ammonia and N level in slurry (Canh et al., 1998). This is critically important for the pig industry which must now operate within the restrictions of IPPC and the Nitrates Directive. However, on the application of the practices which aim to reduce N excretion, it must be remembered that the method of N excretion assessment is an important consideration. In the present study, N excretion as determined by balance was underestimated as N was lost through volatilization. Volatilization of N in urine to ammonia occurred despite direct collection into sulphuric acid. Loss of N from urine is a common problem during balance studies, but many authors omit to highlight the issue and consequently report inaccurately high levels of N retention and low levels of N excretion. It has been well established that protein gain is approximately 16% of total ADG (Shanks et al., 1988; Whittemore et al., 1988), and given this fact, many of the published values for N balance are impractical. For example, Carpenter et al. (2004) reported an average N retention figure of 31.5 g/d which, if correct, would have resulted in an ADG of 1,230 g/d which is substantially higher than the actual ADG reported (890 g/d) by the pigs from an initial weight of 45 kg. The most accurate assessment of N retention and therefore excretion can be obtained through performance studies to determine ADG. And as slurry contains urine which has undergone volatilization, it is more correct to use figures for N excretion which reflect this. It can therefore be concluded that pigs excrete less N than proposed by the Northern Ireland (Anon, 2006) and English (Anon, 2008) Nitrates Directive Action Programmes.
CONCLUSIONS
Pigs under 40 kg or less than 13 wks of age require diets containing higher levels of CP and available lysine than offered in this study (i.e. higher than 193 g/kg CP and 8.2 g/kg available lysine). For pigs above 40 kg, dietary CP content can be lowered with no adverse effect on performance although diets are difficult to formulate to achieve expected CP and available lysine levels. However, 6.9 g/kg available lysine is not adequate to drive optimum performance. Lowering dietary CP, lowered N excretion. N excretion per pig (wean to finish) was calculated to be less than that quoted by Northern Ireland and English Nitrates Directive Action Programmes.
Acknowledgements
This work was funded by the Department of Agriculture and Rural Development for Northern Ireland, John Thompson and Sons Ltd. and Devenish Nutrition Ltd. within the AFBI/Thompson/Devenish Research Partnership. The authors wish to acknowledge the contribution of the pig unit staff of AFBI, Hillsborough and the Biometrics Branch of AFBI, Newforge.