Comparison of Physicochemical and Sensory Properties between Cholesterol-removed Gouda Cheese and Gouda Cheese during Ripening
Article information
Abstract
This study was performed to compare physicochemical and sensory properties of cholesterol-removed Gouda cheese (CRGC) and Gouda cheese made in the laboratory during ripening. Composition, short-chain free fatty acids (SCFFA), texture, color, and sensory properties were measured. In chemical composition analyses, moistures were significantly different between control cheeses (42.86%) and sample cheese (48.32%) (p<0.05). But fat and protein in the control and the sample were 32.77, 22.45 and 31.35, 20.39%, respectively, and were not significantly different (p>0.05). The amount of cholesterol in control was 82.52 mg/100 g and the percentage of cholesterol removal was 90.7%. SCFFA increased gradually during ripening and its level of CRGC increased and significantly different from that of control (p<0.05). The texture, hardness, gumminess, and chewiness were significantly increased, but cohesiveness and springiness were not increased in both cheeses during ripening periods (p>0.05). In comparison of the control and sample cheeses, hardness, and springiness were not significantly different, but cohesiveness, gumminess, and chewiness were different (p<0.05). In color measurement, all color values were not different between CRGC and control (p>0.05). However, L* value decreased, while a* and b* values tended to increase significantly (p<0.05). In sensory properties, appearance, aroma, flavor and taste, and texture were significantly increased except buttery and nutty in aroma and sweetness in taste in both cheeses, and were not significantly different between the control and sample cheeses during ripening (p>0.05). Therefore, this study suggests that the quality of cholesterol-removed Gouda cheese is not different from the control cheese.
INTRODUCTION
The Gouda cheese originated in Holland and was exported as early as 1600. Its name came from a village in southern Holland of the same name. Gouda cheese is wheel-shaped with parallel flat sides and is generally waxed in red or orange color. They are made with a range of weights from 200 g to 20 kg. The Gouda cheese has a sweet curd, renneted cheese, and is made from partially skimmed or whole bovine milk.
Although dairy products have the healthy image, this image is sometimes not accepted for products containing high fat content, such as cream, butter, and certain type of cheeses. The fat has a close relationship with cholesterol and saturated fat. Some dairy products have high cholesterol content. For example, 219 mg/100 g in butter, 105 mg/100 g in ice cream and 110 mg/100 g in cream cheese (Alonso et al., 2009). Public interest about cholesterol has increased owing to awareness of the relationship of plasma cholesterol to the risk of cardiovascular disease (Fletouris et al., 1998). The World Health Organization and the American Heart association have advised that consumers limit their intake of saturated fatty acids and cholesterol to prevent coronary heart disease (Alonso et al., 2009). The reduction of cholesterol level in dairy products will be an attractive alternative to satisfy consumer’s concerns and demands (Rahoma et al., 1999).
Although powder β-cyclodextrin (CD) has been known as one of the efficient ways to remove cholesterol from dairy products, a single use of β-CD causes economical and environmental problems. To resolve this problem, a crosslinking method was invented. Crosslinking is a usually used as a derivatization technique to reinforce the functionality of starch by inter- or intramolecular bond. Recently, milk and dairy products that have had the cholesterol-removed by crosslinked β-CD have been extensively studied. However, information regarding cholesterol-removed Gouda cheese is limited. Therefore, the purpose of this study is to compare CGRC using crosslinked β-CD and regular Gouda cheese during ripening mainly in physicochemical and sensory properties.
MATERIALS AND METHODS
Materials
Raw milk to manufacture Gouda cheese was purchased from Youngduck Farm (Gyeonggido, Korea). Vials, Teflon-coated rubber septa, and aluminum caps and manual SPME fiber holder unit 50/30 μm divinylbenzene/Carboxen/Polydemethyl-siloxane were purchased from Supelco (Bellefonte, PA, USA).
Chemicals
In order to measure milk fat content in milk and cream, isoamyl alcohol and H2SO4 were purchased from Yakuri Pure Chemicals Co., Ltd (Osaka, Japan). Commercial β-CD (purity 99.1%) was obtained from Nihon Shokuhin Cako Co., Ltd (Osaka, Japan). To crosslink β-CD, adipic acid was purchased from Shinyo Pure Chemicals Co., Ltd (Osaka, Japan) and acetic acid was purchased from Samchun Chemicals Co., Ltd (Pyeongtaek, Gyeonggi-do, Korea). A frozen concentrated direct vat set mesophilic lactic acid starter culture (CHN 11) and rennet (Stamix 1150) were purchased from Chr. Hansen’s Lab. (Copenhagen, Denmark) to manufacture Gouda cheese. As standard chemicals, cholesterol, 5α-cholestane, n-alkane, undecane butanoic acid, hexanoic acid, octanoic acid, and decanoic acid were purchased from Sigma (St. Louis, MO, USA), and all solvents were gas chromatography grade.
Determination of milk fat
Determination of milk fat in bulk milk and cream was performed using the method of Gerber (milk and milk products, 2009). Into a butyrometer, 10 mL of H2SO4 (92% w/v), 11 mL of milk and 1 mL of isoamyl alcohol were added, respectively. Then the butyrometer was capped with rubber cap and was shaked vigorously until all particles were melted. Next the butyrometer was placed in water bath set at 60°C for 15 min and centrifuged for 5 min at 1,200 rpm. Separated milk fat was determined using divider.
Preparation of crosslinked β-CD
The crosslinked β-CD was made according to the method of Han et al. (2007). A 80 g of β-CD powder was dissolved in 100 mL of distilled water and placed in a stirrer with constant agitation at a room temperature for 2 h. Then 5 g of adipic acid was added and the pH was adjusted to pH 10 using 1 N NaOH. The β-CD solution was stirred again with constant agitation at a room temperature for 90 min. Finally it was adjusted to pH 5 by acetic acid. To recover the crosslinked β-CD powder, β-CD solution was filtered through Whatman paper no 2 and washed three times with distilled water. Then the collected powder was dried at 60°C in Lab line mechanical convention oven (O-SUNG Scientific Co., Seoul, Korea) for 20 h and passed through a 100-mesh sieve (150 μm).
Milk treatment and cholesterol removal
Bulk raw milk (milk fat: 3.8%) was pasteurized at 65°C for 30 min for control and sample cheeses, and cream was separated at 50°C using a cream separator (CE Elecrem, Vanves France) for sample cheese. Separated cream was stirred with a crosslinked β-CD (10% of amount of cream) at 1,400 rpm with a blender (Tops, Misung Co., Seoul, Korea) in a thermostatic water bath at 40°C for 30 min. To separate out cholesterol-entrapped β-CD from cream, the cream was centrifuged at 166×g for 10 min. The cholesterol-removed cream was reconstituted with skim milk at 70.4 kg/cm2 (HC 5000, Microfluids Corp., Newton, MA, USA) (Seon et al., 2009).
Manufacture of Gouda cheese
Gouda cheeses as control and sample were produced using the method described by Kosikowski and Mistry (1997). The cholesterol removed milk (115 L) was warmed to 32 to 33°C. A frozen concentrated direct vat set mesophilic lactic acid starter culture (CHN 11, strain Lactococcus lactis) was added to the milk. After 90 min, 23 mL of rennet (diluted 1:3) (Chr. Hansen’s Lab., Copenhagen, Denmark) was added to milk sample. Milk was then stirred quickly for 3 min and set to coagulate at 32 to 33°C for 45 min and the curd was cut (titratable acidity = 0.12% (w/w) lactic acid) in size of 1×1×1 cm, and mixture of curd and whey were gradually stirred. After stirring, the temperature of curd-whey mixture was gradually increased to 37°C. After 30 min of cooking, whey (10% of the volume of the milk) was partially removed and replaced by the equal volume with water of same temperature to reduce lactose and for control lactic acid production during the manufacturing process. The curd-whey mixture was stirred for 30 min at the cooking temperature. After draining, the curd was transferred to the small vat for prepress. The prepress was done for 30 min at 1.5 Bar. The curds were put into wheel-shaped plastic moulds. The curds were pressed at 3 Bar for 20 h with 2 to 3 h interval. The next morning, the fresh cheese was brined in a 20% (w/w) brine solution at 14°C for 8 h. After draining-off from the brine and drying, the cheese was ripened at 14°C for 6 months with a relative humidity of 85%. Samples for analysis were periodically taken at 0, 1, 2, 3, 4, 5, and 6 months of ripening.
Chemical composition and yield of cheese
Moisture and protein were analyzed using the methods of the Association of Official Analytical Chemists (AOAC, 1984). Fat content in cheese was determined by the method described by the British Standards Institution (BSI, 1969) using a milk butyrometer. Yield was calculated as weight of cheese×100/weight of milk.
Cholesterol measurement
To quantify cholesterol from cheese samples, a method of Adams et al. (1986) was used and the working conditions were as follows. One g of ground cheese sample was placed in a screw-capped glass tube (15 mm×180 mm), and 1,000 ppm of 5α-cholestane was added as an internal standard. The sample was saponified at 60°C for 30 min with 5 mL of 2 M KOH (w/v). After cooling to room temperature, cholesterol was extracted with 5 mL of hexane. This process was repeated 4 times. The hexane layers were transferred to a round-bottomed flask and dried under vacuum. The extract was redissolved in 1 mL of hexane and was stored at −20°C until analysis. All experiments were performed in triplicate. Quantification of cholesterol was done by comparing the peak areas with a response of an internal standard. The percentage of cholesterol reduction was calculated as follows: cholesterol reduction (%) = 100 –(amount of cholesterol in crosslinked β-CD-treated cheese ×100/amount of cholesterol in control).
Analysis of FFA
Well-ground Gouda cheese samples (1 g) were removed periodically from the cheeses after 0, 1, 2, 3, 4, 5, and 6 months, extracted with 5 mL of diethyl ether, 2.5 g of sodium sulfate and 0.1 mL of 4 N H2SO4 for 2 h. and eluted through a 10 mm i.d. glass column containing 1 g of deactivated alumina (alumina oxide neutral was deactivated with 0.24% distilled water., as described by Kwak et al. (1990). All experiments were performed in triplicate. Each peak was quantified by the retention time of reference standards.
Texture profile analysis
Cube-shaped samples (1.5 cm3) of each cheese at each stage of ripening were cut from the central part of the cheese. Textural properties, such as hardness, cohesiveness, springiness, gumminess, and chewiness of the cheese, were measured with a TMS-Pro Texture Analyser (Food Technology Co., VA, USA) according to the method of Kanawjia et al. (1995).
Color measurement
Color values were compared between the control and the cholesterol-reduced cheese using a colorimeter (Minolta CT-310, Tokyo, Japan) after calibrating its original value with a standard plate. Measured L*, a*, and b* values were used as indicators of lightness, redness, and yellowness, respectively. All samples were measured ten times (Lee et al., 2011).
Sensory analysis
The panel was trained using the methods of Lee et al. (2009). The sensory evaluation of control and cholesterol-reduced cheese was performed with 12 judges selected from graduate students of the Department of Food Science and Technology in Sejong University, Seoul, Korea. Three 1-hr training sessions were held for attributes development, definitions and panel training. The end of the session, sensory attributes were established: 2 appearance attributes, 5 aroma attributes, 6 flavor and tastes attributes, and 6 texture attributes. Standards used to define these aroma and taste descriptors were present during training and sensory evaluation.
Before each session, the Gouda cheese which was purchased from the manufacturing company was presented in order to familiarize the sensory properties of the cheese. The judges scored each attribute on a scale of 0 to 9, in which 9 was the highest intensity and 0 was none. Two cheese samples were used for the sensory evaluation. Samples were stored at 7°C prior to assessment. Rind was cut-off and cheeses were cut into cube-shaped (1 cm3) (Kraggerud et al., 2008; Lee et al., 2011). In each session, the order of assessment of the sample was randomized, also with respect to the age of the cheese. The scores of each sample were averaged over all assessors. The sensory evaluation was performed in duplicate.
Statistical analysis
All statistical analyses were performed using SAS version 9.0 (SAS Institute, Cary, NC, USA). An ANOVA was performed using the general linear models procedure to determine significant differences among the samples. Means were compared by using Duncan’s multiple range test (p<0.05). And XLSTAT ver. 2011 (Addinsoft, New York, NY, USA) was used for principal component analysis (PCA).
RESULTS AND DISCUSSION
Chemical composition
The chemical composition, cheese yield, and cholesterol contents of the CRGC and control are described in Table 1. The fat and protein contents have no significant difference between the CRGC and control. However, the moisture content in CRGC was higher than that of Gouda cheese. It is considered that treatment of β-CD leads to the increase of slow curd drainage usually observed in reduced-fat Cheddar cheese (Metzger and Mistry, 1994). Higher moisture content leads to relative low level of fat and protein contents in CRGC. However, no significant difference was observed in both cheeses (p<0.05). This means that crosslinked β-CD did not alter size of fat globules; therefore, no fat was released during manufacturing of the cholesterol-removed Gouda cheese. The cholesterol removal was 90.5% which was quite similar to that of Cream cheese (Kwak et al., 2005).
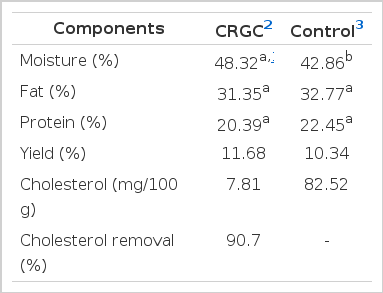
Mean chemical composition of cholesterol-removed Gouda cheese and control
Short-chain free fatty acids
The evolution of SCFFAs during 6 months of ripening is shown in Table 2. It is well known that the production of free fatty acids is considered to be an important aspect in the ripened cheese. Among free fatty acids, SCFFAs (C4 through C10) contribute directly to aroma in many aged cheeses (Ha and Lindsay, 1991; Najera et al., 1994; Urbach, 1997). The release of butyric acid (C4) and capric acid (C10) contributed to the increase in total level of SCFFAs. However, a small amount of caproic acid (C6) and caprylic acid (C8) was released during the ripening. At 0 month, the total concentration of SCFFAs was 13.02 in CRGC and 13.64 ppm in control. And their levels significantly increased to 69.60 in CRGC and 56.69 ppm in control at 6 month (p<0.05). The total level of SCFFAs in control was higher than in CRGC at early stage of ripening, while opposite pattern was shown thereafter up to 6 months. Regarding differences between control and CRGC for SCFFAs production, it is considered that small particles of fat due to homogenization in β-CD treated cheese milk can be easily released from cheese curds in the manufacture process (Seon et al., 2009), however, the loss of SCFFAs was not observed.
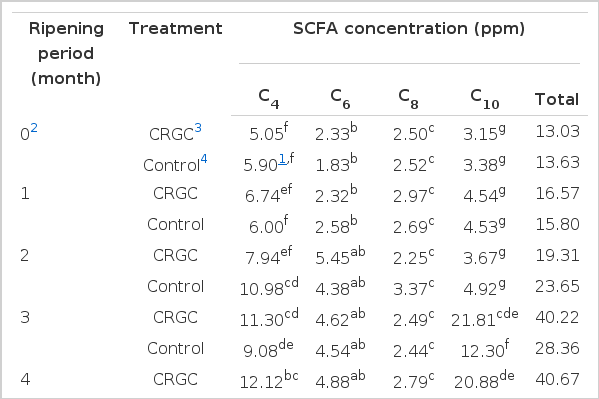
Concentration of short-chain free fatty acids (SCFA) in cholesterol-removed Gouda cheese and control ripened at 14°C for 6 months
Texture profile analysis
The changes in the texture profile of CRGC and control in terms of hardness, cohesiveness, gumminess, springiness, and chewiness during 6 months of ripening are shown in Table 3. Regarding hardness, the CRGC showed a significant and continuous increase during the ripening from 5.20 to 66.40 N2, and the control also had similar patterns from 7.37 to 59.65 N2 for 6 months. There was a significant difference between CRGC and control until 3 months of ripening (p<0.05). Cohesiveness value in CRGC was stable up to 3 months and decreased thereafter in control. Regarding gumminess, the increase was observed in CRGC from 3.76 to 47.27 N and in control from 5.31 to 38.74 N. Gumminess properties in CRGC and control showed significant increase during ripening period of 6 months. Springiness values in CRGC and control were significantly decreased during the ripening period (p<0.05). Regarding chewiness, the CRGC showed increase during the ripening from 2.99 to 32.49 J×10−3 and the control showed a similar pattern from 4.36 to 26.21 J×10−3. Based on these results, CRGC had no adverse effects compared to control on texture properties during 6 months of ripening.
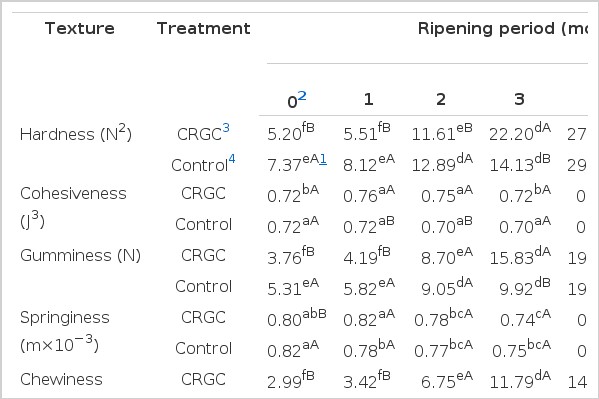
Texture properties of cholesterol removed Gouda cheese and control ripened at 14°C for 6 months
Color measurement
Table 4 shows the changes in color of CRGC and control in terms of lightness L*, redness b*, and yellowness a* during 6 months of ripening. Regarding the L* value, a significant difference was observed between control and CRGC until 3 months of ripening (p<0.05). The effect of ripening time on decreasing the L* value from 83.36 (control) and 87.38 (CRGC) at 0 month, 79 to 72.09 (control) and 75.52 (CRGC) at 6 months, respectively, were noticed. The a* value showed a significant difference between two cheese samples until 6 months of ripening (p<0.05). As they ripened, a significant increase of a* values from 2.21 (control) and 1.65 (CRGC) to 3.50 (control) and 3.55 (CRGC) was observed (p<0.05). Yellowness, b*, showed significant difference at 0 to 3 months ripening and there was no significant difference during the rest of ripening period (p>0.05). The ripening influenced the increase of b* value from 9.19 (control) and 7.35 (CRGC) to 10.09 (control) and 11.04 (CRGC), respectively. It is well known that a change in color may be due to chemical changes occurred during ripening (El-Nimr et al., 2010). According to Kumar et al., cheese is a biologically and biochemically dynamic product in which series of sequential changes take place through its manufacture and ripening (Kumar et al., 2006). According to Rohm and Jaros (1996), Gouda cheese changes color as ripening time increases resulting in a decrease of L* value and increases of a* and b* values. Buffa et al. (2001) reported that the a* value did not show a definite trend, while the L* value decreased and the b* value increased during ripening. Based on the results of color analysis, the color characteristics were influenced by ripening and there was no significant difference between two cheese samples during ripening.

Changes in color of cholesterol-removed Gouda cheese and control ripened at 14°C for 6 months
Sensory analysis
A total of 20 descriptors were developed in the training session for sensory analysis: 2 for appearance property, 5 for aroma property, 6 for flavor and taste properties, and 6 for texture property. The sensory evaluation of CRGC and control was carried out during 6 months of ripening at 14°C by 12 trained panels using 9 point scales at 0, 1, 2, 3, 4, 5, and 6 months as shown in Table 5. In appearance properties, ‘yellowness’ and ‘dryness’ in control had higher scores compared to CRGC at 0 month of ripening. In a previous study, it was reported that water activity (aw) decreased in all cheeses with increasing during ripening periods for 60 days (El-Nimr et al., 2010). Significant differences were observed during ripening (p<0.05). As ripening progresses, these scores tended to increase and showed no significant difference between CRGC and control (p>0.05). Attributes, such as ‘butyric’, ‘fruity’, and ‘musty’, showed significant differences in score by panelists. However, ‘buttery’ tended to decrease during ripening and ‘nutty’ showed no difference in scores. And there was no significant difference between CRGC and control during ripening (p>0.05). In flavor and taste properties, all descriptors except ‘sweet’ tended to increase during ripening, while ‘sweet’ showed no significant difference in scores (p>0.05). In texture properties, most attributes with the exception of ‘springiness’ showed a gradual increase during ripening, while ‘springiness’ tended to decrease. And no significant difference was found in control and CRGC during ripening (p>0.05). As expected, ripening process seemed to give a clear effect on the sensory properties of Gouda cheese (Van Leuven el al., 2008) and it was considered that there was no adverse effects on CRGC compared to control.
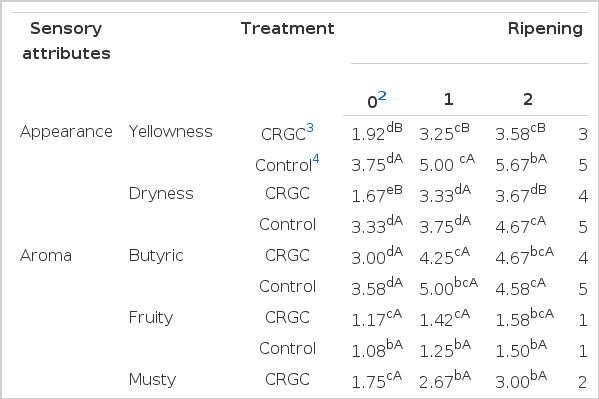
Comparison of sensory analysis in cholesterol-removed Gouda cheese and control ripened at 14°C for 6 months
CONCLUSIONS
This study was performed to compare the physicochemical and sensory properties of cholesterol-removed Gouda cheese (CRGC) and control during ripening. In chemical composition, similar results were observed between CRGC and control. The cholesterol removal of CRGC was 90.7%. The total concentration of SCFFA in CRGC and control significantly increased during ripening. In texture analysis, CRGC had no adverse effects compared to control. Hardness, gumminess, and chewiness showed significant increase during ripening. The color characteristics were influenced by ripening and there was no significant difference between CRGC and control. L* value decreased, while a* and b* values tended to increase significantly. In sensory evaluation, appearance properties including yellowness and dryness increased significantly. Aroma properties including butyric, fruity, and musty tended to increase, while buttery and nutty showed no difference statistically. Flavor and taste properties including butyric, nutty, sour, salty, bitter, and after taste increased significantly during the ripening. In conclusion, CRGC showed similar acceptability and physicochemical properties compared to control and showed the possibility of being a healthier alternative to traditional Gouda cheese.
Acknowledgements
The present study was supported by a grant from Korea Institute of Planning and Evaluation for Technology in Food, Agriculture, Forestry and Fisheries in Gyeonggi-Do, Republic of Korea.