Effects of Dietary Electrolyte Balance on Growth Performance, Nitrogen Metabolism and Some Blood Biochemical Parameters of Growing Rabbits
Article information
Abstract
The effects of different dietary electrolyte balance (DEB) on growth performance, nitrogen (N) metabolism and some blood biochemical parameters were investigated in 2 to 3 months old growing rabbits. A total of 150 growing rabbits of 2 months age were randomly divided into five groups according to average body weight, with 30 rabbits in each group. The DEB levels of the five experimental diets were −154, −3.16, +201, +347, and +500 meq/kg of dry matter (DM), respectively. There was a 7-d adaptation period and a 23-d experimental period. The results showed that the DEB levels had a quadratic affect on the average daily feed intake (ADFI) (p<0.001). The greatest ADFI was achieved when the DEB level was +201 meq/kg DM. Fecal N (FN) content linearly decreased (0.047), while digestible N (DN), retained N (RN), efficiency of intake N converted into digestible N (DN/IN) and the efficiency of intake N converted into retained N (RN/IN) linearly increased with the DEB increase (0.020, 0.004, 0.021, and 0.049, respectively). Serum phosphorus (P) ion content linearly increased with the DEB increase (p = 0.036). The DEB had a quadratic relationship with serum anion gap (AG) (p = 0.002) and serum parathyroid hormone (PTH) content (p = 0.016). The DEB levels quadratically affected base excess (BE) in the plasma (p<0.001). In conclusion, the DEB unaffected growth performance but affected feed intake, N metabolism and some blood biochemical parameters of growing rabbits.
INTRODUCTION
Mineral requirements of rabbits has been recently reviewed (Mateos et al., 2010), but there was limited information on some macroelements of the diet. It is well known that the relationship between Na+, K+, and Cl−(the dietary electrolyte balance, DEB) affects animal performance. The relationship between DEB and growth or production in poultry, swine and cows had been studied extensively (Melliere and Forbes, 1966; Madubuike, 1980; Mongin, 1981; Yen et al., 1981; Hu et al., 2007; Oba et al., 2011). Much less was known about the effect of the DEB on the reproductive response of does and bucks and there are few data on the zootechnical performance or acid-base status of growing rabbits (Chiericato and Rizzi, 2003). Chiericato and Rizzi (2004) found that increasing the DEB of breeding rabbit diets from 270 to 350 meq/kg tended to increase the mortality rate of does at farrowing, but did not affect milk production or feed intake up to 21 days of lactation. Similarly, Rizzi et al. (2005) did not observe any effect on the performance of bucks during three reproductive cycles with electrolyte balances of 270 or 350 meq/kg diets. No information on variation of this balance on the productivity of growing rabbits was available. The physiological status and feeding strategies of rabbits are different from those of poultry, swine and cows. Therefore, the present study was planned to examine the effect of varying levels of the DEB on the growth performance, nitrogen (N) metabolism and some blood biochemical parameters of growing rabbits.
MATERIALS AND METHODS
Animals and diets
A total of 150 2-month-old growing rabbits (male: female ratio 1:1) with average body weight of 1,656±120 g were used in this study. All rabbits were randomly divided into five groups, 30 in each group (15 males and 15 females), and were fed with different experimental diets.
The diets were formulated according to the requirement of growing rabbits recommended by NRC (1977) and de Blas and Mateos (2010). The DEB was the difference between milliequivalents of certain cations (Na, K) and anion (Cl) in the complete feed and was calculated with the following equation (Mongin, 1981; Austic and Clevert, 1981): DEB = Na+K−Cl meq/kg DM. Five diets were formulated to have −154, −3.16, +201, +347, and +500 meq/kg DM of DEB, respectively (Table 1). The DEB levels were attained by using NaHCO3 and CaCl2. The feed was pelletized into 4 mm diameter. The rabbits were housed in individual cages (60×40×40 cm) and had free access to drinking water. During the trial, the rabbits were housed in a closed and ventilated building in which the maximum temperature was 15°C, the minimum temperature was 5°C and the relative humidity ranged from 50% to 60%. A cycle of 12 h of light and 12 h of dark was used throughout the trial.

Ingredients and chemical composition of the experimental diets
Experimental procedures
The trial lasted 30 days with a 7-d adaptation and a 23-d experimental period including a 3-d (the last 3 days) successive collection of feces, urine and blood samples. At the end of the trial, 40 rabbits (8 rabbits per group, 4 males and 4 females, and the average body weight of the 8 rabbits equaled to the average body weight of entire treatment group) were selected for the determination of N metabolism and blood plasma or serum parameters. The feed was offered ad libitum and refilled at 8:30 and 17:30 daily, meanwhile the residual feed was collected from the feeder. Feces, urine and residual feed were collected in the metabolism cages. Feces were collected separately each day, then weighed and mixed thoroughly. A portion of about 250 g feces samples put into plastic bottle and stored at −20°C. Fecal samples were dried at 60°C and ground to pass a 1 mm screen before further analysis. Urine was collected separately into plastic barrel and acidified with 20 mL/L (v/v) H2SO4 (95%). After weighing and stirring the urine collected daily, a portion of about 150 mL urine was sampled into a plastic bottle and stored at −20°C.
All rabbits were weighed at the beginning (d 60) and at the end (d 90) of the experimental period. The average daily weight gain (ADG) and average daily feed intake (ADFI) were recorded and the feed to gain (F/G) ratio was calculated.
Two arterial blood samples were taken from the central ear artery and collected at 16.00 h in the successive 3 sampling days at the end of the experimental period. About 5 mL of blood was collected into a heparinized tube. Plasma was extracted and the pH value, HCO3− concentration, partial pressure of CO2 (pCO2) and O2 (pO2), total CO2 concentration and base excess (BE) were determined immediately. Another 10 mL of blood samples were kept in the dark at room temperature for 30 min and then centrifuged at 1,000×g for l0 min. The serum was placed into an Eppendorf tube and cryopreserved at −20°C for later use.
Chemical analyses
Nitrogen (N) contents of feed, faces and urine samples were determined by the Kjeldahl method (AOAC, 1990).
Contents of Na and K in feed samples were determined by atomic absorption spectrometry (361 CRT, Lengguang analytical instruments Co. Ltd., Nanjing, China) (Jackson et al., 1992). Contents of Cl in feed samples were determined via thiocyanate inverse titration (Cotlove et al., 1958).
The ion contents of Na, K, Ca, P, Cl and anion gap (AG) in the serum were determined by the electrolyte analyzer (XD-687, Shanghai Xunda Co. Ltd., Shanghai, China). Contents of amino acids in the serum were determined by Hitachi automatic amino acid analyzer (835–50, Tokyo, Japan). Parathyroid hormone (PTH), thyrocalcitonin (CT) and bone Gla-containing protein (BGP) contents in the serum were determined by a radioimmunoassay procedure (the tracer was 125I). Test kits were purchased from Tianjin Xiehe Hospital Biotech. Co. Ltd., and the γ arithmometer (DFM-96) used was produced by Hefei Zhongcheng Electromechanical Technology Exploration Co. Ltd and validated according to the manufacturer’s protocol using a rabbit-specific ELISA kit for PTH, CT, and BGP. All assays were performed in duplicate. The intra- and interassay CV were 6% and 10%, respectively, for PTH analyses, 5% and 9%, respectively, for CT and 9% and 11%, respectively, for BGP.
The pH value, HCO3− concentration, partial pressure of CO2 (pCO2) and O2 (pO2), total CO2 concentration and BE in the plasma were determined by an automated blood gas analyzer (ABL5, Radiometer medical APS, Copenhagen, Demark).
Statistical analysis
Linear and quadratic effects of the DEB levels on all parameters were analyzed by SAS using the regression procedures (SAS, 1985). Root mean square error (RMSE) and coefficient of determination (R2) were used to evaluate the goodness of fit for the different effects.
RESULTS AND DISCUSSION
The effect of dietary electrolyte balance on growth performance
Table 2 displays the effects of the DEB on growth performances. There was a quadratic effect of the DEB on the ADFI. The greatest ADFI (p<0.001) occurred in the rabbits fed the diet of +201 meq/kg DM of DEB. In addition, there was no effect on F/G and ADG among the treatments (p>0.05).
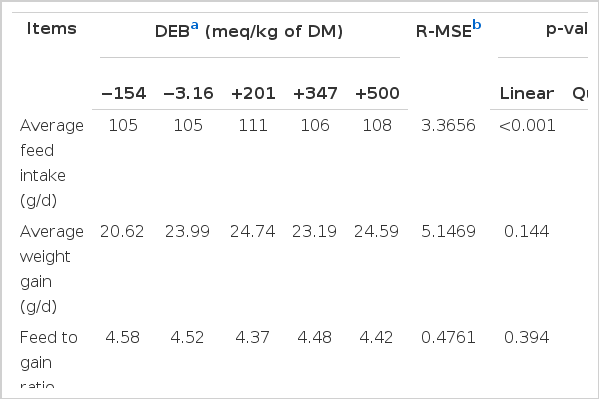
The effect of dietary electrolyte balance on the growth performance of experimental rabbits (n = 30)
As one of the important factors that influenced animal production performance, the DEB had a close relationship with animal growth performance. For normal growth and development and the best production performance, the diet must have an ideal electrolyte balance. In this study, the DEB varied from −154 to +500 meq/kg DM and unaffected the ADG and F/G of experimental rabbits. The ADG was lower (20–25 g/d) and F/G was higher (4.3 to 4.6), because we used crossbred rabbits from the mating of New Zealand white rabbits×local white rabbits and they were housed in a lower temperature.
The effect of dietary electrolyte balance on nitrogen metabolism
The effects of the DEB on N metabolism is shown in Table 3. The fecal N (FN) linearly decreased (p = 0.047), while digestible N (DN), retained N (RN), the efficiency of intake N converted into digestible N (DN/IN) and the efficiency of intake N converted into retained N (RN/IN) linearly increased with the DEB increase (p = 0.020, 0.004, 0.021, and 0.049, respectively). In addition, no effect was observed on N intake (IN), urinary N (UN) and the efficiency of digestible N converted into retained N (RN/DN) among the treatments (p>0.05).
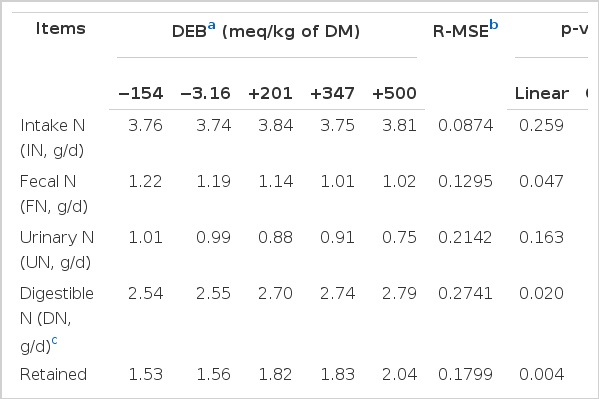
The effect of dietary electrolyte balance on the nitrogen metabolism of experimental rabbits (n = 8)
The DEB affects the utilization of nitrogen (N) and other nutrients by influencing the cation–anion balance of the body. Haydon et al. (1990) indicated that urinary N decreased and deposition efficiencies of intake N and digestible N of growing pigs increased with the increase of dietary DEB levels. In the present study, the fecal N linearly decreased, while the DN, DN/IN and RN/IN linearly increased with the DEB increase. So, the results of studies with different monogastric animals were similar.
The effect of dietary electrolyte balance on serum biochemical parameters
Table 4 displays the effects of the DEB on serum biochemical parameters measured in the present study. The serum P ion concentration linearly increased with the DEB increase (p = 0.036). There was a quadratic effect of the DEB on the serum anion gap. The greatest serum anion gap (p = 0.002) was observed in the rabbits fed with the diet of −3.16 meq/kg DM. There was a quadratic effect of the DEB on serum PTH contents. The greatest serum PTH content (p = 0.016) was observed in the rabbits fed with the diet of +500 meq/kg DM. In addition, no effect was observed on the other measured serum biochemical parameters among the treatments (p>0.05). Among the serum electrolytes (Na, K, Cl, Ca, P) examined in the study, only the concentration of serum P changed significantly among treatments.
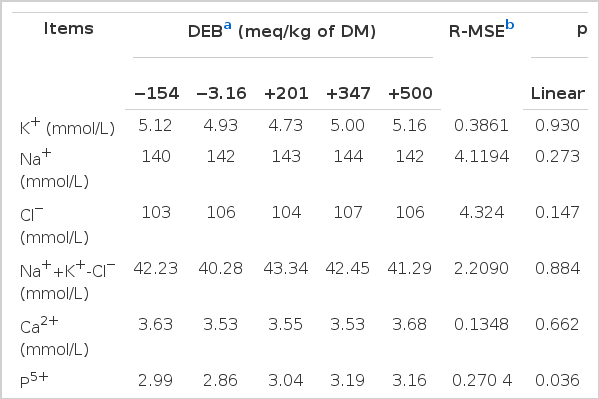
The effect of the DEB on serum relative traits of experimental rabbits (n = 8)
The PTH is a hormone that mobilizes Ca flow from bone stores and dietary sources into the blood while CT has a reverse effect. In the present study, a quadratic effect of the DEB on serum PTH contents occurred. BGP is a protein synthesized and secreted by osteoblast cells of the bones, and could be used as an indicator of the activity of bone mineral, mainly calcium metabolism. The difference of serum BGP among treatment was not significant in the present study. Because the difference of Ca metabolism between animals, the responses of blood PTH, CT and BGP concerned with Ca metabolism to the DEB or dietary cation-anion difference (DCAD) varied.
The effect of dietary electrolyte balance on plasma acid-base status
The effects of DEB on plasma acid-base status is shown in Table 5. It was found that the DEB quadratically affected BE in the plasma (p<0.001). The greatest plasma BE were observed in the rabbits fed with the diet of +500 meq/kg DM. In addition, no effect was observed on the other measured plasma acid-base status parameters among the treatments (p>0.05).
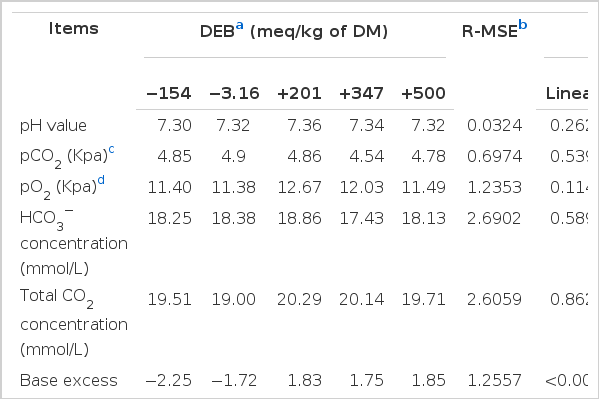
The effect of the DEB on plasma acid-base status of experimental rabbits (n = 8)
In the present study, the DEB levels affected BE in the plasma and unaffected the pH value, HCO3− concentration, pCO2, pO2 and total CO2 concentration in the plasma of the experiment rabbits. Patience et al. (1987) illustrated that the acid-base balance of growing pigs was affected by dietary electrolyte balance. Haydon et al. (1990) used 96 crossbred growing-finishing pigs to determine the effect of DEB on blood gases and found that blood pH, HCO3, total CO2 and BE excess increased linearly as dietary EB increased.
In conclusion, the DEB did not affect growth performance but affected feed intake, N metabolism and some blood biochemical parameters of growing rabbits.
Acknowledgements
This study was supported by the earmarked fund for Modern Agro-industry Technology Research System (CARS-44-B-1) and the Special Fund for Agro-scientific Research in the Public Interest (200903006).