 |
 |
| Anim Biosci > Volume 35(11); 2022 > Article |
|
Abstract
Objective
Methods
Results
Notes
CONFLICT OF INTEREST
We certify that there is no conflict of interest with any financial organization regarding the material discussed in the manuscript.
FUNDING
The authors are grateful to Rongjiang Shannong Development Co., Ltd for proving Qiandongnan Xiaoxiang chicken. The study was supported by the Basic Project of Guizhou Provincial Natural Science Foundation (Qian Kehe [2017]1205), Zunyi 15851 Talent Project (2050020213#), Zunyi City School Joint Fund (Zunshi Kehe [2018]No.08), the Rural Industrial Revolution Project of Guizhou Province (Zunshi he Rural Industry 201905), Zunshi Chi Shuihe Fund (Zunshi CSHKJ [2019]-01).
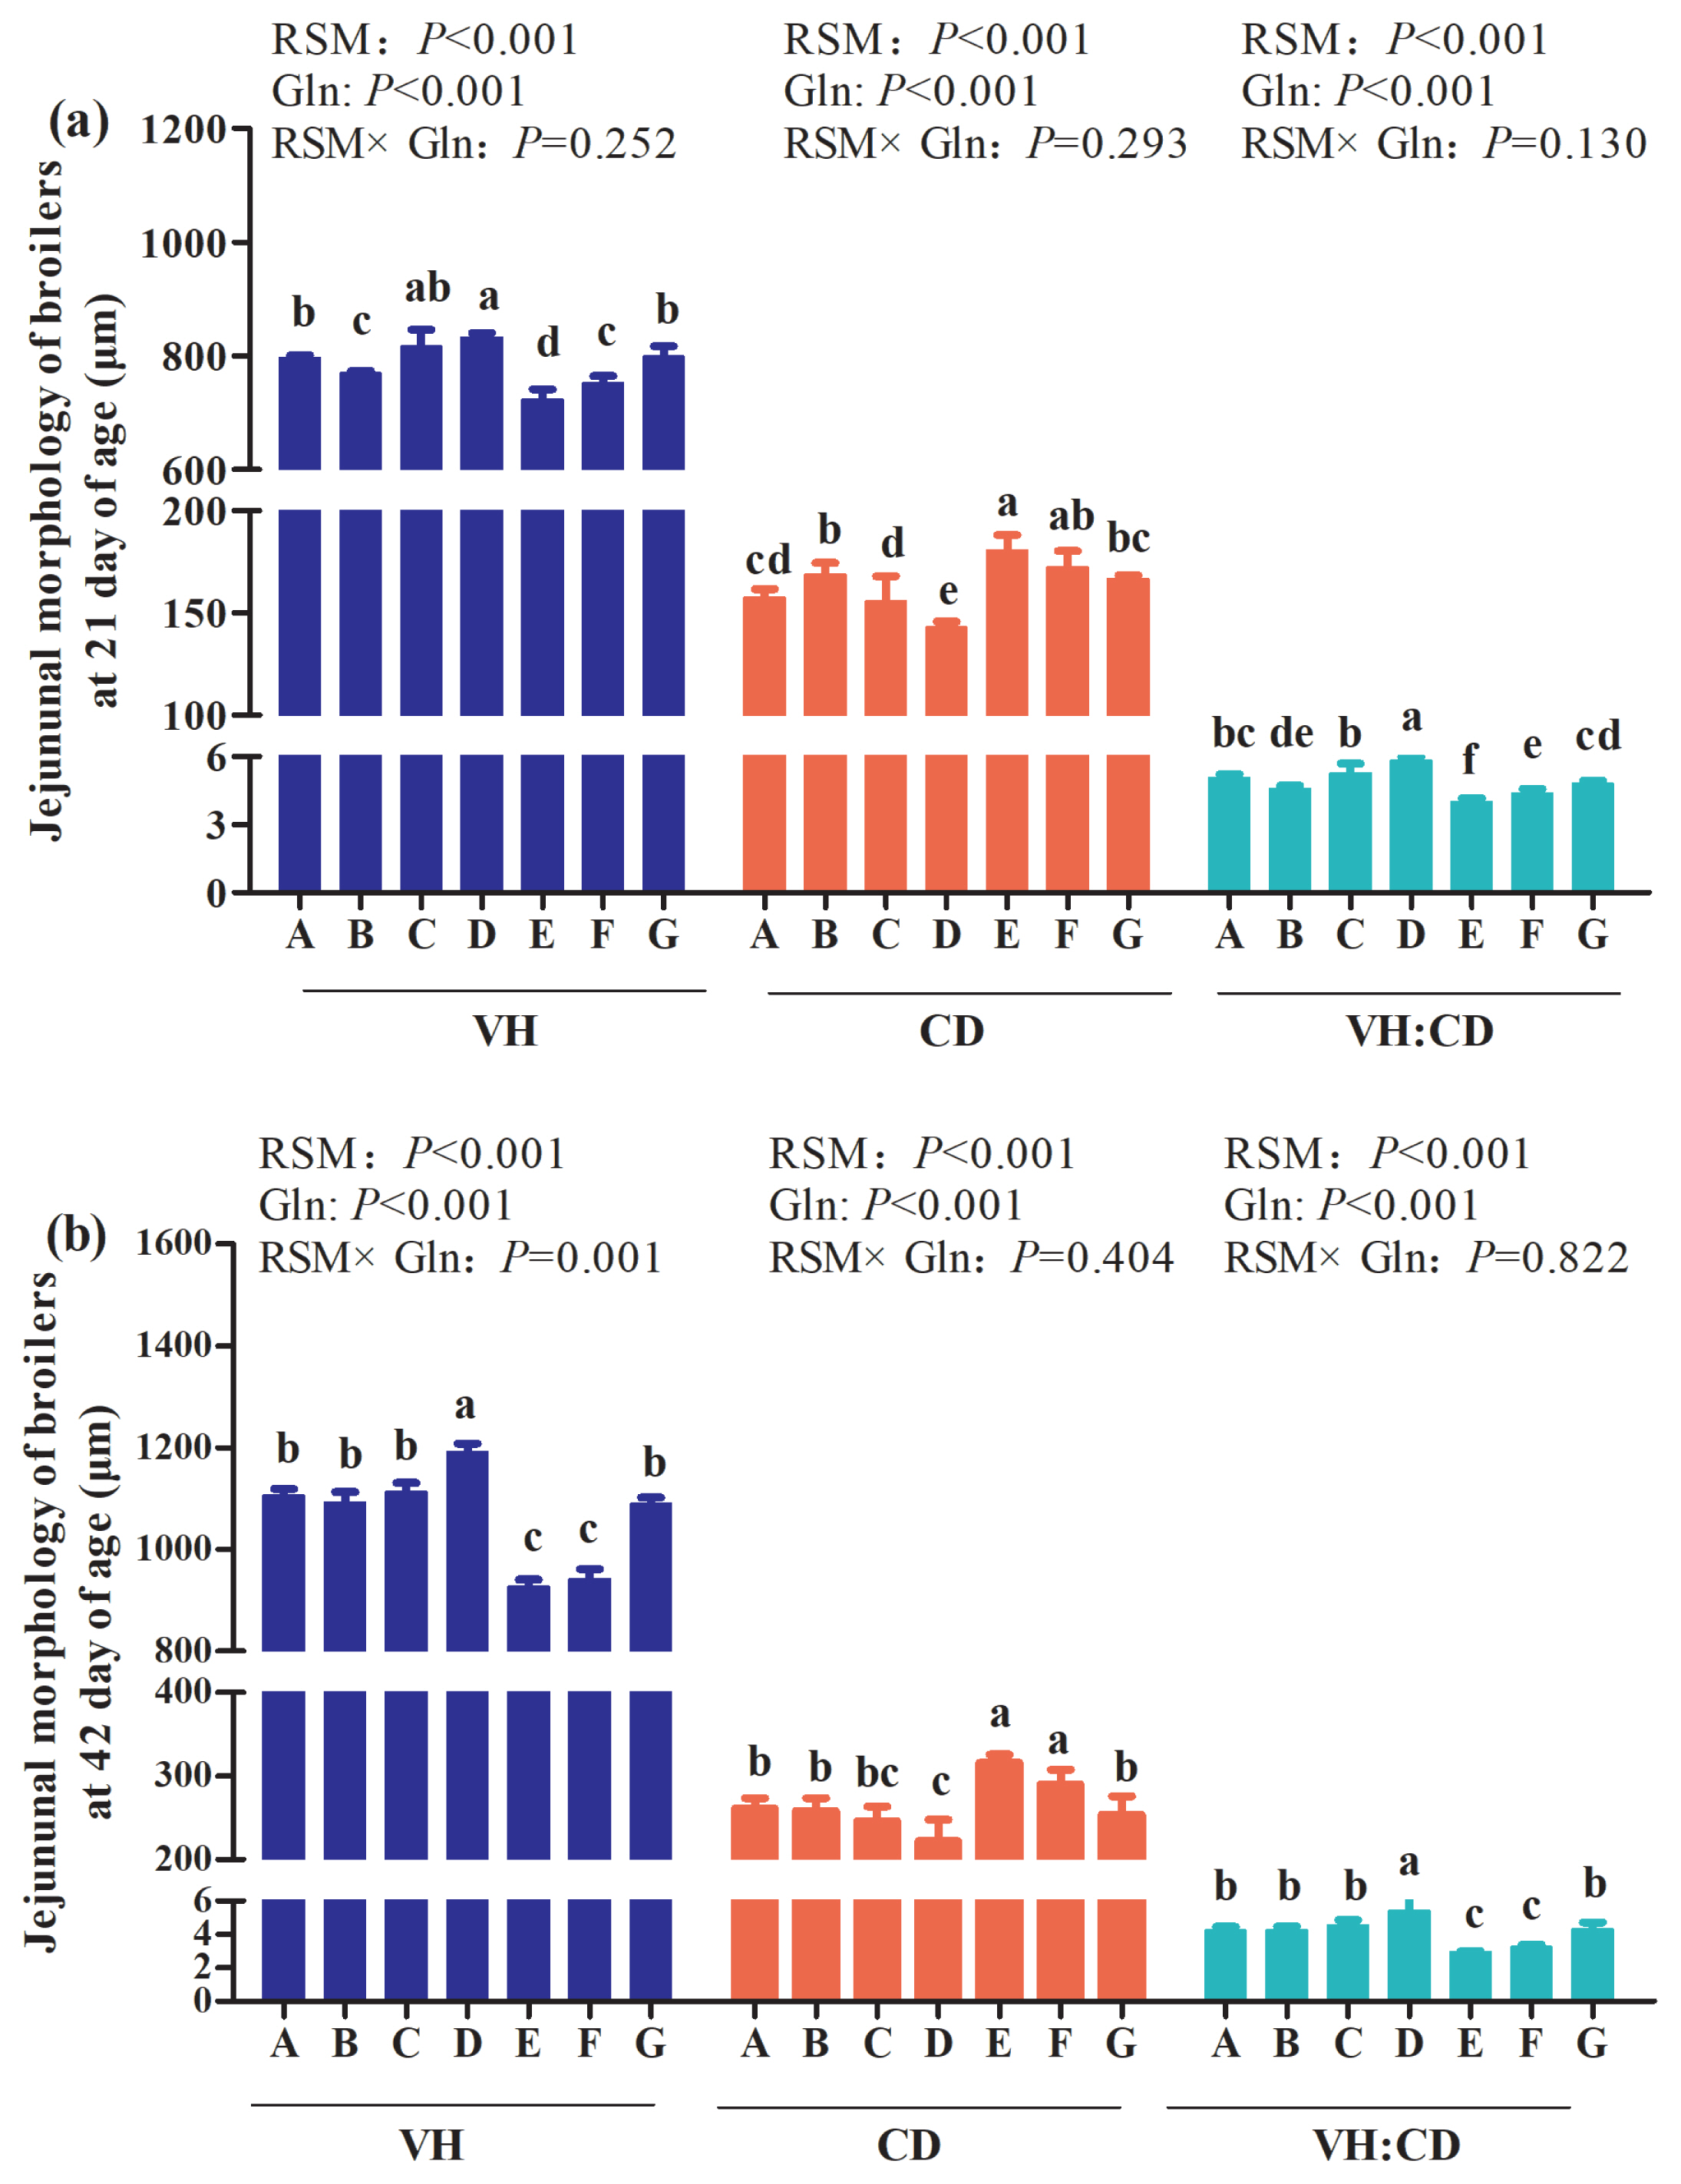
Figure 1

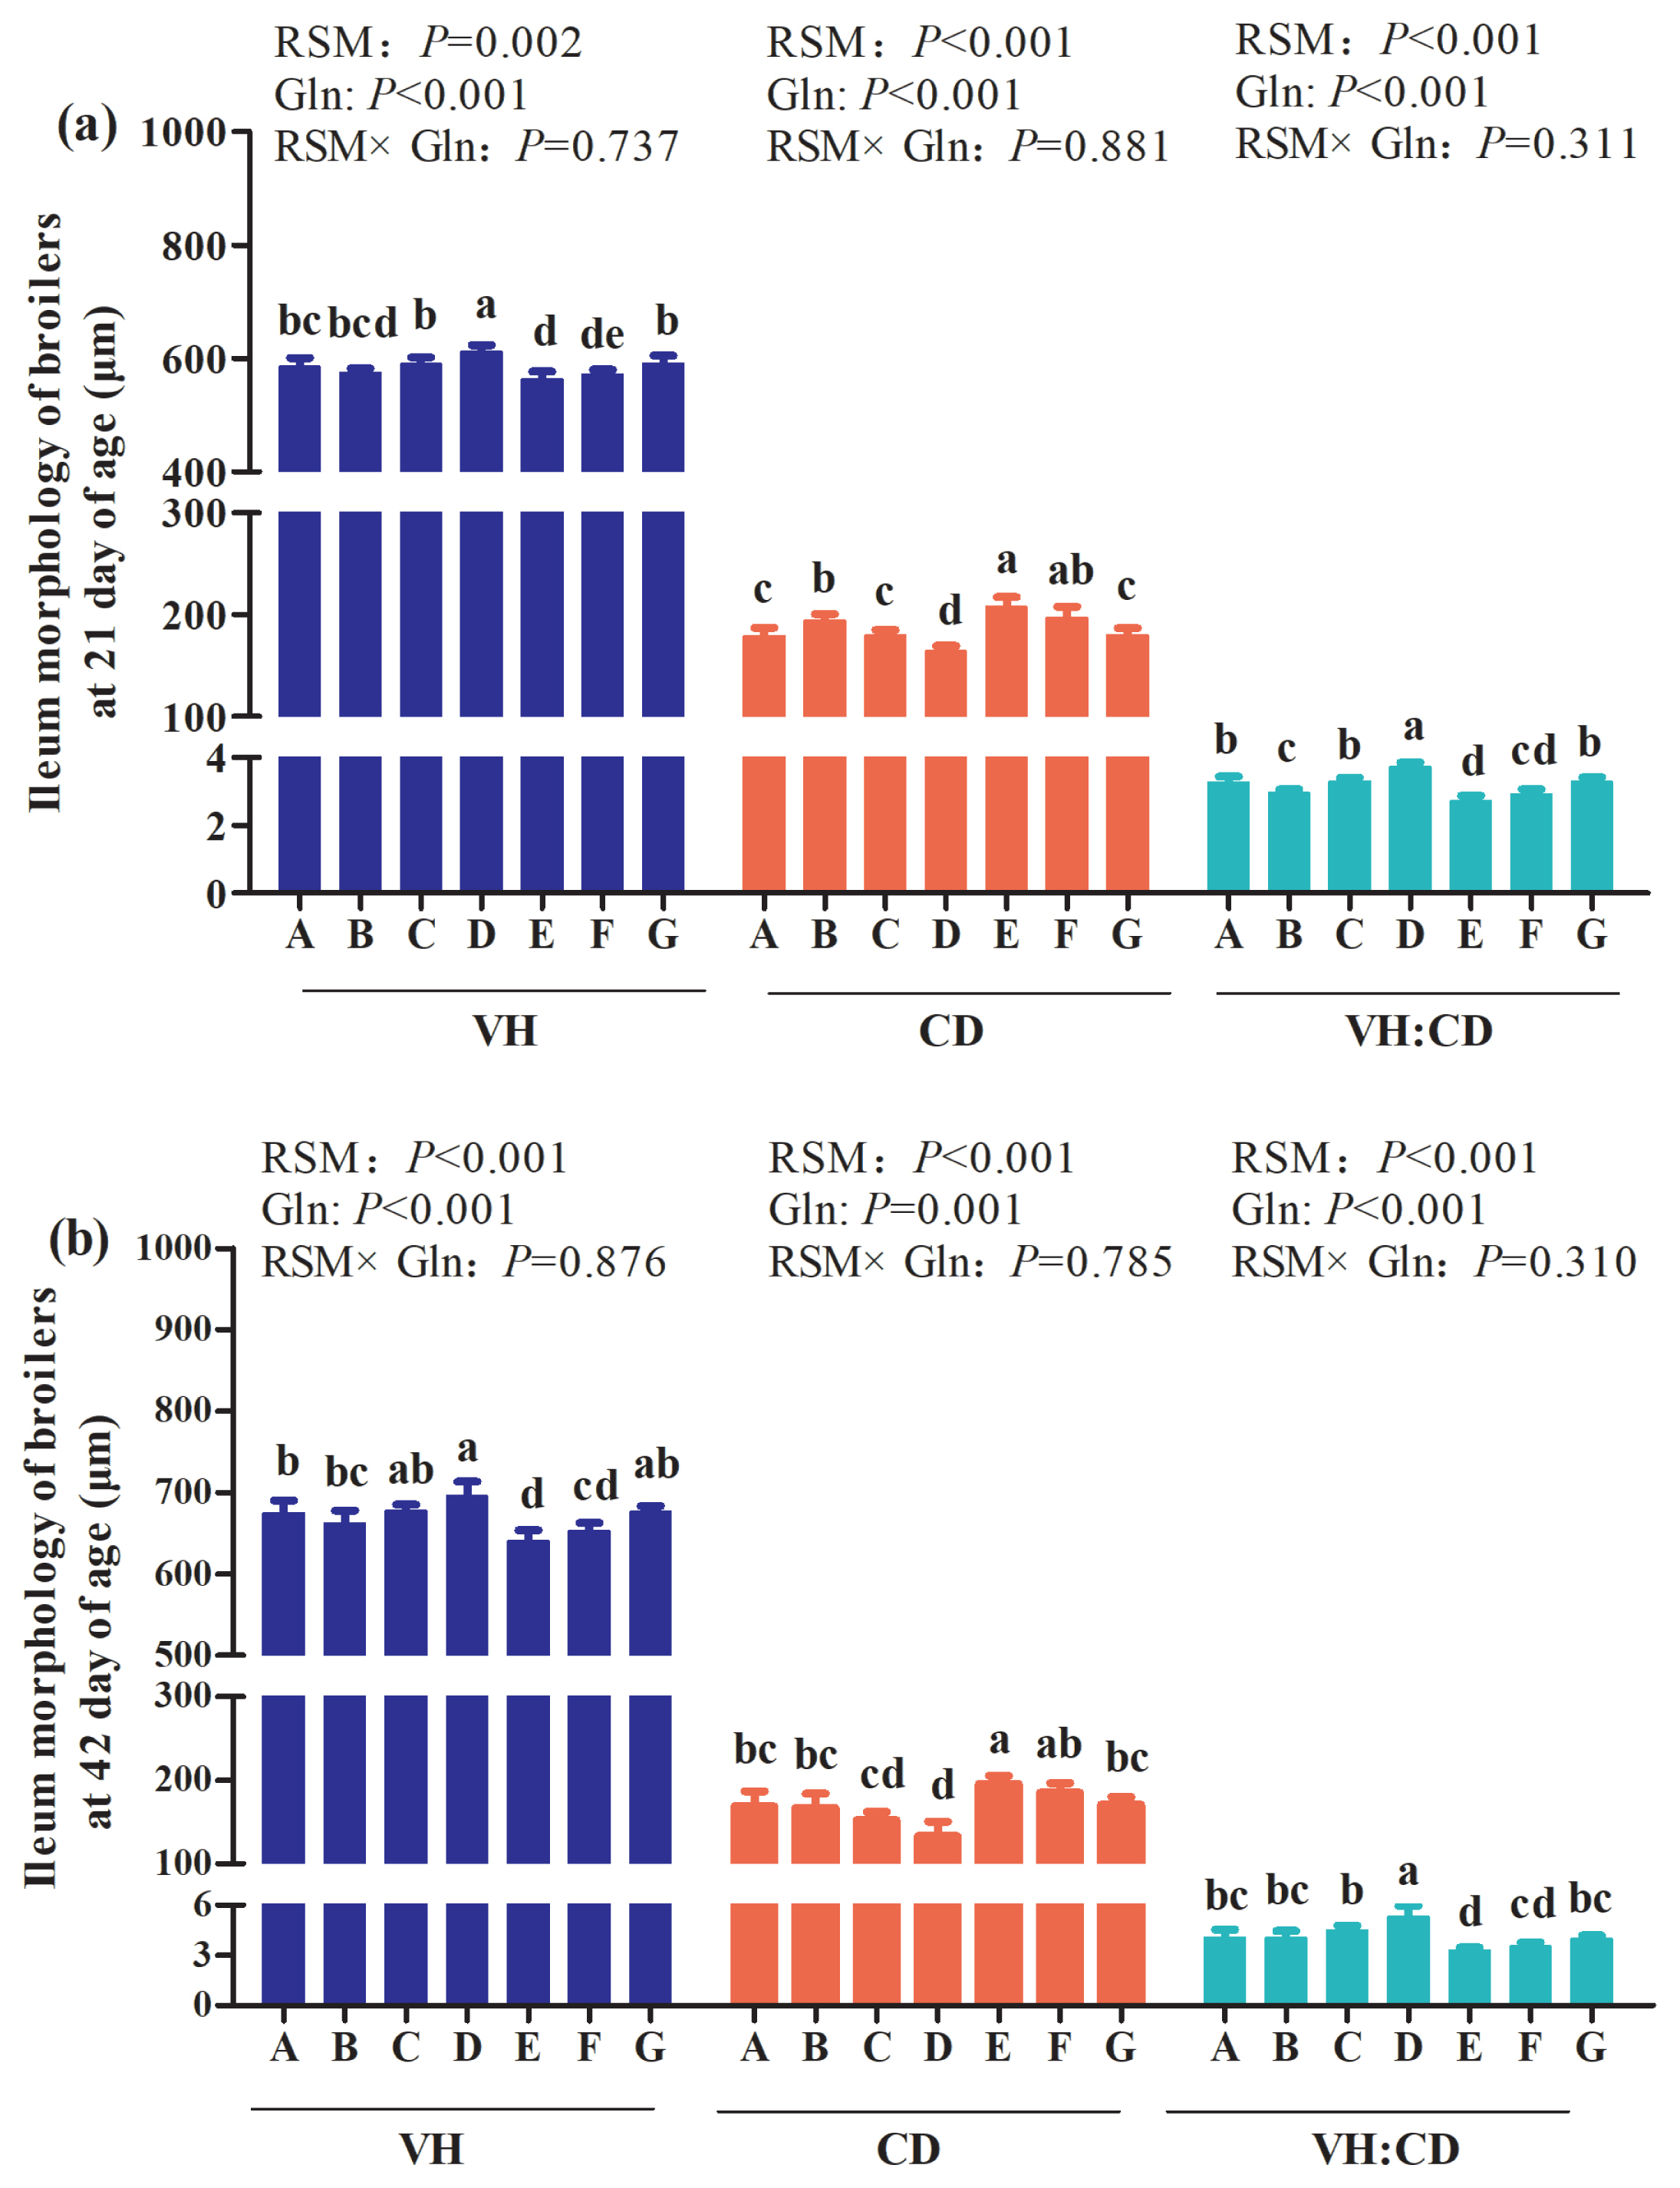
Figure 2

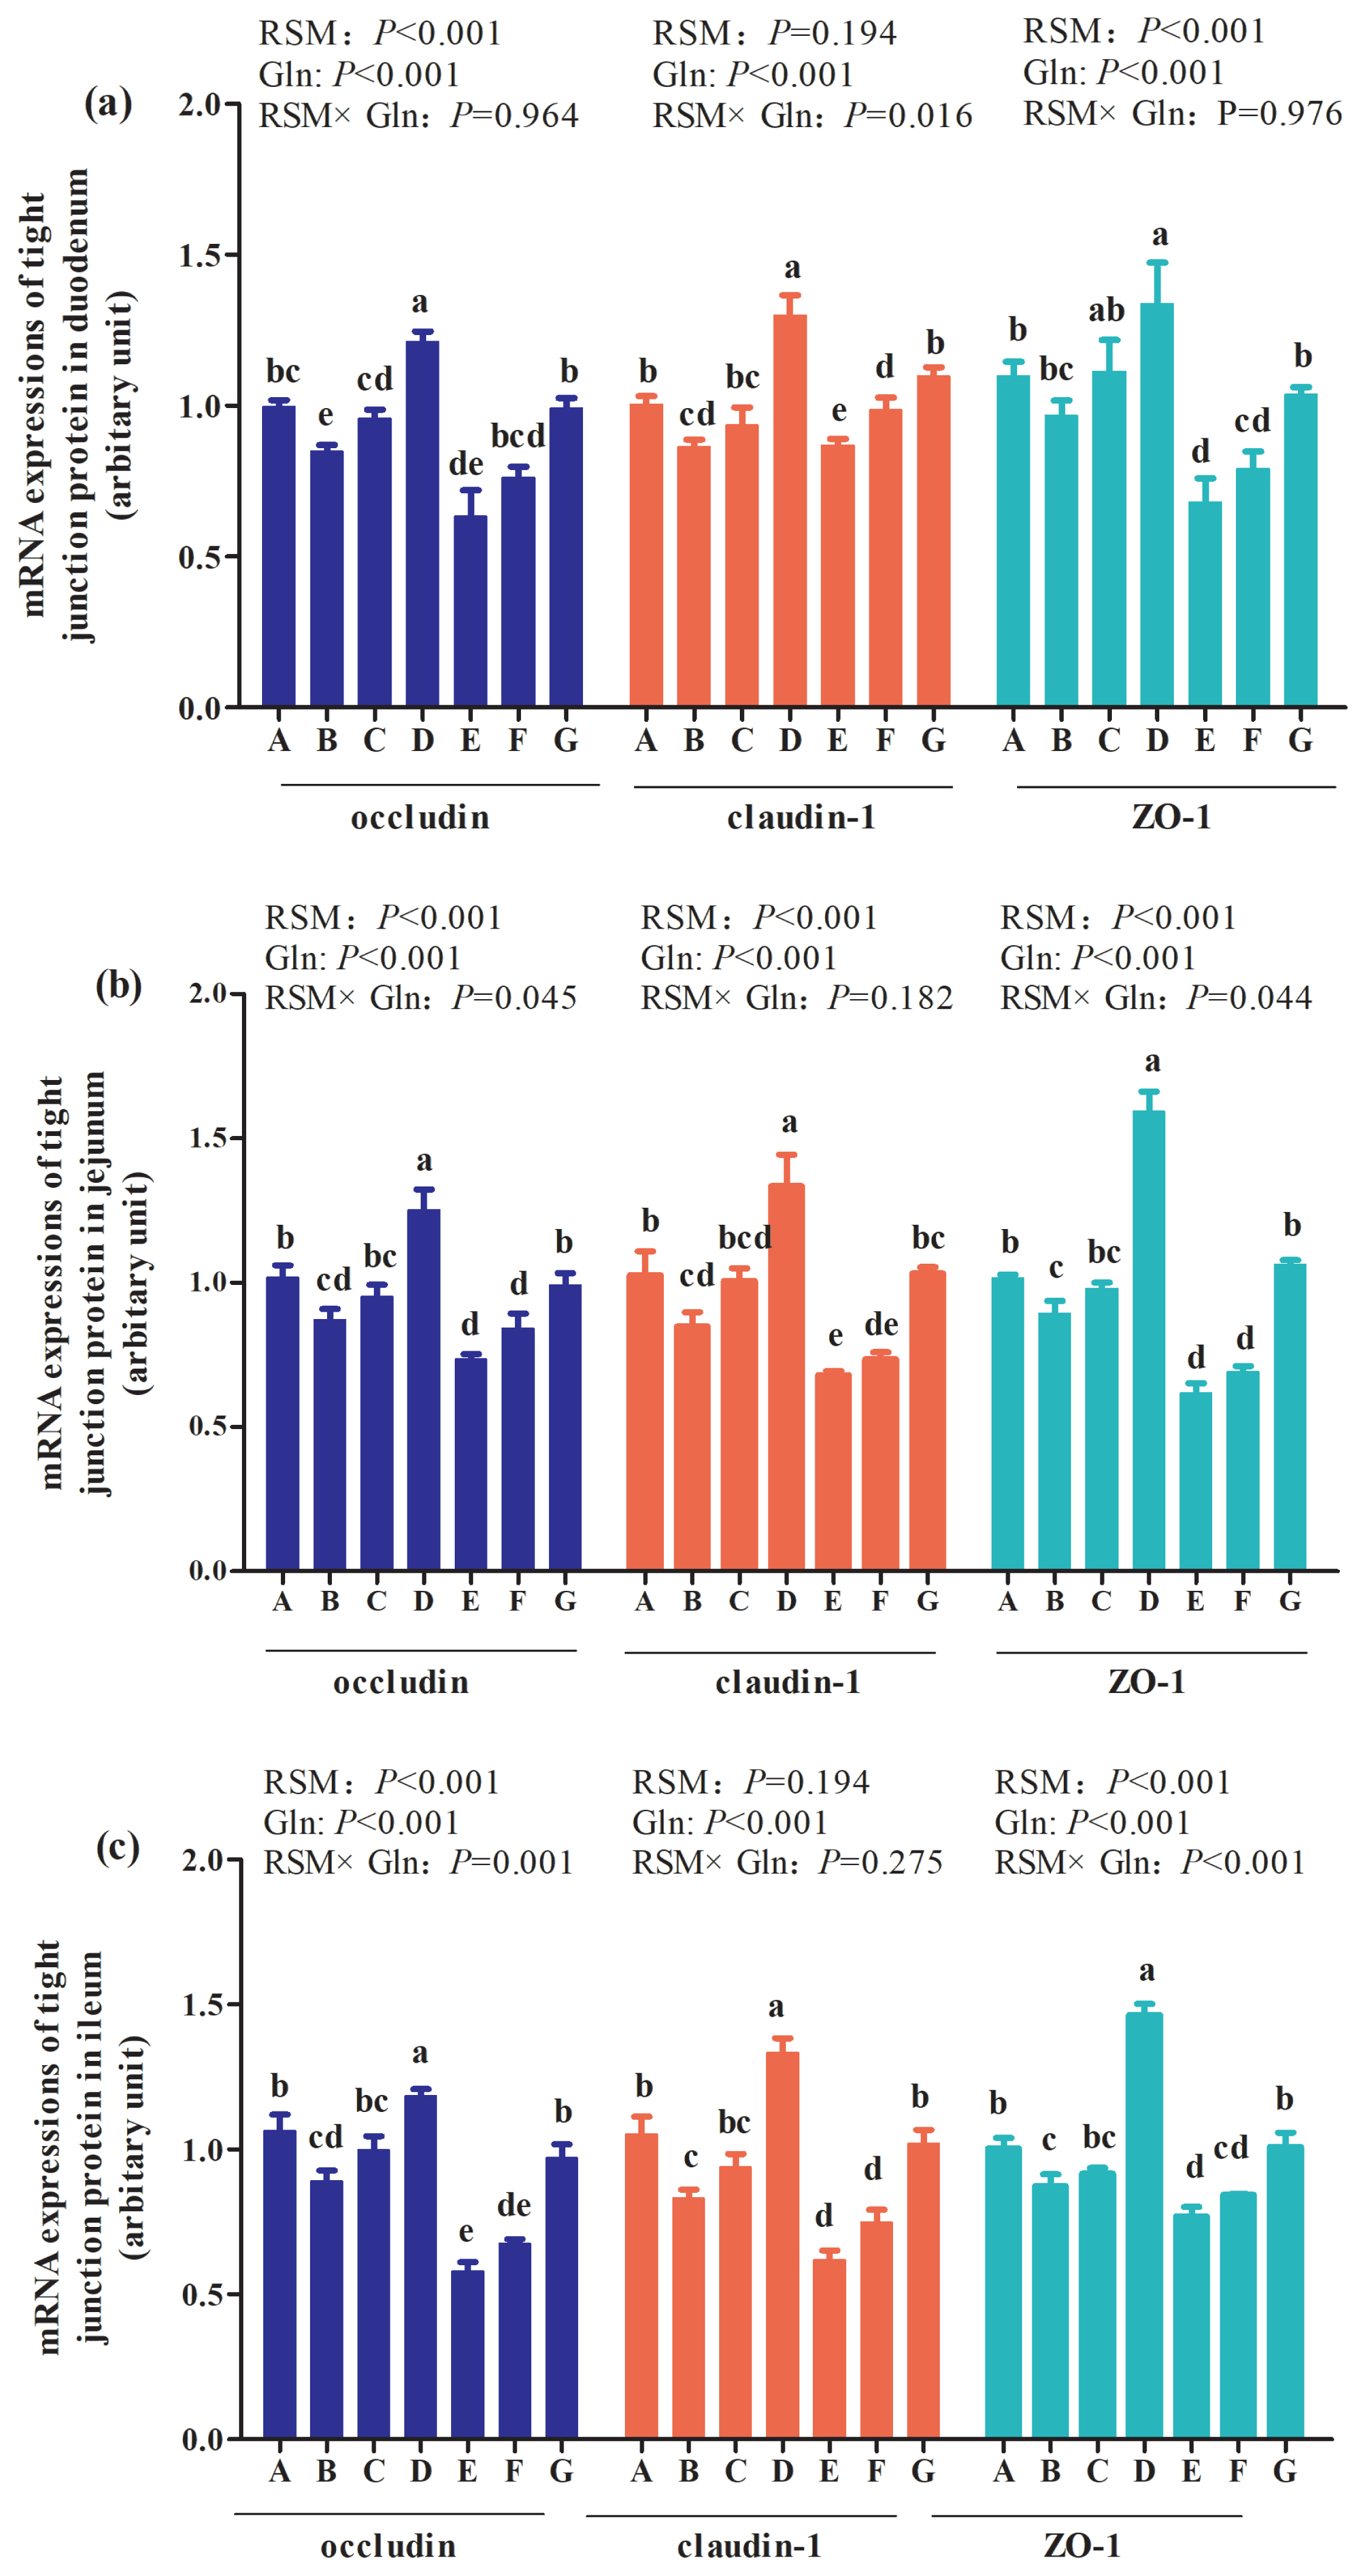
Figure 3

Figure 4

Table 1
| Items | Basal diet | 10% RSM | 20% RSM |
|---|---|---|---|
| Ingredient (%) | |||
| Maize | 56.30 | 56.30 | 56.30 |
| Wheat bran | 5.25 | 2.94 | 0.77 |
| Corn gluten meal | 4.35 | 6.33 | 8.23 |
| Soybean meal | 28.50 | 18.52 | 8.50 |
| Rapeseed meal | 0.00 | 10.00 | 20.00 |
| Limestone | 1.26 | 1.18 | 1.08 |
| Sodium chloride | 0.15 | 0.15 | 0.15 |
| Dicalcium phosphate | 1.87 | 1.89 | 1.95 |
| Phytase | 0.04 | 0.04 | 0.04 |
| Choline chloride | 0.10 | 0.15 | 0.10 |
| Methionine | 0.15 | 0.15 | 0.07 |
| Lysine | 0.00 | 0.22 | 0.45 |
| Soybean oil | 1.53 | 1.63 | 1.86 |
| Premix1) | 0.50 | 0.50 | 0.50 |
| Total | 100.00 | 100.00 | 100.00 |
| Nutrient level | |||
| Crude protein2) (%) | 21.13 | 21.18 | 21.10 |
| Metabolizable energy (MJ/kg) | 12.14 | 12.12 | 12.15 |
| Calcium (%) | 1.00 | 1.00 | 1.01 |
| Available phosphorus (%) | 0.46 | 0.45 | 0.46 |
| Methionine+cystine3) (%) | 0.86 | 0.90 | 0.86 |
| Lysine3) (%) | 1.06 | 1.06 | 1.06 |
| Threonine3) (%) | 0.81 | 0.79 | 0.78 |
1) Premix provided per kilogram of diet: Vit A 6,000 IU, thiamin 2.0 mg, riboflavin 4.0 mg, nicotinamide 42 mg, pyridoxine-HCl 4.0 mg, Vit B12 0.01 mg, Vit D3 2,000 IU, Vit E 30 IU, menadione 1.8 mg, calcium pantothenate 10.0 mg, biotin 0.15 mg, folic acid 0.85 mg, Fe (as ferrous sulfate) 80 mg, Cu (as copper sulfate) 8.0 mg, Mn (as manganese sulfate) 80 mg, Zn (as zinc sulfate) 65 mg, I (as potassium iodide) 0.50 mg, Se (as sodium selenite) 0.25 mg.
Table 2
| Genes | Primers (5′→3′) | Product size (bp) | Gene Bank1) |
|---|---|---|---|
| Occludin | Sense: GTTACTACTACAGCCCCTTGTTGG | 142 | NM_205128.1 |
| Antisense: AGCAGGATGACGATGAGGAA | |||
| Claudin-1 | Sense: AAGAAGATGCGGATGGCTGT | 158 | NM_001013611.2 |
| Antisense: AAGAGGGCTGATCCAAACTCAA | |||
| ZO-1 | Sense: CTTCAGGTGTTTCTCTTCCTCCTC | 131 | XM_015278980.2 |
| Antisense: CTGTGGTTTCATGGCTGGATC | |||
| β-actin | Sense: ATTGTCCACCGCAAATGCTTC | 113 | NM_205518.1 |
| Antisense:AAATAAAGCCATGCCAATCTCGTC |
Table 3
| Items | 21 days of age | 42 days of age | ||||
|---|---|---|---|---|---|---|
|
|
|
|||||
| ADFI (g/d) | ADG (g/d) | FCR (g/d) | ADFI (g/d) | ADG (g/d) | FCR (g/d) | |
| Control | 15.55ab | 6.27bc | 2.48bcd | 41.21b | 12.99b | 3.18b |
| 10% RSM | 14.58cd | 5.65d | 2.57bc | 40.84bc | 12.83b | 3.19b |
| 10% RSM+0.5%Gln | 15.29ab | 6.16bc | 2.49bcd | 41.62ab | 13.32ab | 3.14b |
| 10% RSM+1.0%Gln | 15.83a | 6.70a | 2.36d | 43.99a | 13.94a | 3.16b |
| 20% RSM | 14.10d | 5.13e | 2.75a | 38.22d | 11.50c | 3.33a |
| 20% RSM+0.5%Gln | 15.24abc | 5.87cd | 2.61ab | 38.71cd | 12.05c | 3.21ab |
| 20% RSM+1.0%Gln | 15.45ab | 6.38ab | 2.43cd | 41.16b | 12.95b | 3.18b |
| SEM | 0.126 | 0.097 | 0.029 | 0.417 | 0.154 | 0.016 |
| p-value | <0.001 | <0.001 | 0.002 | 0.001 | <0.001 | 0.046 |
| Main effect | ||||||
| RSM | ||||||
| 10% | 15.24 | 6.17x | 2.48y | 42.15x | 13.36x | 3.16y |
| 20% | 14.93 | 5.79y | 2.60x | 39.36y | 12.17y | 3.24x |
| Gln | ||||||
| 0% | 14.83z | 5.39y | 2.67y | 39.53y | 12.16y | 3.26x |
| 0.5% | 15.20y | 5.93x | 2.56y | 40.22y | 12.58y | 3.18y |
| 1% | 15.45x | 6.45x | 2.40x | 42.11x | 13.25x | 3.17y |
| p-values | ||||||
| RSM | 0.068 | 0.004 | 0.015 | <0.001 | <0.001 | 0.006 |
| Gln | <0.001 | <0.001 | 0.003 | 0.001 | <0.001 | 0.023 |
| RSM×Gln | 0.540 | 0.684 | 0.642 | 0.981 | 0.726 | 0.205 |
ADFI, average daily feed intake; ADG, average daily weight gain; FCR, feed conversion ratio; RSM, rapeseed meal; Gln, Glutamine.
Broilers in the control group were fed with basal diet. Broilers in 10% and 20% RSM were fed with diet containing 10% or 20% RSM, respectively. 10% RSM+0.5% Gln, 10% RSM+1.0% Gln 20% RSM+0.5% Gln, and 20% RSM+1.0% Gln means that 0.5% Gln or 1% Gln was separately supplemented based on 10% and 20% RSM inclusion.
In the same array, values with different small letters superscripts mean significant difference (p<0.05), while with the same or no letter superscript mean no significant difference (p>0.05).
Table 4
| Items | 21 days of age | 42 days of age | ||
|---|---|---|---|---|
|
|
|
|||
| TP (g/L) | Glu (g/L) | TP (g/L) | Glu (g/L) | |
| Control | 22.68bc | 13.08 | 27.61bcd | 11.60 |
| 10% RSM | 20.82cd | 12.77 | 27.01cd | 11.52 |
| 10% RSM+0.5%Gln | 22.92ab | 12.87 | 29.11b | 11.64 |
| 10% RSM+1.0%Gln | 24.81a | 13.02 | 31.24a | 12.07 |
| 20% RSM | 18.22e | 12.04 | 24.69e | 11.49 |
| 20% RSM+0.5%Gln | 19.86de | 12.96 | 26.02de | 12.30 |
| 20% RSM+1.0%Gln | 23.34ab | 12.91 | 28.24bc | 12.07 |
| SEM | 0.384 | 0.236 | 0.356 | 0.121 |
| p-value | <0.001 | 0.765 | <0.001 | 0.411 |
| Main effect | ||||
| RSM | ||||
| 10% | 22.85x | 12.89 | 29.12x | 11.74 |
| 20% | 20.48y | 12.64 | 26.32y | 11.95 |
| Gln | ||||
| 0% | 19.52z | 12.40 | 25.85z | 11.50 |
| 0.5% | 21.39y | 12.92 | 27.57y | 11.97 |
| 1% | 24.08x | 12.97 | 29.74x | 12.07 |
| p-values | ||||
| RSM | <0.001 | 0.554 | <0.001 | 0.452 |
| Gln | <0.001 | 0.488 | <0.001 | 0.204 |
| RSM×Gln | 0.501 | 0.706 | 0.802 | 0.505 |
Broilers in the control group were fed with basal diet. Broilers in 10% and 20% RSM were fed with diet containing 10% or 20% RSM, respectively. 10% RSM+0.5% Gln, 10% RSM+1.0% Gln 20% RSM+0.5% Gln and 20% RSM+1.0% Gln means that 0.5% Gln or 1% Gln was separately supplemented based on 10% and 20% RSM inclusion.
In the same array, values with different small letters superscripts mean significant difference (p<0.05), while with the same or no letter superscript mean no significant difference (p>0.05).


 PDF Links
 PubReader
 ePub Link
 Full text via DOI
 Full text via PMC
 Download Citation
 Supplement
 Print
Print


