


INTRODUCTION
Testis weight is a physiologically important quantitative trait because of its direct implication in male fertility, i.e., spermatogenic ability. Several lines of evidence suggest that sperm production rate depends on testis weight [1,2]. Besides spermatogenesis, testis weight might be associated with various physiological processes; e.g., mating and aggression behaviors [3]. Interestingly, when lines were selected for testis weight, a correlated response for ovulation rate in females emerged in mice [4] and golden hamsters [5]. This suggests that sex-limited phenotypes are mutually correlated probably by sharing common physiologic pathways [6]. Therefore, elucidating the genetic basis underlying testis weight will be help to reveal various physiologic mechanisms of reproductive processes in males as well as females.
Since testis weight varies widely among inbred mouse strains (pared testis weight ranged about 100 to 300 mg), several studies pursuing testis weight genes have been performed [3,7ŌĆō10]. Since males of the inbred mouse DDD/Sgn strain are known to have extremely heavy testes among inbred mouse strains, we have previously performed quantitative trait loci (QTL) mapping analyses in two F2 intercross populations using DDD mice; i.e., F2 mice between DDD and DH/Sgn (DH) inbred mice [9] and F2 mice between DDD and CBA/N (CBA) inbred mice [10]. In DDD├ŚDH F2 mice, we identified significant testis weight QTL on chromosome (Chr) 9 (Twdq1) and suggestive QTL on Chrs 4, 5, 14, 17, and 18. In DDD├ŚCBA F2 mice, we identified significant QTL on Chrs 1 (Twdq2) and X (Twdq3) and suggestive QTL on Chrs 2, 8, 9, 11, 13, and 14. The localization of QTL differed substantially between two crosses, and if any, there were some overlapping QTL. This finding suggests that there would be additional, yet-to-be-identified genes, which contribute to the heavy testes of DDD mice. In the present study, as a third QTL mapping study aimed at genetically dissecting the heavy testes in DDD mice, we produced and analyzed F2 intercross populations between DDD and C57BL/6J (B6) inbred mice.
In addition to heavy testes, DDD males are known to have very high blood testosterone level [11,12]. Indeed, while the average plasma testosterone level in B6 males was 0.49┬▒0.18 ng/mL, that in DDD males was 13.07┬▒3.12 ng/mL [12]. Testicular growth and development is strongly influenced by androgen [13,14]. Although both testis weight and plasma testosterone level are inherited traits, interrelationship between them is not fully established. We have previously performed QTL mapping for plasma testosterone level in F2 male mice between DDD and B6 [12] but did not detect any significant QTL. Even though the genetic basis of plasma testosterone level in DDD mice is unclear, we hypothesize that high blood testosterone level influence extremely heavy testes in DDD mice. Therefore, in this study, we first performed QTL mapping for testis weight and then investigated the influence of plasma testosterone level on the effect of the testis weight QTL.
We further performed whole-exome sequencing analysis in DDD mice to identify genes underlying testis weight QTL. Since extremely heavy testes are a prominent phenotype of DDD mice among inbred mouse strains, it was expected that there would be candidate genes carrying DDD-specific variations.
MATERIALS AND METHODS
Animal ethics statement
All animal procedures were reviewed and approved by the Institutional Animal Care and Use Committee of the NIAS (authorization number H25-001).
Mice
The inbred mouse strains DDD and B6 were maintained at the National Institute of Agrobiological Sciences (NIAS, Tsukuba, Japan). Reciprocal crosses between DDD and B6 strains produced DB (ŌÖĆDDD├ŚŌÖéB6) F1 and BD (ŌÖĆB6├ŚŌÖéDDD) F1 mice, both of which were intercrossed to produce DB F2 (n = 150) and BD F2 (n = 150) male mice. Testicular weight was determined in DDD, B6, and F1 mice at the age of 13 to 14 weeks (90┬▒5 days after birth), and in F2 mice at the age of 11 to 12 weeks (71 to 80 days after birth).
All mice were weaned at 4 weeks of age and four to five mice were housed together in each cage during the experiments. All mice were maintained in a specific pathogen-free facility with a regular light cycle, controlled temperature, and humidity. Food (CRF-1; Oriental Yeast Co., Ltd., Tokyo, Japan) and water were freely available throughout the experimental period.
Testosterone and testis weight analyses
The plasma testosterone level was determined in parental, F1 and F2 mice, as previously described [12]. The paired testes were weighed on an electric balance to the nearest milligram. The weight of the paired testes is simply designated as ŌĆ£testis weight.ŌĆØ
Genotyping
Microsatellite sequence length polymorphisms were identified by electrophoresis after polymerase chain reaction (PCR) amplification of genomic DNA. The PCR amplification was carried out using the Thermal Cycler Dice (TaKaRa Bio Inc., Shiga, Japan). The PCR products were separated on 10% polyacrylamide gel (Nacalai Tesque Inc., Kyoto, Japan) and were visualized by ethidium bromide (Nacalai Tesque, Japan) staining. In total, 117 microsatellite loci were genotyped. Their chromosomal positions were retrieved from Mouse Genome Informatics (MGI, http://www.jax.org). Because the chromosomal positions of six markers were unavailable, they were determined based on our own linkage map.
Quantitative trait loci analysis
Normality of testis weight was assessed using the ShapiroŌĆōWilk W test (JMP13, SAS Institute Japan Inc., Tokyo, Japan). QTL mapping was performed using R/QTL version 1.38ŌĆō4 [15,16]. Single-QTL scans were performed by computing at 1 cM intervals across the entire genome with or without using the lineage (i.e., the direction of the cross) effect as a covariate. First, we included the lineage effect as an additive covariate in the single-QTL scan, if the lineage effect had a strong effect on testis weight. Next, we included the lineage effect as an interactive covariate because the effect of QTL may vary with the covariate (i.e., QTL├Ścovariate interaction). Threshold logarithm of the odds (LOD) scores for significant (p<0.05) and suggestive (p<0.63) linkages were determined by performing 1,000 permutations [17,18]. After single-QTL scans, two-QTL scans were performed to identify pairwise interactions. In this case, we strictly adhered to a recommended threshold [15]. Finally, the covariates and the combined effects of all QTL, including those that were significant and suggestive, were assessed using multiple-QTL models [19].
Whole-exome sequence analysis
To identify nonsynonymous single-nucleotide variation (nsSNV) and/or insertion-deletion in the coding regions of candidate genes, whole-exome sequence analyses were performed. Genomic DNA was extracted from the tail of DDD mice using a genomic DNA purification kit (Wizard Genomic DNA Purification Kit, Promega KK, Tokyo, Japan) and was submitted to Filgen, Inc. (Nagoya, Aichi, Japan) for exome capture and sequencing. Sequence reads were mapped to the mouse reference genome (GRCm38, mm10). Read mapping and variant analyses were performed using CLC Genomics Workbench 7.0.4 and 8.5.1 (Filgen, Japan).
Alpha tubulin acetyltransferase 1 sequencing
Genomic DNA from inbred strains including DDD, B6, DH/Sgn, and CBA/N were extracted according the protocol described above. PCR was performed using Atat1-specific primers (F: 5ŌĆ▓-ttcccgttcgatgtggat and R: 5ŌĆ▓-gtaaataacgtgccggttgc). The PCR product was purified by PCR purification kit (LaboPass PCR, Hokkaido System Science., Ltd. Sapporo, Japan) and submitted to Hokkaido System Science for direct sequence with these primers.
Statistical analysis
Statistical analyses were performed using JMP 13 (SAS Institute, Japan). Testis weight was represented as the mean┬▒ standard error of the mean (mg). Statistical differences between two groups were analyzed using StudentŌĆÖs or WelchŌĆÖs t-test. For statistical comparison among more than two groups, the TukeyŌĆōKramer honest significant difference test was used. Statistical significance is defined when p values are less than 0.05.
RESULTS
Localization of testis weight quantitative trait loci
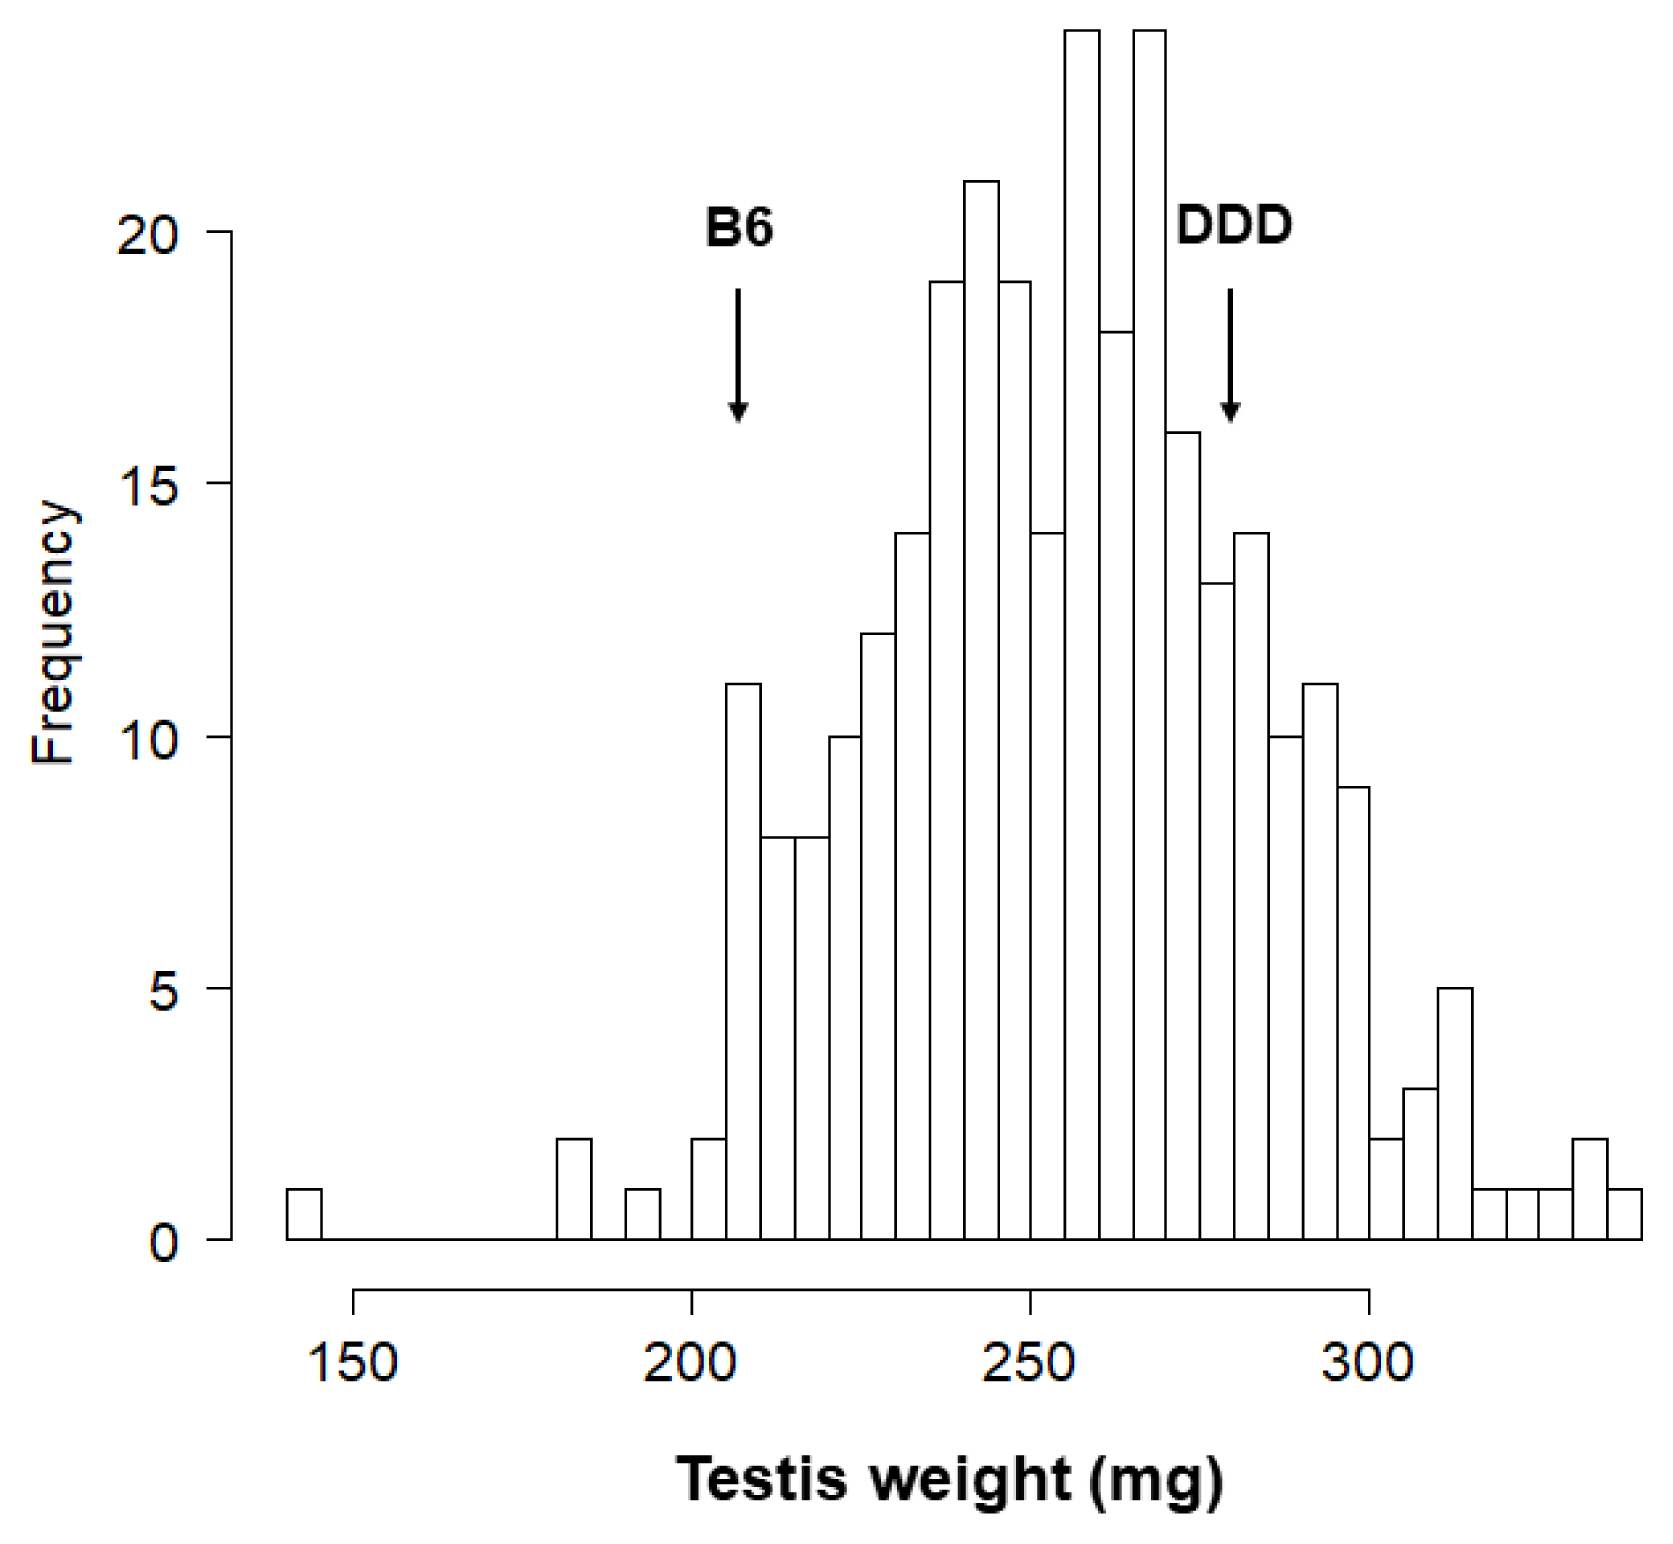
Testis weight in DDD males (n = 28) was significantly higher than that in B6 males (n = 16) (277.6┬▒3.7 mg vs 206.2┬▒5.3 mg, p<0.0001). A clear lineage effect was identified in F1 mice; i.e., testis weight in BD F1 males (n = 12) was significantly higher than that in DB F1 males (n = 15) (301.5┬▒4.8 mg vs 279.7┬▒3.7 mg, p<0.002).
Figure 1 depicts a histogram showing the distribution of testis weight in 297 F2 male mice (We failed to determine the testis weight in one BD F2 and one DB F2 mouse. In addition, we excluded one DB F2 mouse from the analysis because the paired testis weight of this mouse was abnormally low; i.e., only 76.8 mg. Thus, we phenotyped 297 F2 mice but genotyped 300 F2 mice). The testis weight followed a normal distribution. The average testis weight was 255.8┬▒1.7 mg. Although the difference between BD F2 and DB F2 males was not statistically significant (257.0┬▒2.3 mg vs 254.6┬▒2.4 mg, p>0.4), we included the lineage effect as an additive covariate in the subsequent single-QTL scan.
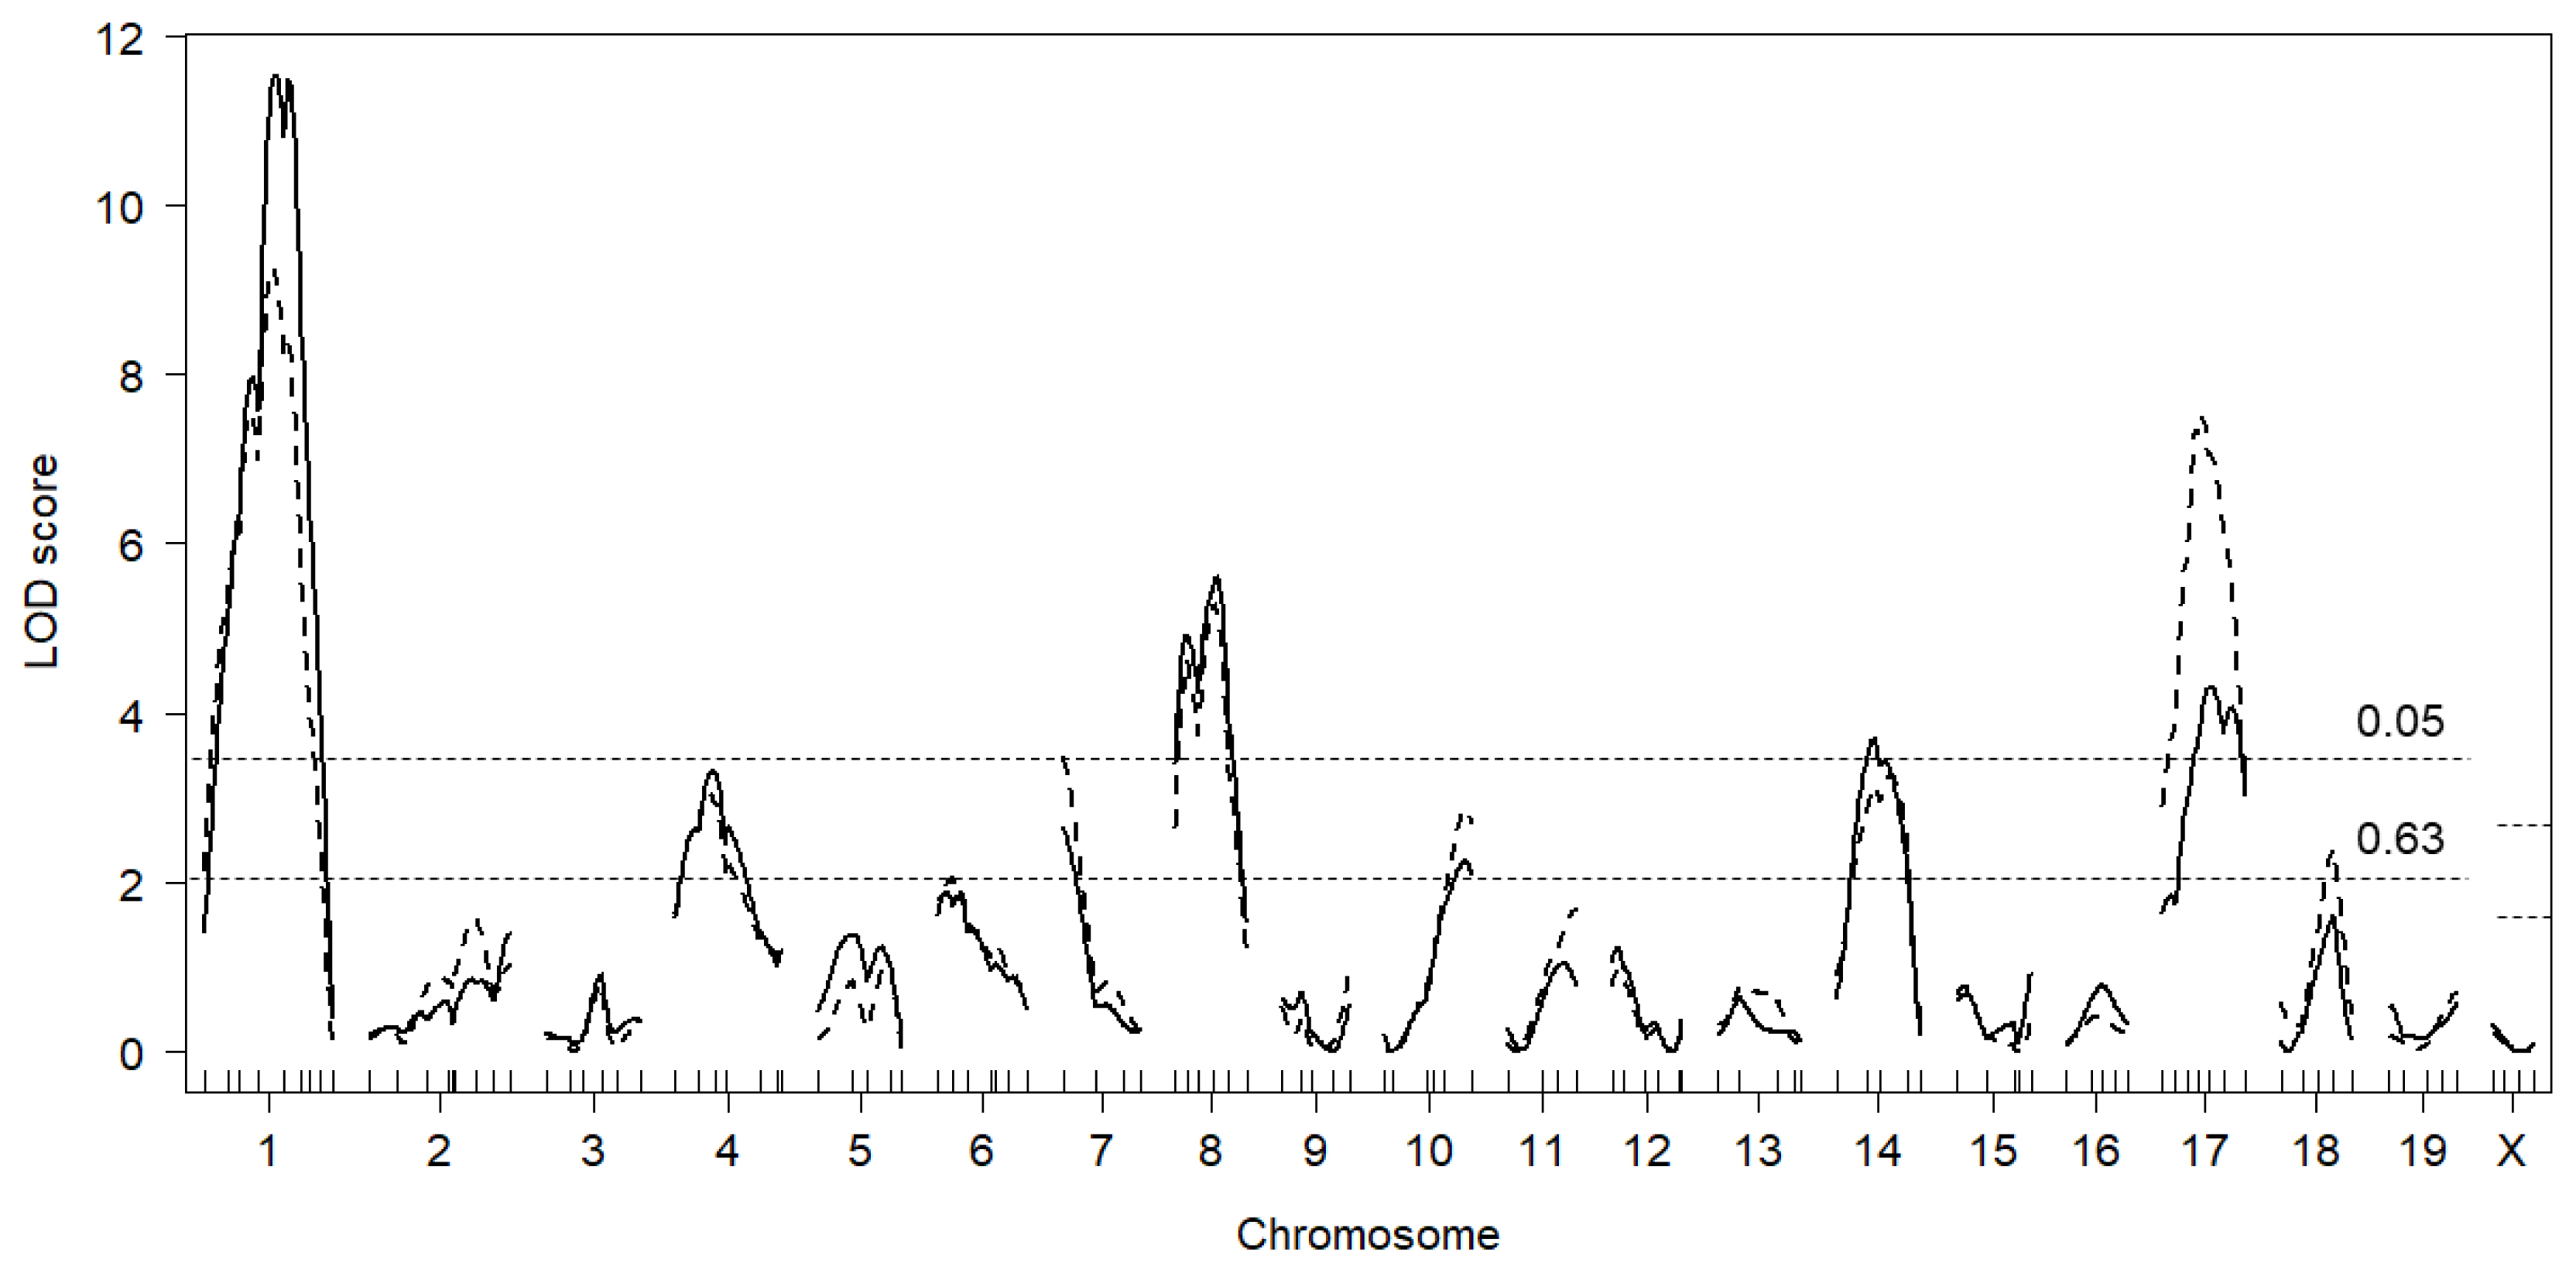
A LOD score plot for testis weight in F2 males is shown in Figure 2 (solid lines). As shown in Table 1, four significant QTL were identified on Chr 1@57.5 cM (Twdq2: this locus was coincidental with that identified in DDD├ŚCBA F2 mice [10]; accordingly, the same QTL symbol was assigned), Chr 8@41.5 cM (Twdq4), Chr 14@32.3 cM (Twdq5), and Chr 17@36.1 cM (Twdq6), along with three suggestive QTL on Chr 4@33.1 cM (Twdq7: QTL symbol was assigned to this suggestive QTL because a significant testis weight QTL has been mapped to this region [3]), Chr 7@2.0 cM, and Chr 10@61.5 cM (Twdq8: QTL symbol was assigned to this suggestive QTL because a significant testis weight QTL has been mapped to this region [3]). The DDD allele was associated with increased testis weight at all QTL except for the Twdq8 on Chr 10. We next performed QTL mapping by including the lineage effect as an interactive covariate, but found no significant QTL├Ścovariate interactions (in other words, there were no QTL whose effect differed significantly between BD F2 and DB F2 males). Two-QTL scans with R/QTL revealed a possible pairwise interaction between Chr 1 and Chr 8; however, the LOD score for interaction (lod.int) was substantially lower (2.58) than the recommended threshold value (i.e., 6.3). Multiple regression analysis indicated that the detected QTL explained 41.4% of the testis weight variation (Table 2).
In the above analysis, we found strong evidence for Twdq2 on Chr 1. Accordingly, we next performed QTL mapping by including the nearest marker (D1Mit102) for Twdq2 as an additive covariate. While the LOD score on Chr 1 shrank to 1.1, the LOD scores for the remaining significant QTL, particularly those for Twdq4 (Chr 8) and Twdq5 (Chr 14), were increased to 6.2 and 4.8, respectively. In contrast, the LOD score for Twdq6 (Chr 17) was changed subtly (LOD score 4.4) (data not shown). One additional suggestive QTL was identified on Chr 5 (Table 1).
We also performed a single-QTL scan by including body weight as an additive covariate. Since the suggestive QTL on Chr 7 was identified as significant (Table 1), we newly assigned the QTL symbol Twdq9 to this QTL. Clearly, the LOD score for Twdq6 (Chr 17) was substantially increased to 7.7 (Figure 2, dashed lines). One additional suggestive QTL was identified on Chr 18 (Table 1).
Influence of testosterone level on the localization of quantitative trait loci
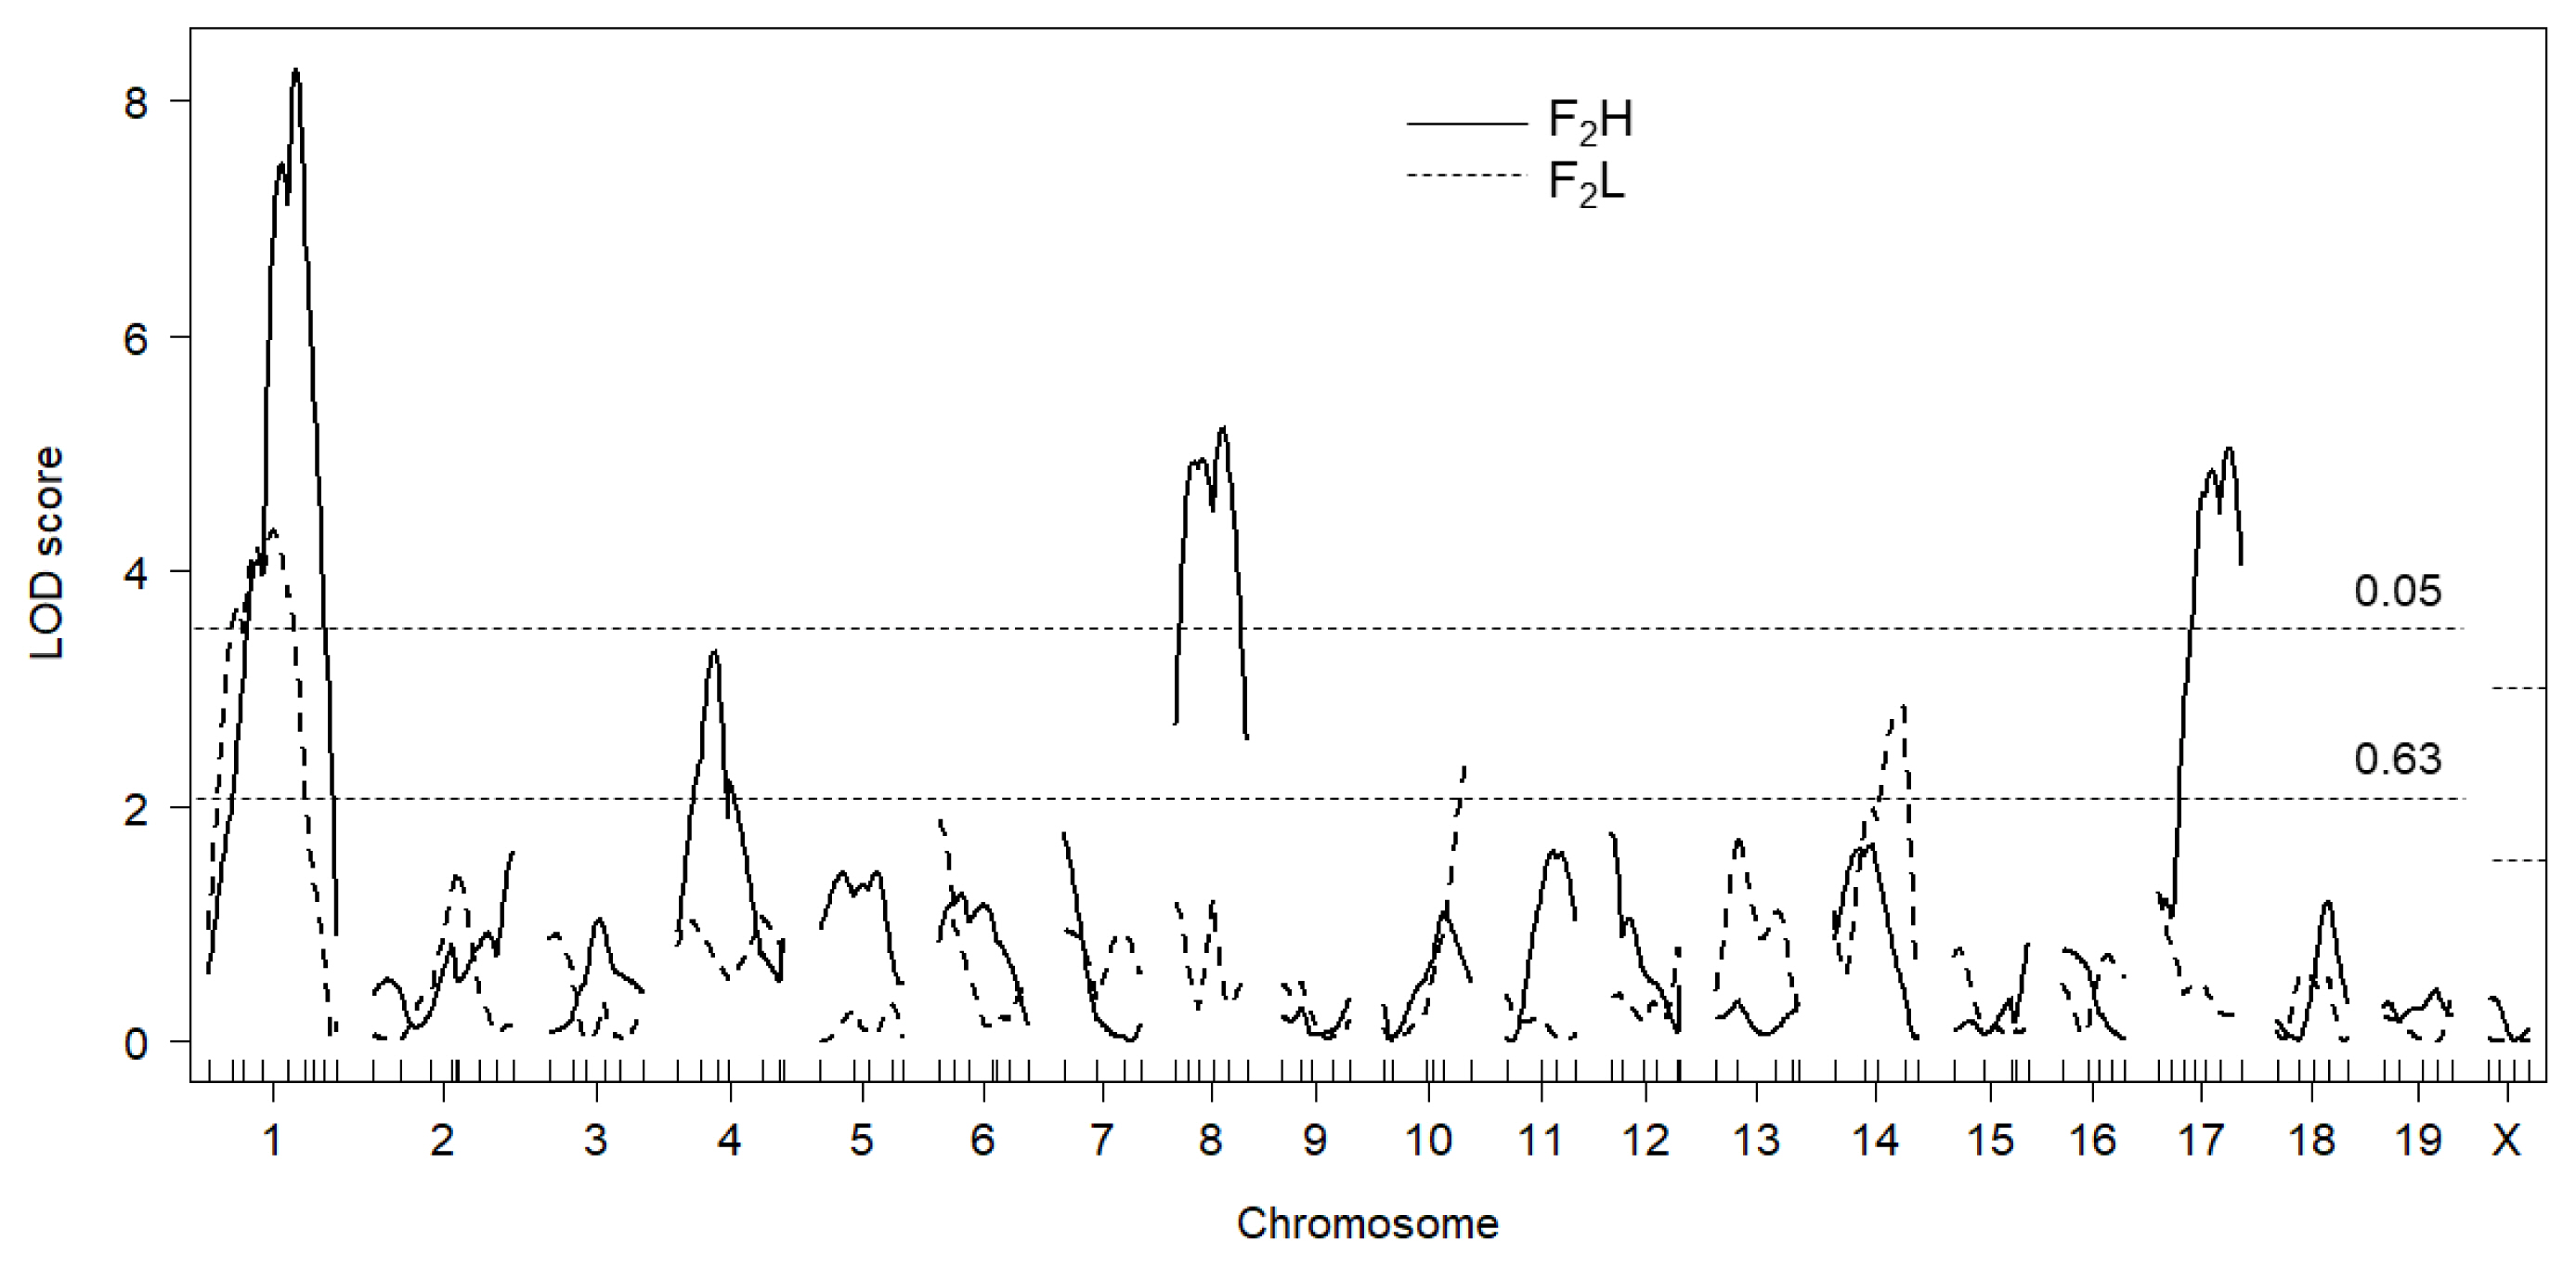
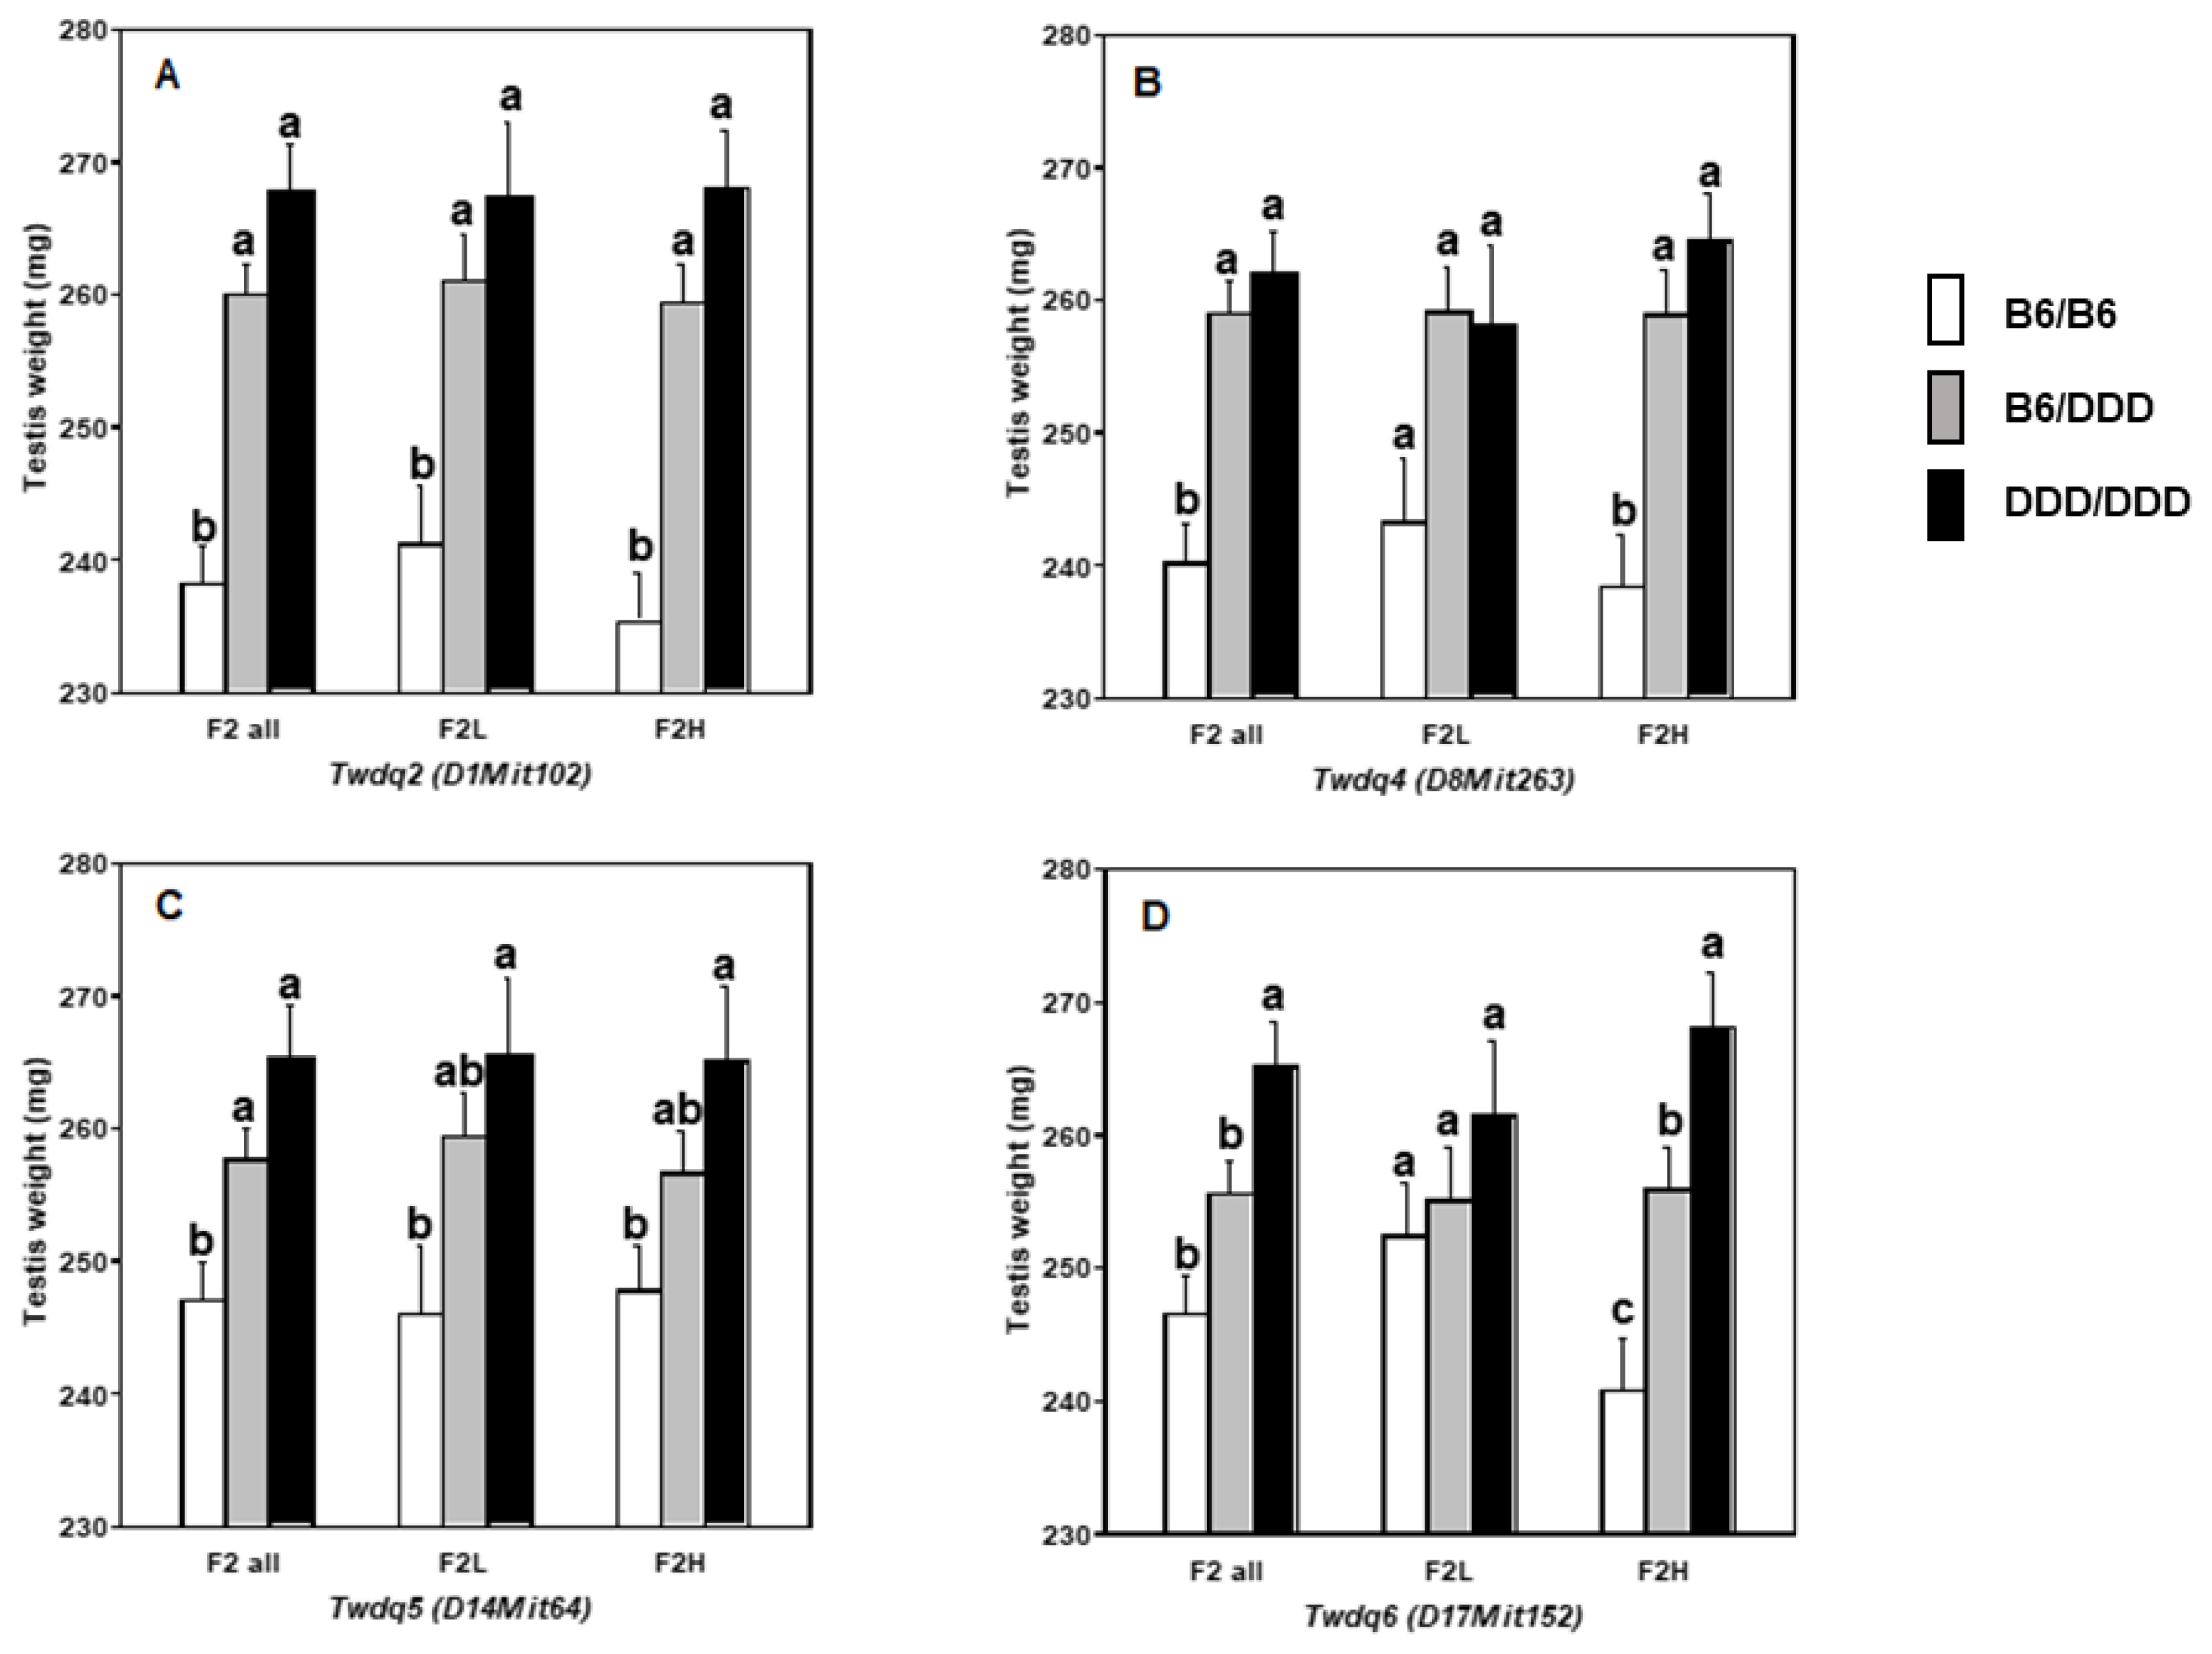
Next, we analyzed testis weight by taking circulating testosterone level into consideration, because DDD male has extremely high plasma testosterone level. The F2 mice were then divided into two groups according to the plasma testosterone level; i.e., F2 mice with less than 0.49 ng/mL testosterone (an average testosterone level in B6 male) were designated as F2L (F2 with ŌĆ£lowŌĆØ testosterone, n = 124, an average and a median testosterone level were 0.33┬▒0.01 ng/mL and 0.34 ng/mL, respectively) mice and F2 mice with more than 0.49 ng/mL testosterone were as F2H (F2 with ŌĆ£highŌĆØ testosterone, n = 176, an average and a median testosterone level were 7.84┬▒0.78 ng/mL and 2.02 ng/mL, respectively) mice. The difference in testosterone level between F2L and F2H mice was statistically significant (p<0.0001) when judged by either parametric (StudentŌĆÖs t-test) or non-parametric (Wilcoxon rank sum test) analysis. On the other hand, there was no significant difference in testis weight in F2L and F2H mice (256.1┬▒2.6 mg vs 255.6┬▒2.2 mg, p>0.8). Single-QTL scans were performed for F2L and F2H mice separately. In F2L mice, one significant QTL was identified Chr 1@52.5 cM, along with two suggestive QTL on Chr 10@64.5 cM and Chr 14@53.3 cM (Table 3; Figure 3). On the other hand, in F2H mice, three significant QTL were identified on Chr 1@68.5 cM, Chr 8@45.5 cM, and Chr 17@52.1 cM, along with one suggestive QTL on Chr 4@33.1 cM. Substantial difference in LOD scores between F2L and F2H mice was found for QTL on Chrs 1, 4, 8, and 17. Notably, the LOD score for QTL on Chr 17 in F2H mice was higher than that identified in all F2 mice (Table 1). Although QTL on Chr 1 explained similar variance in F2L and F2H mice, QTL identified in F2H mice accounted for slightly more variance compared with those identified in F2L mice (Table 2). Allele effect of significant QTL was investigated in all F2, F2L, and F2H mice (Figure 4). Except for Twdq5 on Chr 14 (Figure 4C), high testosterone level tended to be associated with increasing the effect of the DDD-derived allele and with decreasing the effect of the B6-derived allele. Testosterone level appeared not to influence the effect of heterozygotes.
Candidate gene identification for Twdq6 on Chr 17
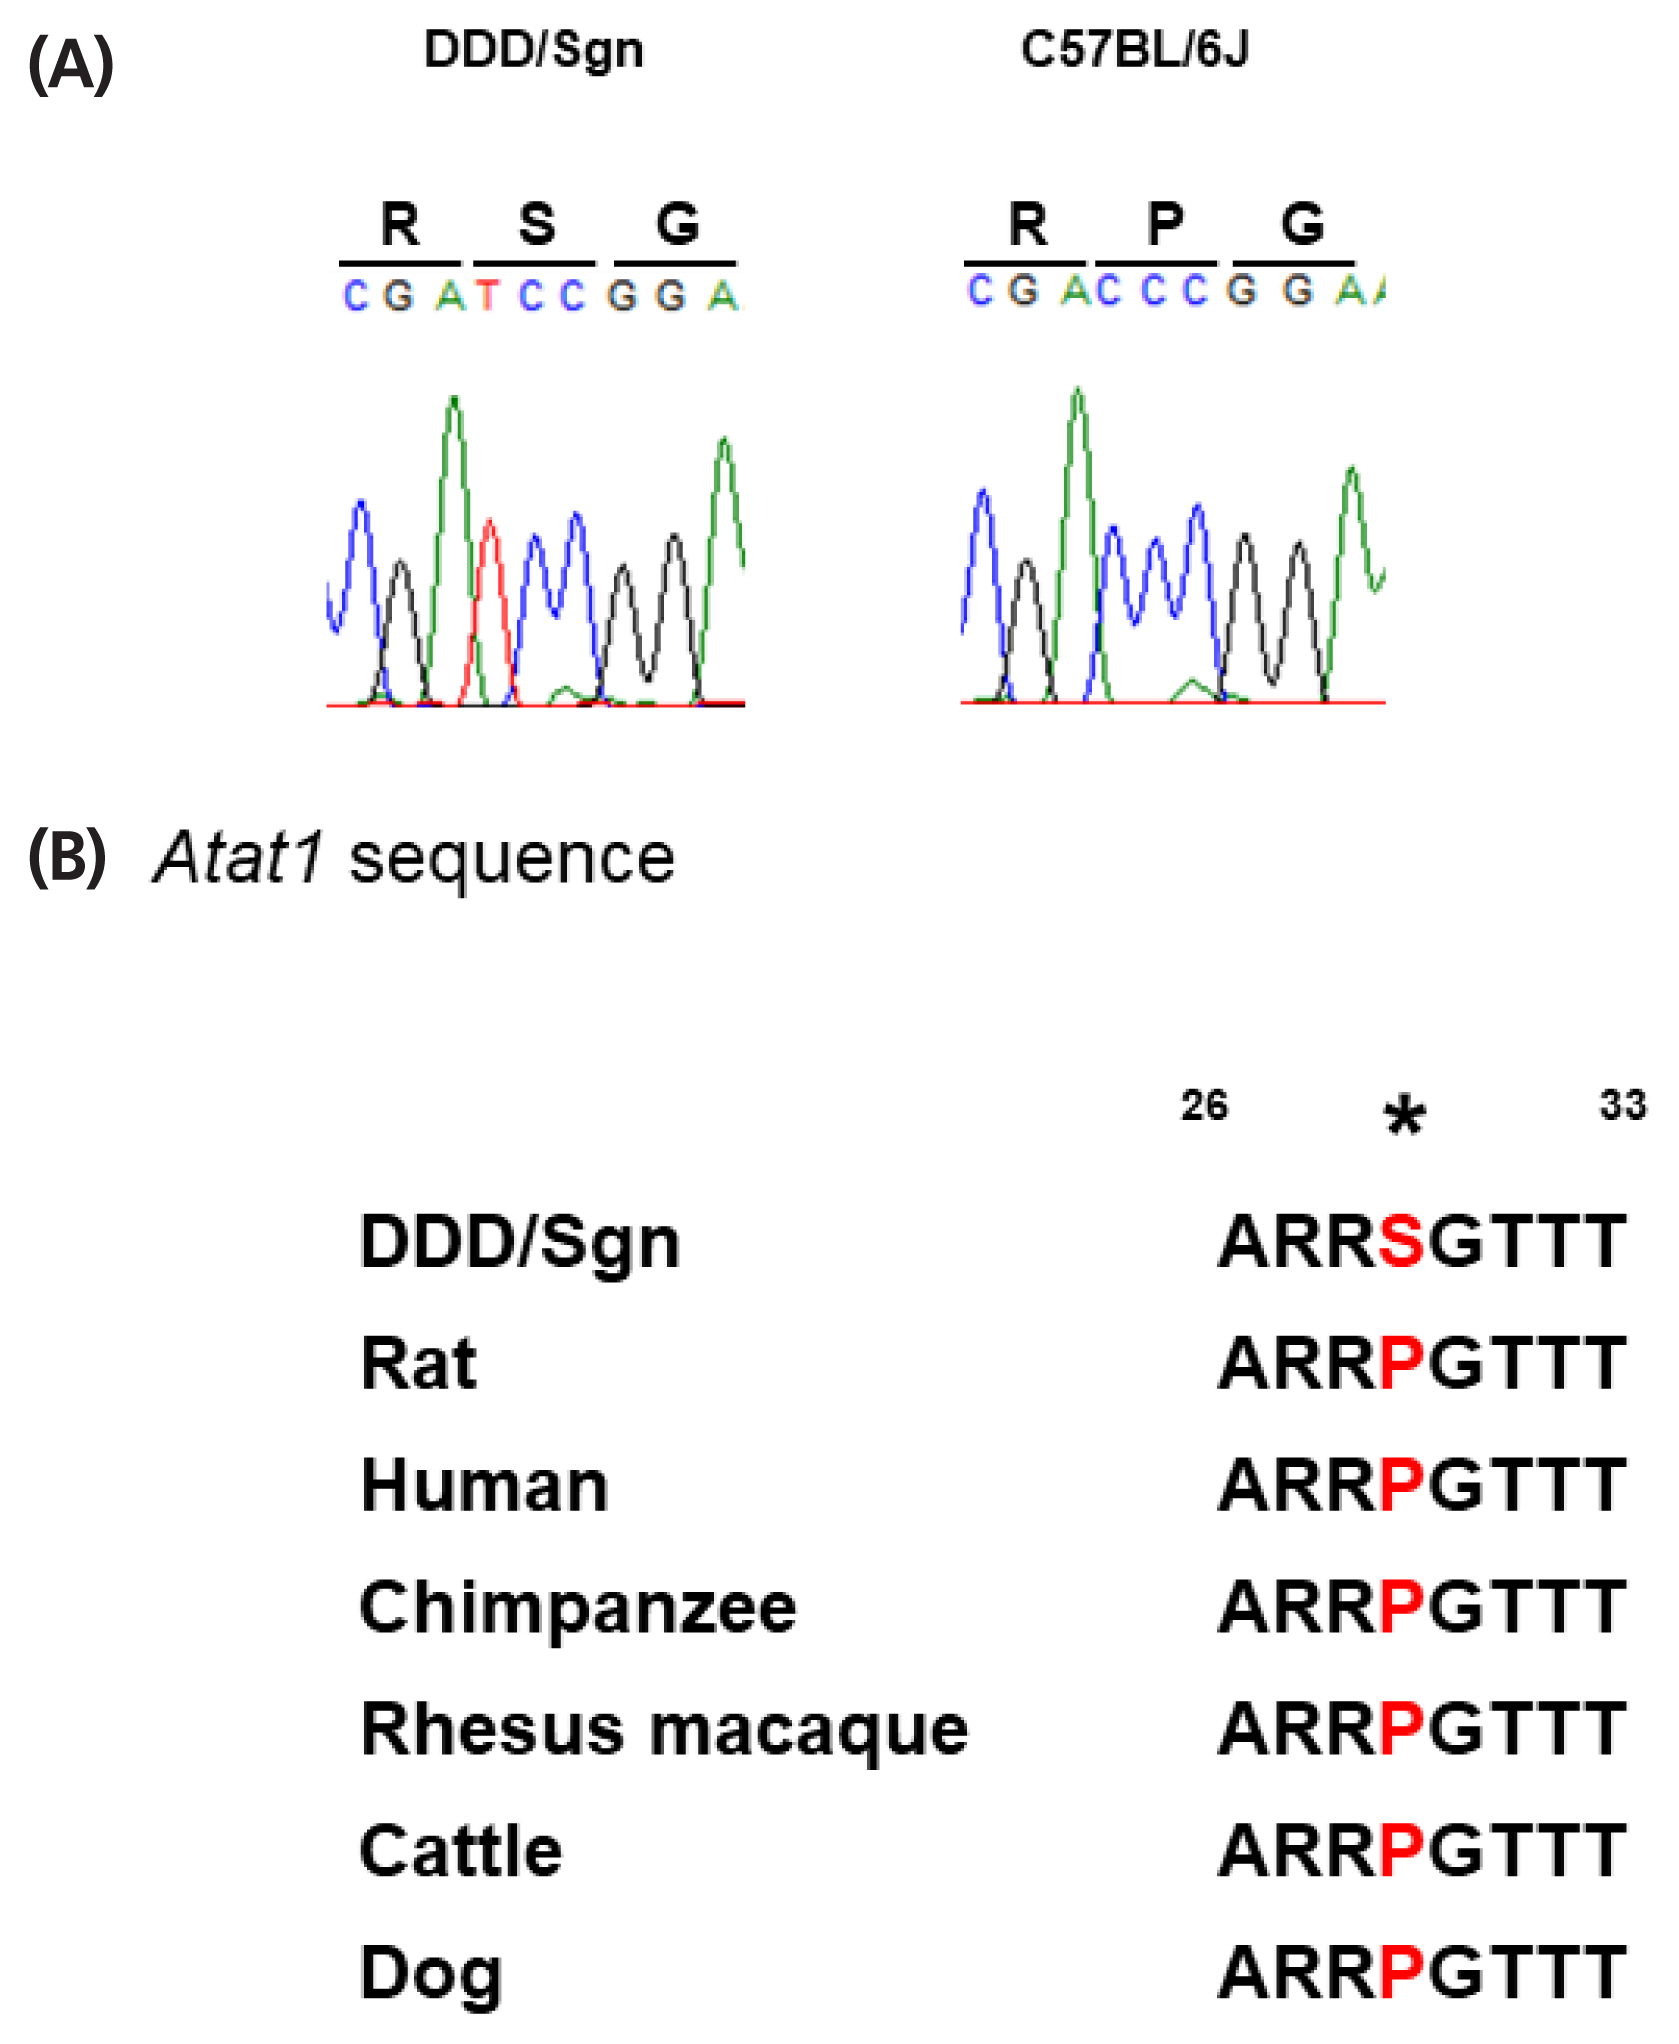
By submitting the term ŌĆ£abnormal testis weightŌĆØ as a query to the MGI database (Mammalian Phenotype Browser), we retrieved 25 genes that were localized within 95% confidence intervals (CIs) of four significant single-QTL on Chrs 1, 8, 14, and 17 (Table 4). In most cases, testis weight was reduced in the mutant mice of these genes; only 2 of 25 mutants (protein tyrosine phosphatase, receptor type, V [Ptprv] and TBC domain family, member 4 [Tbc1d4]) were associated with increased testis weight. Since DDD mice have extremely heavy testis relative to other inbred mice, we assumed that there are DDD-specific genetic variations. To identify such genetic variations, we performed whole-exome sequence analysis. We identified nsSNVs in eight genes, i.e., tudor domain containing 5 (Tdrd5), neuregulin 1 (Nrg1), nanos C2HC-type zinc finger 3 (Nanos3), synaptonemal complex central element protein 2 (Syce2), Tbc1d4, mutS homolog 5 (Msh5), Atat1, and follicle stimulating hormone receptor (Fshr), but none of them except for one that detected for Atat1 were DDD-specific. p.Pro29Ser resulting from a c.85C>T substitution (Chr 17:35909951) in Atat1 seems to be novel because no single nucleotide polymorphism (SNP) ID has been assigned, and because no SNP were known at this chromosomal location in other inbred mouse strains including 129S1/SvImJ, A/J, AKR/J, BTBR T+ Itp3tf/J, C3H/HeJ, C57BL/6J, CAST/EiJ, CBA/J, DBA/1J, DBA/2J, FVB/NJ, I/LnJ, KK/HIJ, MOLF/EiJ, NOD/ShiLtJ, NZB/BINJ, NZO/HILtJ, PWK/PhJ, RF/J, SPRET/EiJ, and WSB/EiJ according to ŌĆ£Mouse SNP retrieval utilityŌĆØ by Mouse Phenome Database (Figure 5A). Furthermore, Pro29 was well conserved among mammalian species including human, rat, chimpanzee, rhesus macaque, cattle, and dog (Figure 5B).
DISCUSSION
This study identified nine QTL, of which five were significant and four were suggestive. The result was satisfactory because the number of QTL underlying testis weight was thought to be small [7,20]. Seven of the nine QTL, i.e., Twdq2 (Chr 1), Twdq7 (Chr 4), Twdq4 (Chr 8), Twdq5 (Chr 14), Twdq6 (Chr 17), and the suggestive QTL on Chrs 5 and 18, had also been identified in either of our preceding studies using DDD mice [9, 10]. Therefore, only Twdq9 (Chr 7) and Twdq8 (Chr 10) were novel in a series of QTL mapping studies using DDD mice. Based on the results of three studies, most of the QTL underlying high testis weight in DDD mice might have been identified. Notably, the DDD-derived allele was associated with higher testis weight at most QTL.
The lineage effect was observed in the F 1 populations, i.e., BD F1 mice had significantly higher testis weight than DB F1 mice. The lineage effect was also found in our previous studies; e.g., DH├ŚDDD F1 mice had significantly higher testis weight than that of the DDD├ŚDH F1 mice [9], and CBA├ŚDDD F1 mice had significantly higher testis weight than that of the DDD├ŚCBA F1 mice [10]. We attribute the lineage effect to the difference in the genes on the Chr Y because the F1 mice carrying YDDD had significantly higher testis weight than the reciprocal F1 mice in all crosses. There is experimental evidence supporting the contribution of Chr Y to testis weight in mice [21]. Our studies in Y-consomic strains clearly showed the effect of Chr Y; Chr YDDD produced significantly heavier testes than did Chr YB6 [9,10]. Further evidence was that DDD mice had significantly heavier testis than DDD-Chr YCBA mice (296.0┬▒4.4 mg vs 252.2┬▒3.8 mg, p<0.0001), although the body weight did not significantly differ between the two strains (32.3┬▒0.4 g vs 31.8┬▒0.3 g, p>0.3) (unpublished data). It was suggested that the native YDDD was indispensable to sustain high testis weight in DDD mice. The effect of Chr Y appeared to be independent of the effect of autosomes.
To control the effect of body weight, we analyzed testis weight by including body weight as an additive covariate. Accordingly, we re-analyzed previously published testis weight data in the DDD├ŚDH F2 mice [9] and DDD├ŚCBA F2 mice [10] by including body weight as an additive covariate. As a result, two of four suggestive QTL identified in DDD├ŚDH F2 mice, i.e., QTL on Chrs 14 and 17, were identified as significant QTL (the maximum LOD scores for these QTL were 4.8 and 4.7, respectively). The result suggests that these QTL may have an indirect effect on testis weight, acting through the body weight [15]. The QTL on Chr17 identified in DDD├Ś DH F2 mice might be allelic to that identified in this study because of considerable increase of LOD score after the inclusion of body weight as an additive covariate. In contrast, it was uncertain whether the QTL on Chr 14 identified in the two crosses were allelic, because the LOD score for Twdq5 identified in the present study was not substantially changed after the inclusion of body weight as an additive covariate.
Results of separate F 2 analyses (i.e., F2L and F2H mice) strongly suggested that we should take the endocrinological background of the mice into consideration when assessing the effect of genes on testis weight. As it was particularly evident for the QTL on Chr 17, ŌĆ£highŌĆØ testosterone level altered the mode of inheritance of QTL allele. In other words, ŌĆ£highŌĆØ testosterone level tended to be associated with increasing the effect of the DDD-derived allele and with decreasing the effect of the B6-derived allele. We considered the possible mechanism for this phenomenon to be that, testosterone level might change the magnitude of expression level of genes underlying QTL. Indeed, testosterone is known to regulate gene expression levels [22,23]. Thus, high testosterone might be associated with up-regulation of the DDD-derived genes and was associated with down-regulation of the B6-derived genes. Otherwise, high testosterone might sensitize the cells or cellular receptors, on which the genes underlying QTL act. In this context, we were interested in the genetic basis of plasma testosterone level. Like other blood components, testosterone level is suggested to be genetically determined. Serum testosterone level is inherited in an autosomal dominant mode in pig breeds Meishan and Landrace [22], and significant QTL was identified in White Duroc├ŚChinese Erhualian resource population [24]. However, the mode of inheritance of circulating testosterone level was ambiguous in mice, and we could not identify any significant QTL [12]. In part, this result is associated with the extensive variation in the plasma testosterone levels in DDD mice. Since the episodic testosterone secretion is known in mice [25,26], variable testosterone level even in an inbred mouse strain might not be surprising. We should be cautious about species difference when interpreting the experimental results regarding the blood testosterone levels.
By searching MGI database, we found 25 candidate genes that potentially influence testis weight within 95% CIs for four significant single-QTL on Chrs 1, 8, 14, and 17 (Table 4). Interestingly, testis weight was decreased in most mutants of the candidate genes. Dysfunctional gene mutations tend to be associated with lower testis weight; thus, the higher testis weight of DDD mice might be a consequence of altered gene functions. We performed whole-exome sequencing in DDD mice on the assumption that the higher testis weight of DDD mice is caused by coding-region variants, which are specific to the DDD strain. The analysis identified nsSNV that differed between DDD and B6 mice in 8 of 25 candidate genes: Tdrd5, Nrg1, Nanos3, Syce2, Tbc1d4, Msh5, Atat1, and Fshr (Table 4). However, most of nsSNV identified for these genes were not DDD strain-specific. For example, although there were six nsSNVs in Tdrd5, all were also found in many other inbred mouse strains. In particular, two of six nsSNV in Tdrd5 resulting in Thr396Ala and Ile111Met were also identified in NZB/BINJ strain, which have extremely heavy testes like DDD [3]. However, no significant testis weight QTL was identified on Chr 1 in C57BL/6ByJ ├Ś NZB/BINJ F2 mice, suggesting that these were unlikely to be causative of Twdq2. Similarly, two nsSNVs in Tbc1d4 resulting in Ile834Val and Arg659Gly were identified in NZB/BINJ, but no significant testis weight QTL was identified on Chr 14 in abovementioned F2 mice [3]; therefore, these were unlikely to be causative of Twdq5. Although the nsSNVs in Fshr are plausible candidates underlying Twdq6, these nsSNVs were also found in other inbred mouse strains including a strain with very light testes such as CAST/EiJ.
One nsSNV, Pro29Ser, identified in Atat1 appears to be novel, given that no SNP ID has yet been assigned. Accordingly, we searched for this nsSNV among the various inbred mouse strains with consequent that this nsSNV was not shared by any other strains. We then investigated Atat1 sequence in other mammalian species and found that Pro29 was well conserved. Thus, we concluded that Ser29 was a mutation occurred specifically in DDD mice. A targeted disruption mutation in Atat1 resulted in reduction of testis weight in mice [27]. Therefore, Pro29Ser was unlikely to be associated with loss or hypofunction of this gene, if this gene is a causative of Twdq6. Although further-in-depth in vivo studies are necessary for validating the function of this mutation, this was an important finding to understand the molecular basis of mechanisms underlying high testis weight in mice. Taken together, results of the present study provide insights into genetic and endocrinological mechanisms determining testis weight in mice.
 PDF Links
 PubReader
 ePub Link
 Full text via DOI
 Full text via PMC
 Download Citation
 Print
Print


