Influence of dietary nonstructural carbohydrate concentration on growth performance and carcass characteristics of Holstein steers
Article information

Abstract
Objective
Since very little information exists about the topic; in this experiment we compare, in a long-term finishing program, the growth-performance responses and carcass characteristics of Holstein steers where non-structural carbohydrate concentration of the diet is reduced from 64% to 51% (dry matter basis).
Methods
Sixty Holstein steer calves (129±2.2 kg) were blocked by initial weight into five groups and randomly assigned within weight groupings to 10 pens. Calves were fed with a steam-flaked corn-based finishing diets containing 51% higher fiber (HF) or 64% lower fiber (LF) nonstructural carbohydrates. Non-structural carbohydrates concentrations were manipulated substituting dried distiller grain with solubles and alfalfa hay for flaked corn. Cattle were weighed every 112 days and at the end of the experiment (day 308) when the cattle were harvested and carcass characteristics were evaluated.
Results
Steers fed the HF diet showed improvement (8.8%) in average daily gain (ADG) during the initial 112-d period. This effect was followed by a numerical trend for greater ADG throughout the remainder of the study so that overall ADG tended to be greater (4.9%, p = 0.06) for the HF than for LF. There were no treatment effects on dry matter intake. Gain efficiency and estimated dietary net energy (NE) were greater 8.3% and 5.2%, respectively for HF during the initial 112-d period. Overall (308-d) gain efficiency and estimated dietary NE were similar for both dietary treatments. However, due to differences in tabular dietary NE, the ratio of observed:expected dietary NE tended to be greater (4.1%, p = 0.06) for the HF vs LF diet. There were no treatment effects on carcass characteristics except for a tendency toward a slightly greater (0.5%, p = 0.09) estimated carcass yield.
Conclusion
Reducing the non-structural carbohydrate concentration of a conventional steam-flaked corn-based growing finishing diet for Holstein steers can effectively enhance growth performance, particularly during the early growing and late finishing phases.
INTRODUCTION
Holstein steers calves grow faster than beef steers at comparable weights [1], capable of doubling their daily live weight during the first 90 to 100 d in the feedlot [2,3]. To fully express this growth potential, receiving and growing diets for the calf-fed Holsteins are energy dense [4,5]. Due to their light initial weight upon entering the feedlot (~130 kg) and heavy mature final weight (>575 kg), the duration of the growing-finishing period of calf-fed Holsteins is protracted, exceeding 300 days [6,7]. Protracted feeding of energy-dense diets (characteristically high in starch and low in forage), increases individual risk of digestive upset and overall growth-performance [8]. This effect is magnified in Holsteins due to their genetically enhanced gut capacity, potentiating wider swings in voluntary feed intake and associated incidence of metabolic death, bloat, and liver abscess than observed in conventional beef breeds [6]. Conventional steam-flaked corn-based growing finishing diets fed to Holstein steers in the Southwestern USA are high in readily fermentable non-structural carbohydrate (64% to 66% dry matter [DM] basis). Decreasing the level of non-structural carbohydrate may reduce the risk of digestive dysfunctions. However, the alternative of increasing dietary forage and reducing dietary starch in growing finishing diets may, itself, limit energy intake and hence, increase the risk for decreased growth-performance [9,10]. To our knowledge, very little, if any information has been reported that evaluates the impact of feeding decreased levels of non-fiber carbohydrate across the entirety of the growing finishing phases on feedlot performance of calf-fed Holstein steers. In this study we compare the growth-performance responses and carcass characteristics of calf-fed Holstein steers where non-structural carbohydrate concentration of the diet is reduced from 64% to 51% (DM basis).
MATERIALS AND METHODS
All procedures involving animal care and management were in accordance with and approved by the University of California, Davis, Animal Use and Care Committee.
Animals, feeding, treatments, and carcass measurements
Sixty Holstein steer calves (129±2.2 kg initial weight) were utilized to evaluate the effects of dietary forage level on growth performance, dietary energetics, and carcass characteristics. The number of pen replicates (5) and animals (30) within treatments are enough to determine statistical differences on growth performance of feedlot cattle. Indeed, four pens replicates would have been sufficient. Based on power analysis and standard deviation for measure, we had a power of 0.955 for detecting a 5% difference in gain efficiency. Upon arrival at the University of California Desert Research Center (El Centro, CA, USA), steer calves were vaccinated against IBR, BVD (type 1 and 2), PI3, BRSV (Cattle Master Gold FP 5 L5, Zoetis, New York, NY, USA), clostridia (Ultrabac 8, Zoetis, New York, NY, USA), treated against internal and external parasites (Dectomax, Zoetis, New York, NY, USA), injected with 1,500 IU vitamin E (as d-alpha-tocopherol) 500,000 IU vitamin A (as retinyl-palmitate) and 50,000 IU vitamin D3 (Vital E-AD, Stuart Products, Bedford, TX, USA), and 300 mg tulathromycin (Draxxin, Zoetis, USA). Steers calves were blocked by initial shrunk (off truck) weight into five groups and randomly assigned within weight groupings to 10 pens (six steers per pen). Pens were 62 m2 with 25 m2 overhead shade, automatic waterers and 2.4 m fence-line feed bunks. Treatments consisted in a steam-flaked corn-based finishing diets containing 51% higher fiber (HF) vs 64% lower fiber (LF) nonstructural carbohydrates (Table 1). The total nonstructural carbohydrate concentration of the diets was manipulated using dried distiller grain plus solubles and forage (alfalfa hay). Accordingly, nonstructural carbohydrates and neutral detergent fiber (NDF) concentrations were 51.3% and 64.2%, and 21.7% and 13.3% to HF and LF, respectively. Steers were allowed ad libitum access to feed and water. Fresh feed was provided twice daily at 06:00 and 14:00 h, offering approximately 30% of daily consumption in the morning feeding and the remainder in the afternoon feeding. Feed and refusal samples were collected daily for DM analysis, which involved oven drying the samples at 105°C until no further weight loss occurred (method 930.15 [11]). The experiment lasted 308 days.
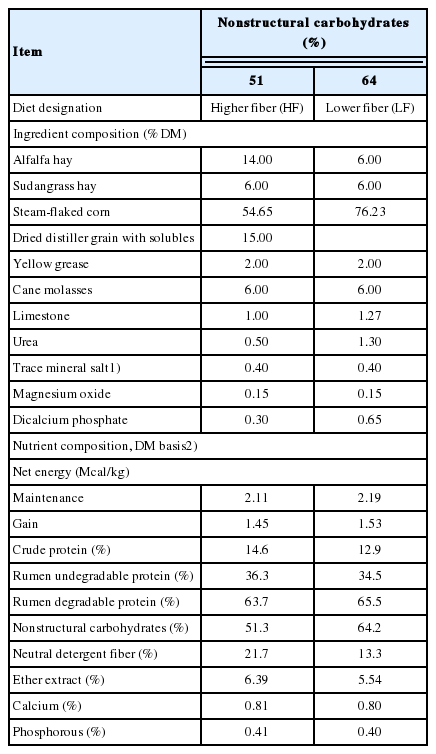
Composition of experimental diets
Hot carcass weights (HCW) were obtained at time of slaughter. After carcasses chilled for 24 h, the following measurements were obtained: Longissimus muscle (LM) area (cm2) by direct grid reading of the muscle at the 12th rib; subcutaneous fat (cm) over the LM at the 12th rib taken at a location 3/4 the lateral length from the chine bone end (adjusted by eye for unusual fat distribution); kidney, pelvic and heart fat (KPH) as a percentage of HCW; marbling score ([12] using 3.0 as minimum slight, 4.0 as minimum small, 5.0 as minimum modest, 6.0 as minimum moderate, etc.), and estimated retail yield of boneless, closely trimmed retail cuts from the round, loin, rib and chuck (% of HCW) = 52.56 − 1.95×subcutaneous fat − 1.06×KPH + 0.106×LM area − 0.018×HCW [13].
Calculations
Energy gain (EG, Mcal/d) was calculated by the equation: EG = 0.0557×shrunk body weight (SBW)0.75×average daily gain (ADG)1.097; where EG is the daily deposited energy and SBW is the equivalent of body weight×0.96 [14]. Maintenance energy (EM, Mcal/d) was calculated by the equation: EM = 0.084 SBW0.75 [15]. From the derived estimates of energy required for maintenance and gain, the NEm and NEg values of the diet were obtained using the quadratic formula:
Statistical analyses
The trial was analyzed as a randomized complete block design using the pen as experimental unit [17] according to the following statistical model: Yij = μ+Bi+Tj+ɛij, where μ is the common experimental effect, Bi represents initial weight block effect, Tj represent dietary treatment effect, and ɛij represents the residual error. Performance data were determined considering initial shrunk weight groupings for blocks. In determination of ADG, interim and final weights were reduced 4% to account for digestive tract fill. The effects of energy level in the diet were tested using orthogonal contrast. Significant difference was considered when the p-value was ≤0.05 and tendencies when p>0.05≤0.10. Data were analyzed using the MIXED procedure of SAS [17].
RESULTS AND DISCUSSION
Treatment effects on growth performance, dietary net energy (NE) and carcass characteristics are shown in Table 2, 3. Steers fed HF diet showed marked improvement (8.8%, p = 0.03) in ADG during the initial 112-d period. This effect was followed by a numerical trend for greater ADG throughout the remainder of the study so that overall ADG tended to be greater (4.9%, p = 0.06) for the HF than for LF.

Effects dietary nonstructural carbohydrate concentration on growth performance and dietary net energy of Holstein steers on long-term feeding

Effects of dietary nonstructural carbohydrate concentration on carcass characteristics of calf-fed Holstein steers
The relationship between observed and projected [18] incremental ADG during the course of the trial is shown in Figure 1. Overall projected ADG for the 308-d feeding period was 1.43 kg. This value agrees with observed overall ADG (1.43 kg) for steers fed the LF diet. Thus, the 5% greater ADG of steers on the HF diet was not due to a poorer than expected performance of steers on the LF diet. Rather instead, feeding the HF diet resulted in a greater than generally anticipated overall ADG for implanted calf-fed Holstein steers across the weight range in consideration. This effect is consistent with the hypothesis of this study; particularly apparent during the initial and final 112 d of the 308-d feeding period (Figure 1). However, it’s important to clarify that the substitution of steam-flaked corn with alfalfa and dry distillers grains with solubles (DDGS) increased crude protein concentration of the HF diet (14.6% vs 12.9% CP) versus that of the LF diet. Hence, a portion of the increase in ADG during the initial growing phase may be attributable to the great protein level of the HF diet. The latter is especially important, as lysine is a limiting amino acid during this period [3,19]. According to the diet formulation (Table 1) the metabolizable lysine for steers fed a LF diet during the first 112-d of the experiment was slightly lower of the requirements indicated by NRC ([19], Level 1).
With respect to forage level, Defoor et al [20] likewise observed that increasing dietary NDF in practical feedlot diets enhanced weight gain, presumably through reduction in day-to-day occurrence of subclinical digestive dysfuntions. Erratic patterns of intake have been associated with digestive disorders [21,22]. In the present study, variation in DMI (data not shown) was 23% lower in HF group (coefficient of variation = 5.34%) than in the LF group (coefficient of variation = 7.32%). Additionally, the risk of subclinical acidosis may be assessed in function of the non-structural carbohydrate:NDF ratio of the HF and LF diets (2.3 and 4.8, respectively; Table 1). Based on NRC [19], the predicted (Level 1 approach) average ruminal pH for steers fed the HF and LF diets are 5.82 and 5.69, respectively.
Notwithstanding differences in dietary NE (Table 1), treatment differences in DMI were not appreciable (p>0.10). Indeed, gain efficiency (ADG/DMI) and estimated dietary NE were greater (8.3% and 5.2%, respectively, p≤0.02) for HF vs LF during the initial 112-d period. Overall (308-d) gain efficiency and estimated dietary NE were similar (p≥0.69) for both dietary treatments. However, due to differences in tabular dietary NE, the ratio of observed:expected dietary NE tended to be greater (4.1%, p = 0.06) for the HF vs LF diet.
Consistent with the tendency for increased ADG, carcass weight also tended to be greater (11.2 kg, p = 0.10) for HF- vs LF-fed steers. Otherwise, there were no treatment effects (p> 0.10) on carcass characteristics. Although there was a tendency for a slightly greater (0.5%, p = 0.09) estimated carcass yield.
CONCLUSION
It is concluded that reducing the non-structural carbohydrate concentration of a conventional steam-flaked corn-based growing finishing diet for calf-fed Holstein steers can effectively enhance growth performance, particularly during the early growing and late finishing phases.
Notes
CONFLICT OF INTEREST
We certify that there is no conflict of interest with any financial organization regarding the material discussed in the manuscript.