Effects of dietary valine:lysine ratio on the performance, amino acid composition of tissues and mRNA expression of genes involved in branched-chain amino acid metabolism of weaned piglets
Article information
Abstract
Objective
The goal of this study was to investigate the effects of dietary standard ileal digestible (SID) valine:lysine ratios on performance, intestinal morphology, amino acids of liver and muscle, plasma indices and mRNA expression of branched-chain amino acid (BCAA) metabolism enzymes.
Methods
A total of 144 crossbred pigs (Duroc×Landrace×Large White) weaned at 28±4 days of age (8.79±0.02 kg body weight) were randomly allotted to 1 of 4 diets formulated to provide SID valine:lysine ratios of 50%, 60%, 70%, or 80%. Each diet was fed to 6 pens of pigs with 6 pigs per pen (3 gilts and 3 barrows) for 28 days.
Results
Average daily gain increased quadratically (p<0.05), the villous height of the duodenum, jejunum and ileum increased linearly (p<0.05) as the SID valine:lysine ratio increased. The concentrations of plasma α-keto isovaleric and valine increased linearly (p<0.05), plasma aspartate, asparagine and cysteine decreased (p<0.05) as the SID valine:lysine ratio increased. An increase in SID lysine:valine levels increased mRNA expression levels of mitochondrial BCAA transaminase and branched-chain α-keto acid dehydrogenase in the longissimus dorsi muscle (p<0.05).
Conclusion
Using a quadratic model, a SID valine:lysine ratio of 68% was shown to maximize the growth of weaned pigs which is slightly higher than the level recommended by the National Research Council [6].
INTRODUCTION
Lysine, threonine, methionine (and cystine) and tryptophan are the first four limiting amino acids (AA) in diets fed to weanling pigs while valine is among the next most limiting [1,2]. Valine is an indispensable branched-chain amino acid (BCAA) which cannot be synthesized by the animal and therefore must be supplied through the feed [3]. Several studies have been conducted to establish the optimum standardized ileal digestible (SID) valine:lysine ratio required by nursery pigs [3–5] and the results of these studies indicate the required ratio may exceed the 63% SID valine:lysine ratio currently recommended by NRC [6].
BCAA are primarily metabolized extra hepatically in the skeletal muscle [7,8], and they are also a precursor for the synthesis of other AA [9]. Valine, isoleucine and leucine compete for the same enzymes that catalyze the first two catabolic steps in their metabolism [10]. An oversupply of valine, isoleucine or leucine may stimulate the activity of BCAA-degrading enzymes and thereby stimulate the degradation of the other two BCAA, thus resulting in an increase in their requirement [11].
Wiltafsky et al [10] reported that an increase in the SID leucine:valine ratio in diets fed to pigs produced a 3-fold increase in branched-chain α-keto acid dehydrogenase (BCKDH) activity in the liver but reported no effect of leucine level on the mRNA expression of mitochondrial BCAA transaminase (BCATm). However, no studies have been conducted to estimate the effect of SID valine:lysine ratio on BCAA metabolism and degradation in weaned pigs. Therefore, the primary objectives of the current study were to determine the effects of altering the SID valine: lysine ratio on pig performance, intestinal morphology, plasma, liver, and muscle amino acid concentrations as well as the mRNA expression of BCATm and BCKDH in the longissimus dorsi muscle of weaned pigs in order to provide reliable information with which to more precisely establish the valine requirements of weaned piglets.
MATERIALS AND METHODS
All animal procedures used in this experiment were approved by the Institutional Animal Care and Use Committee of China Agricultural University (Beijing, China). The experiment was carried out at the National Feed Engineering Technology Research Center of the Ministry of Agriculture Feed Industry Center Animal Testing Base (Hebei, China).
Experimental design and diets
This study was conducted to determine the effects of altering the SID valine:lysine ratio on the performance and amino acid metabolism of 144 crossbred (Duroc×Landrace×Large White) pigs weaned at 28±4 days of age and weighing 8.79±0.02 kg body weight. The pigs were randomly allotted to 1 of 4 diets formulated to provide SID valine:lysine ratios of 50%, 60%, 70%, or 80%. The experimental diets were based on corn, extruded corn, soybean meal, and crystalline AA (Table 1). Peanut meal (60 g/kg) was included because of its low valine content which allowed the formulation of a valine deficient diet [12]. The dietary valine concentration of the remaining diets was altered by substituting 1.2, 2.4, or 3.6 g/kg of L-valine for an equivalent amount of corn. The supplemental L-valine (99% purity) was obtained from the CJ CheilJedang Company (Seoul, Korea).
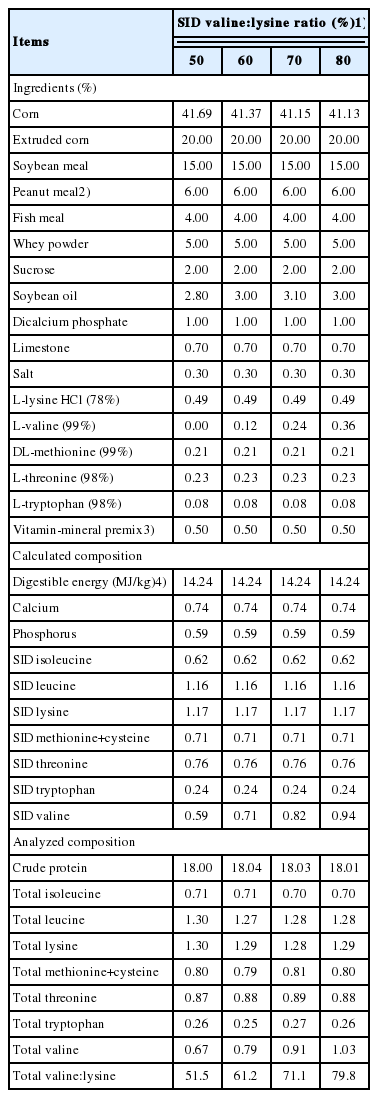
Composition and nutrient levels of experimental diets varying in standardized ileal digestible (SID) valine:lysine ratio (% as-fed)
The digestible energy, calcium and phosphorus contents of the diets were calculated using values for the ingredients obtained from NRC [6]. The concentrations of total AA in the diets are the result of an AA analysis conducted in duplicate. The SID AA content of the experimental diets was calculated by multiplying the analyzed AA content of the ingredients by the SID coefficients of the ingredients obtained from NRC [6] and summing the results (Table 1).
Each diet was fed to 6 pens of pigs with 6 pigs per pen (3 gilts and 3 barrows) and the experiment was run as a randomized complete block design. The pigs were housed in 1.8×2.1 m2 metabolic cages equipped with fully slatted, plastic floors throughout the experiment. The pigs were weighed after an over-night fast on d 0 and 28 to calculate average daily weight gain (ADG).
The pigs had free access to water via a nipple drinker and were fed 3 times a day (08:00, 14:00, and 18:00 hours) using a single-sided 3-hole feeder. Sufficient feed was added to the feeder to ensure ad libitum access. The amount of feed added was recorded and summed to determine the feed intake for the 28-d experiment. This value was divided by 28 to determine average daily feed intake (ADFI) for the experimental period. Feed efficiency (ADG/ADFI) was then calculated from ADG and ADFI. The temperature in the rooms was decreased weekly from 28°C in the first week to 24°C in the last week. The lights were on from 07:30 until 18:30 hours.
Sample collection
Feed samples were collected and pooled weekly to determine the nutrient levels of the experimental diets. For the determination of plasma biochemical indices, branched-chain keto-acid (BCKA) and AA concentrations, blood was collected from one pig per pen via the jugular vein into 10-mL heparinized vacutainer tubes (Becton Dickinson Vacutainer Systems, Franklin Lakes, NJ, USA) on d 28 following an overnight fast. Samples were centrifuged (Biofuge22R; Heraeus, Hanau, Germany) at 3,000×g for 10 min, and the plasma was kept at −80°C until analyzed.
At the end of the 28-day experiment, the 24 pigs used for blood sampling were killed under commercial conditions by electrical stunning followed by exsanguination and then tissue samples were collected. The small intestine was dissected from the mesentery and immediately placed on ice. The duodenum was considered as the part of the intestine from the pylorus to the ligament of Treitz, a segment of the small intestine 10 cm proximal to the ileocecal junction was considered as the ileum, and the remainder of the small intestine was considered as the jejunum [13]. Segments (3 cm in length) of the mid-duodenum, mid-jejunum, and mid-ileum (the entire alimentary canal without any digesta) were fixed in 10% neutral buffered formalin for subsequent histological measurement. In addition, samples (about 10 g) of the liver and longissimus dorsi muscle, dissected from the left side of the carcass of four piglets per treatment, were placed in liquid nitrogen and then stored at −80°C until needed for analysis.
Chemical analysis
All chemical analyses were conducted according to the methods of the AOAC [14]. Analysis of the crude protein content of the ingredients and experimental diets was conducted according to AOAC Method 978.04 (AOAC) [14]. For the analysis of AA except for methionine, cysteine and tryptophan, ingredients and diets were hydrolyzed in 6 N HCl at 110°C for 24 hours (AOAC Method 999.13). Methionine and cysteine were determined after cold performic acid oxidation overnight and hydrolyzed with 7.5 N HCl (AOAC method 994.12). Tryptophan was determined using reverse-phase high-performance liquid chromatography (HPLC, Waters 2690, Milford, MA, USA) after alkaline hydrolysis at 120°C for 16 hours.
Plasma AA were determined using Ion Exchange Chromatography with a S-433D Amino Acid Analyzer (Sykam, Eresing, Germany) as described by Sedgwick et al [15]. Determination of plasma biochemical indices were carried out using an Automatic Biochemical Analyzer (Hitachi 7020, Tokyo, Japan). Plasma α-keto isocaproate, α-keto isovalerate and α-keto-β-methylvalerate were measured according to the method of Pailla et al [16]. In brief, branched-chain keto acids were derivatized with o-phenylene-diamine to give fluorescent derivates, which were separated chromatographically on a Reverse-Phase Column (Spherisorb ODS-2, 4.6×250 mm column filled with 5 mm particles, Waters, Eschborn, Germany) using a binary gradient (L-7100, Merck-Hitachi, Japan). Detection was performed Fluorometrically (FL Detector L-7480, Merck-Hitachi, Japan). α-keto-valerate was used as an internal standard.
Muscle and liver samples (10 g) were thawed, homogenized within animal and diet, lyophilized in a vacuum-freeze dryer (Tofflon Freezing Drying Systems, Shanghai, China), and ground through a 1-mm screen. Freeze-dried samples (50 mg) of liver and longissimus dorsi muscle were used to measure AA composition using the same methods as described above for plasma. Amino acid analysis was conducted using HPLC (L-8800 AA Analyzer; Hitachi, Japan).
Samples from each intestinal segment were embedded in paraffin and cut into 5-μm serial sections, and five non-successive sections from each tissue sample were selected and stained with hematoxylin–eosin for identification [13]. Six well-oriented villi (determined as the distance between the crypt openings and the end of the villi) and their associated crypt (measured from the crypt-villous junction to the base of the crypt) per section were selected and measured under a light microscope (CK-40, Olympus, Tokyo, Japan) at 40×magnification and analyzed with an Image Analyzer (Lucia Software. Lucia, ZaDrahou, Czechoslovakia). The average of these measurements was calculated to yield a single value for each pig. These procedures were conducted by an observer unaware of the dietary treatments.
Total RNA was isolated from muscle and liver tissue using the TRIzol reagent (Invitrogen, Carlsbad, CA, USA). The quality and quantity of RNA were determined by Ultraviolet Spectroscopy using a NanoDrop ND-1000 (Thermo Fisher, Wilmington, DE, USA). The A260/280 ratios were always between 1.9 and 2.1, and RNA integrity was evaluated using electrophoresis with 1.5% agarose and ethidium bromide staining (1.25 ng/μL; Sigma-Aldrich, St. Louis, MO, USA). Thereafter, about 1 μg of total RNA was incubated with DNase I (Fermentas, Waltham, WI, USA) followed by Reverse Transcription using a First-Strand cDNA Synthesis Kit (Promega, Madison, WI, USA) according to the manufacturer’s protocol. The cDNA was synthesized with Oligo dT and Superscript II Reverse-Transcriptase, and stored at −80°C before further processing. The primer sequences used for the selected genes are listed in Table 9.
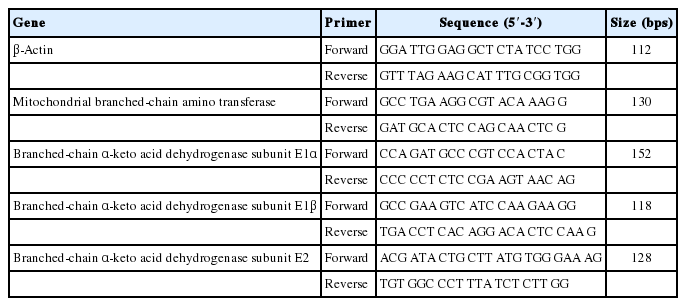
Sequence of primers used for quantitative real time-polymerase chain reaction and product sizes
The relative expressions of the target genes were determined by real-time polymerase chain reaction (PCR) using an ABI7900HT PCR system (Applied Biosystems, Forrest City, CA, USA). Real-time PCR was performed in duplicate for each cDNA sample, using SYBR Green I as a PCR core reagent in a final volume of 20 μL. The PCR conditions used were incubation for 10 min at 95°C, followed by 40 cycles of denaturation for 15 s at 95°C with subsequent annealing and extension for 60 s at 56°C to 64°C. β-Actin was used as an internal control to normalize the expression of the target genes. mRNA expression levels of the target genes, expressed as arbitrary units, were acquired from the value of the threshold cycle (Ct) of real-time PCR relative to that of β-actin using the comparative Ct method, according to the following formula: 2−ΔΔCt(−ΔΔCt = Ct gene of interest – Ct β-actin)treat – (Ct gene of interest – Ct β-actin)control.
Statistical analysis
The data were statistically analyzed using the MIXED procedure of SAS (SAS Institute, Cary, NC, USA) with pen as the experimental unit. The model included diet as a fixed effect and sex and replicate as random effects. However, no significant sex effects were observed for any trait measured and therefore sex was removed from the statistical analysis. Polynomial contrasts were conducted to determine the linear and quadratic effects of altering the SID valine:lysine ratios. All values are reported as least square means.
mRNA expression data were analyzed using the relative quantification method that describes the change in target gene expression relative to that of the control group. β-Actin was used as a normalizing internal control to adjust for the amount of RNA added to the reverse transcription reactions. Cycle thresholds of the target genes were subtracted from the control gene index (ΔCt) for normalization and the treatment groups were compared with the control group (ΔΔCt; [17]). Treatment effects were considered significant if p<0.05 whereas values between 0.05 and 0.10 were considered as indicative of a statistical trend.
Polynomial contrasts were conducted to determine the optimum ratio of SID valine:lysine to maximize specific traits. In order to be selected as a trait to establish the requirement, the trait had to show a significant quadratic effect and be of major economic importance. Based on our experiment, only ADG met these two essential criteria. Therefore, using a quadratic model, the ADG of weaned pigs was plotted against SID valine:lysine ratio. The data were analyzed by a quadratically fitted line [y = a×x2+b×x+c, with the maximum quadratic = −b/(2a)].
RESULTS
Growth performance
Table 2 shows the effects of altering the SID valine:lysine ratio on the performance of weaned pigs. The ADG of the pigs was altered quadratically (p<0.05) from d 1 to 28 as the dietary SID valine: lysine ratio increased. Daily SID valine intake was linearly and quadratically altered (p<0.01) while average daily feed intake and feed efficiency of weaned piglets were not influenced by the SID valine:lysine ratio fed (Table 2).
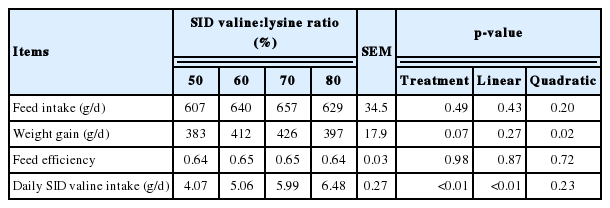
Effects of standard ileal digestible (SID) valine:lysine ratio on the performance of weaned piglets (d 0 to 28)
Figure 1 shows the effect of plotting ADG against the dietary SID valine:lysine ratio. The final equation was y = −0.14×(SID valine:lysine)2+19.1×(SID valine:lysine) −214; R2 = 0.96]. According to the quadratic model, a dietary SID valine:lysine ratio of 68% maximized growth of weaned pigs (Figure 1).
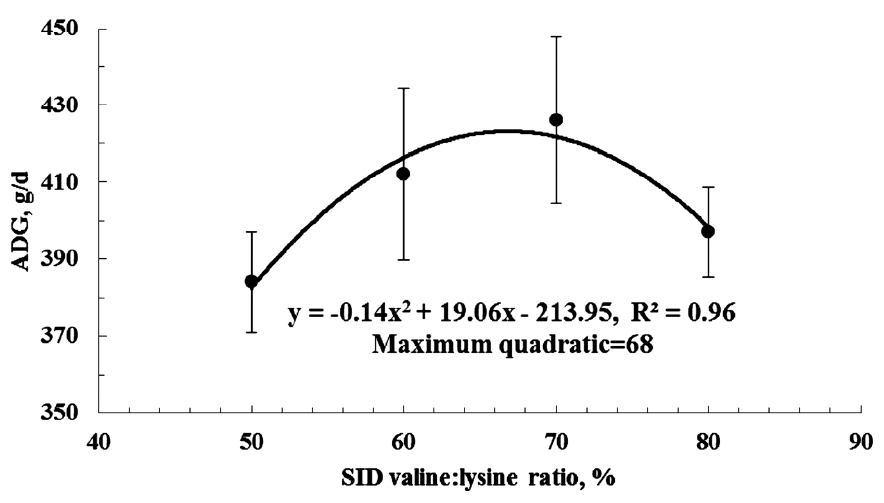
Quadratic model (---) of average daily gain (ADG) of weaned piglets plotted against standardized ileal digestible (SID) valine to lysine ratio. Using a quadratic model, the SID valine:lysine was 68% [y = −0.14×(SID valine:lysine)2+19.1×(SID valine:lysine)−214; R2 = 0.96].
Morphology of small intestine
Table 3 shows the effects of altering the SID valine:lysine ratio on the intestinal morphology of weaned piglets. Pigs fed the valine deficient diet (50% SID valine:lyine) had a lower villous height in the duodenum, jejunum and ileum (p<0.05) than pigs fed the valine supplemented diets. In addition, the villous height to crypt depth ratio in the duodenum of pigs increased (p<0.05) as the SID valine:lysine level increased (Table 3).
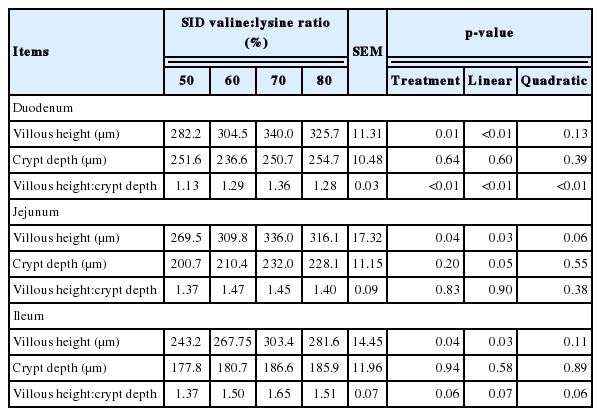
Effects of standard ileal digestible valine:lysine ratio on the intestinal morphology of weaned piglets (d 28)
Blood metabolites and plasma amino acids
Table 4 shows the effects of altering the SID valine:lysine ratio on plasma biochemical indices. The plasma levels of albumin, globulin, glucose, triglyceride and urea were unaffected by altering the SID valine:lysine ratio (Table 4).
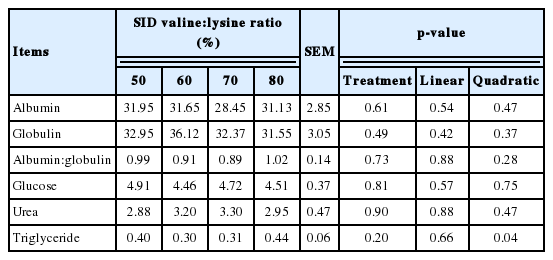
Effects of standard ileal digestible (SID) valine:lysine ratio on plasma biochemical indices of weaned piglets (mmol/L)
Table 5 shows the effects of altering the SID valine:lysine ratio on the AA levels in the plasma of weaned pigs. The plasma valine levels of pigs were significantly increased (p<0.01) by an increase in the SID valine:lysine ratio. Plasma aspartate and cysteine were linearly decreased (p<0.01), while asparagine was quadratically decreased (p<0.05) when an increased SID valine:lysine ratio was fed (Table 5).
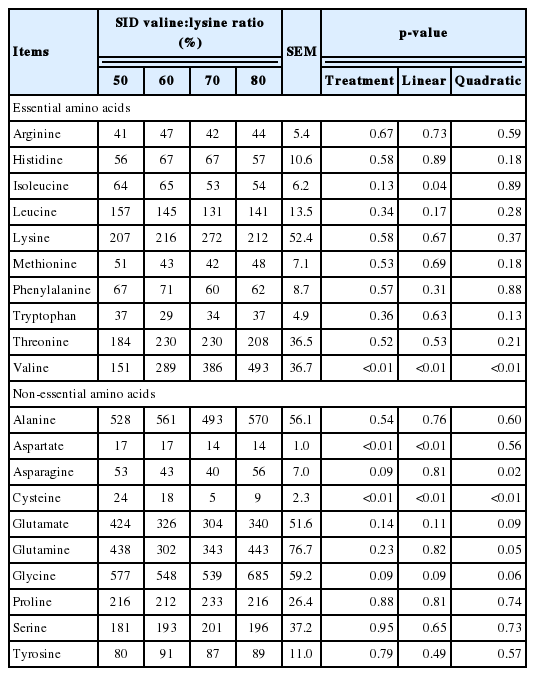
Effects of standard ileal digestible (SID) valine:lysine ratio on amino acid concentration in the plasma of piglets (nmol/mL)
Table 6 shows the effects of altering the SID valine:lysine ratio on branched chain keto AA in the plasma of weaned pigs. The α-keto isovaleric acid concentration in the plasma of pigs was linearly increased (p<0.01) with an increased SID valine:lysine level (Table 6). However, α-keto isocaproate and α-keto-β-methlyvalerate were unaffected by dietary treatment.
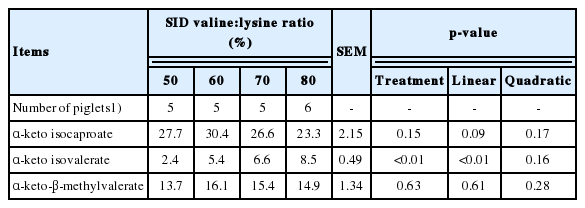
Effects of standard ileal digestible (SID) valine:lysine ratio on plasma branched-chain keto acids of weaned piglets (μmol/L)
Muscle and liver amino acids
No significant change was observed in the valine concentration of liver tissue due to treatment (Table 7). However, liver cysteine concentrations increased linearly (p<0.01) and liver glutamate showed a trend to decrease linearly (p = 0.06) with increased SID valine:lysine ratio (Table 7).
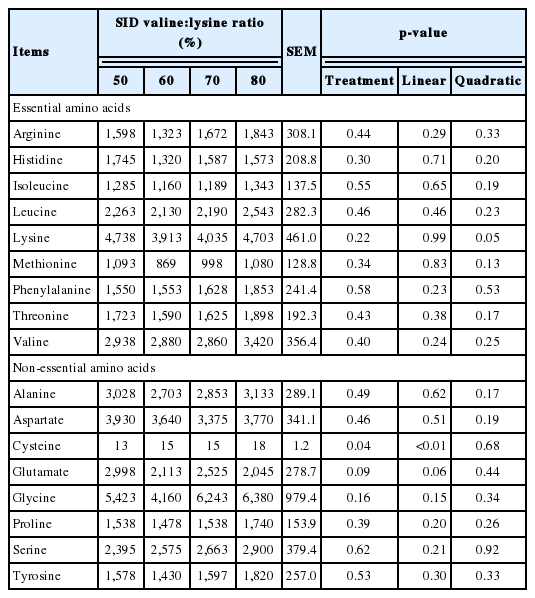
Effects of standard ileal digestible (SID) valine:lysine ratio on the concentration of amino acids in the liver of piglets (nmol/mL)
The effects of SID valine:lysine ratio on the concentration of AA in the muscle of pigs is shown in Table 8. Valine and serine concentrations in pig muscle decreased linearly (p<0.05) and proline showed a trend to decrease (p<0.10) when the SID valine: lysine ratios were increased (Table 8).
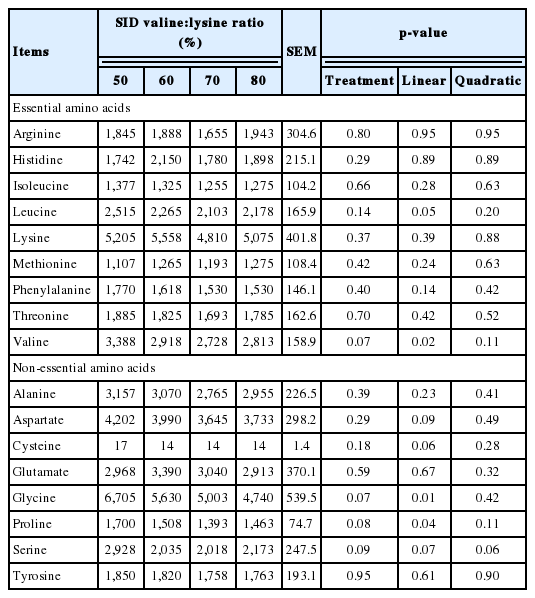
Effects of standard ileal digestible (SID) valine:lysine ratio on the concentration of amino acids in the muscle of piglets (nmol/mL)
mRNA expression
The sequences of the primers used for real time-PCR and their product sizes are shown in Table 9. The size of the primers ranged from 112 bps for β-actin to 152 bps for the branched chain α-keto acid dehydrogenase subunit E1α.
The effect of SID valine:lysine ratio on the relative mRNA expression of BCAA catabolism genes in the muscle of weaned piglets is shown in Table 10. Increasing the dietary SID valine: lysine supply increased (p<0.05) the mRNA expression of BCATm and BCKDH subunit (E1α, E1β, and E2) genes in skeletal muscle (Table 10).
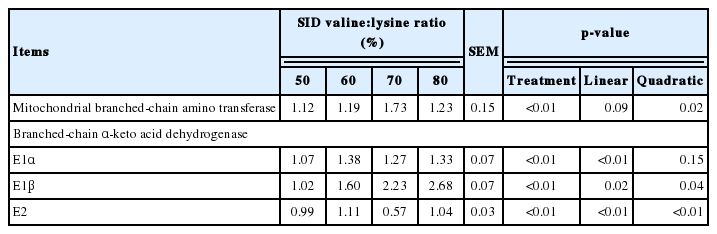
Effects of standard ileal digestible (SID) valine:lysine ratio on the relative mRNA expression of branched-chain amino acid catabolism genes in the muscle of weaned piglets
DISCUSSION
The weight gain of pigs increased quadratically when the dietary SID valine:lysine ratio increased. Feeding a valine deficient diet (i.e. 50% SID valine:lysine) or a diet in which excess valine was present (i.e. 80% SID valine:lysine) both decreased weight gain. A reduction in ADG caused by a deficiency in valine has been previously reported. Gaines et al [18] and van Milgen et al [19] concluded that a valine deficiency significantly decreased ADG but the addition of L-valine to a valine deficient diet restored pig performance. A linear response was observed up to a supply of approximately 70% SID valine:lysine, but a further increase in valine concentration did not improve performance [4].
A potential explanation for the effects of alterations in the SID valine:lysine ratio on ADG could be due to the changes observed in intestinal morphology. The folds in the intestine called villi are an important exchange area for digestion and absorption [20]. Villous height and crypt depth are critical factors affecting the pig’s ability to absorb nutrients [21]. In the current study, increasing the dietary SID valine:lysine ratio resulted in a significant increase in the villous height in the duodenum, jejunum, and ileum as well as a decline of villous height:crypt depth ratio in the duodenum and ileum. The improvement in villous height would increase the surface area available for absorption of nutrients and thereby enhance the efficiency of nutrient utilization in pigs which may partially explain the improved ADG of pigs fed valine-supplemented diets.
Wiltafsky et al [22] reported that plasma valine concentrations increased rapidly in a linear manner as the SID valine:lysine ratio increased. A similar finding was observed in the present experiment as plasma valine levels continued to increase as the SID valine:lysine ratio increased. The finding that the levels of plasma valine increased as the level of SID valine:lysine increased provides evidence that the additional valine being provided was being effectively and efficiently absorbed from the gastrointestinal tract supporting the suggestion that increasing the SID valine:lysine ratio increases the surface area available for absorption of nutrients from the small intestine and thereby enhances the efficiency of nutrient utilization in the pig.
In addition to valine, other plasma amino acids were altered by the SID valine:lysine ratio being fed. Increased protein synthesis and amino acid catabolism could decrease the plasma concentrations of amino acids. This could mean that the plasma amino acids such as aspartate and cysteine, which were observed to be decreased in the present experiment, were used to synthesize muscle protein which corresponded with the improvement in ADG observed in the present study. A similar result was previously observed by Melchior et al [23].
The quadratic changes in plasma glycine and cysteine concentrations which were observed in the present experiment as the dietary SID valine:lysine ratio increased may reflect increased glutathione synthesis. Glutamate, glycine and cysteine can synthesize glutathione, an important tripeptide involved in antioxidant defenses [24]. Therefore, improvements in immune status may also at least partially explain the improvements in ADG observed as the SID valine:lysine level increased.
The concentrations of α-keto isocaproate and α-keto-isovalerate were altered in the same direction as the corresponding BCAA concentrations [25]. Increasing the dietary valine supply significantly increased the plasma α-keto-isovalerate levels in the present study, whereas the α-keto-β-methylvalerate and α-keto isocaproate concentrations were not affected. Berea et al [4] also reported that dietary valine content did not affect α-keto-β-methylvalerate and α-keto isocaproate concentrations, but 75% and 80% SID valine:lysine improved α-keto-isovalerate concentration. The positive correlation between the plasma valine and α-keto-isovalerate demonstrated an increased valine degradation of pigs. This could demonstrate in an activation of BCKDH due to valine supplementation and could increase decarboxylation of α-keto-isovalerate [25]. Some research reported that BCKA could reduce the oxidation of methionine by competitive inhibition, leading to increased availability of methionine for body protein synthesis [25,26]. We conclude that the increased α-keto-isovalerate concentration may lead to increased availability of other amino acids for body protein synthesis and also improved pig performance.
To provide a molecular mechanism to explain how dietary valine might improve the ADG of pigs, additional measurements were made to evaluate the mRNA expression levels of BCAA metabolic enzymes. In particular, a high α-keto isocaproate concentration (the corresponding α-keto acid of leucine) appears to increase the catabolism of the other BCAA by stimulation of BCKDH activity [27]. It was reported that the activity of BCATm in muscle was higher than in liver [10], so we made a determination about mRNA expression levels of BCATm in muscle to show the effects of increased valine concentrations on BCAA metabolism. The BCKDH complex consists of three catalytic components (E1 subunit, E2 subunit, and the E3 subunit) [28]. In contrast to the other subunits, the E3 is not BCKDH-specific and its expression was not analyzed in the present work.
Wiltasky et al [10] reported that valine and isoleucine were unimportant for the regulation of BCKDH activity. However, we observed an increased mRNA expression with increased dietary valine ratios in our study and this could be explained by the larger amount of α-keto-isovalerate produced. Paxton and Harris [27] also concluded that enhanced levels of BCKA could inhibit the BCKDH kinase, which results in a reduced phosphorylated BCKDH complex and therefore a higher BCKDH activity. This response of BCKDH to α-keto-isovalerate may explain how valine excess reduced the concentrations of leucine, isoleucine and α-keto isocaproate in plasma. The BCKA formed are then irreversibly decarboxylated by the BCKDH to form acyl-CoA compounds which are further metabolized by a series of reactions [29], so the improved pig performance can be explained by the increased mRNA expression levels of BCATm and BCKDH in the study. The increased mRNA expression of BCKDH meant an increase in BCAA catabolism and thus may cause the improved isoleucine and leucine requirement, which could explain the depression in performance in pigs fed the 80% SID valine:lysine treatment.
In the present experiment, the dietary SID valine:lysine ratio required for weaned pigs was 68% using a quadratic model which was slightly higher than the current NRC [6] recommendation of 63%. This discrepancy was also reported by Kendall et al [30], Xie et al [31], and Liu et al [32] who found that the requirements were higher using a quadratic model than a linear broken-line model.
The broken-line model may underestimate the requirement while the quadratic model commonly overestimates the requirement [33,34]. However, Robbins et al [34] concluded that quadratic models had an advantage over linear models as they more accurately describe the physiological course of metabolism.
Gloaguen et al [5] reported that when a diet deficient in valine but with excessive leucine was offered to pigs, there was a rejection of the diet deficient in BCAA. Therefore, the reduction in ADG observed in the present study may be attributed to BCAA antagonism. The first two steps in BCAA catabolism involve enzymes common to all three BCAA [11]. The first step is reversible and is catalyzed by branched-chain amino transferase (BCAT), whereas the second step is oxidatively decarboxylated by a mitochondrial, multi-enzyme BCKDH complex. This step is irreversible, highly regulated and rate limiting for BCAA catabolism. Valine, isoleucine and leucine compete for the same enzymes that catalyze the first two catabolic steps [10], and therefore excess valine influences the catabolism of leucine and isoleucine.
CONCLUSION
The overall results of this study indicate that the ADG of the pigs was quadratically altered as the dietary SID valine:lysine ratio increased. The effects of the alterations in SID valine:lysine ratio on ADG could be due to the changes observed in intestinal morphology. Increasing the dietary SID valine:lysine ratio resulted in a significant improvement in villous height in the duodenum, jejunum and ileum as well as a decline of villous height:crypt depth ratio in the duodenum and ileum. The improvement in villous height would increase the surface area available for absorption of nutrients and thereby enhance the efficiency of nutrient utilization in pigs which may partially explain the improved ADG of pigs fed valine-supplemented diets. An increase in SID lysine: valine levels also increased mRNA levels of mitochondrial BCATm and BCKDH in the longissimus dorsi muscle. A SID valine:lysine ratio of 68% was shown to maximize the growth of weaned pigs using a quadratic model. This value is slightly higher than the level currently recommended by the NRC [6].
ACKNOWLEDGMENTS
This research was supported by the National Natural Science Foundation of China (31372316; 31772612). The authors thank CJ CheilJedang Company (Seoul, Korea) for providing the valine used for the present study.
Notes
CONFLICT OF INTEREST
We certify that there is no conflict of interest with any financial organization regarding the material discussed in the manuscript.