Effects of various weaning times on growth performance, rumen fermentation and microbial population of yellow cattle calves
Article information
Abstract
Objective
This study was conducted to investigate the effects of weaning times on the growth performance, rumen fermentation and microbial communities of yellow cattle calves.
Methods
Eighteen calves were assigned to a conventional management group that was normally weaned (NW, n = 3) or to early weaned (EW) group where calves were weaned when the feed intake of solid feed (starter) reached 500 g (EW500, n = 5), 750 g (EW750, n = 5), or 1,000 g (EW1,000, n = 5).
Results
Compared with NW, the EW treatments increased average daily gain (p<0.05). The calves in EW750 had a higher (p<0.05) starter intake than those in EW1,000 from wk 9 to the end of the trial. The concentrations of total volatile fatty acids in EW750 were greater than in NW and EW1,000 (p<0.05). The EW treatments decreased the percentage of acetate (p<0.05). The endogenous enzyme activities of the rumen were increased by EW (p<0.05). EW had no effect on the number of total bacteria (p>0.05), but changes in bacterial composition were found.
Conclusion
From the present study, it is inferred that EW is beneficial for rumen fermentation, and weaning when the feed intake of the starter reached 750 g showed much better results.
INTRODUCTION
The early weaning of calves has many advantages over prolonged feeding with milk or milk replacements. And these advantages are highly efficient growth and improved feedlot performance [1] and carcass quality [2]. On the other hand, weaning calves early could also shorten the postpartum resumption of reproduction in dams [3].
Nevertheless, although a higher feed conversion ratio can be obtained through early weaning, an appropriate weaning time is the key link to early weaning techniques. If calves are weaned too early and the supplied feed is inappropriate, the death rate of the calves can increase. Additionally, if calves are weaned too late, the cost of nurturing them increases, and the development of their digestive organs becomes retarded, affecting the productive performance of the adult cattle.
Decades of research have focused on the weaning time of ruminants [4]. These efforts have focused almost exclusively on growth and productive performance. However, studies on the ruminal compartment of calves, as influenced by the weaning time, are limited. The rumen compartment of the ruminant digestive tract is an enlarged fermentation chamber housing a diverse collection of symbiotic microorganisms that provide the host animal with a remarkable ability to digest lignocellulosic plant materials [5]. Furthermore, ruminal microbes can ferment solid feeds to produce volatile fatty acids, which subsequently stimulate the morphological development of the rumen [6]. Lengemann and Allen [7] reported that prolonged milk feeding was found to delay the onset of typical ruminal microflora. Thus, this study addresses the effect of various weaning times on the rumen fermentation and microbial communities of beef calves, and the objective was to find a suitable weaning time for calves from the perspective of the rumen.
MATERIALS AND METHODS
Animals, feeds, and experimental design
All experimental protocols were approved by the Animal Care Committee, Zhejiang A and F University, Hangzhou-Lin’an, China. And the experimental procedures used in this study were in accordance with the university’s guidelines for animal research. Eighteen neonatal female beef calves (yellow cattle in South China) were used in this study. Three lived with their dam and were weaned as normal at 240 d (NW, n = 3), serving as the control. The control animals sucked their cow’s milk and had free access to the grass. The others composed the early weaned (EW) treatments where the calves were weaned when the feed intake of solid feed (starter) reached 500 g (EW500, n = 5), 750 g (EW750, n = 5), and 1,000 g (EW1,000, n = 5) for three consecutive days, respectively. All calves had colostrum within 4 hours of birth, and the EW calves were fed fresh milk up to 2 L/d until d 7. A liquid feed comprising half fresh milk and half milk replacer (MR, 93.2% dry matter, 23.9% crude protein [CP], and 13.1% ether extract, Patent No: ZL02 128844.5; dissolved by approximately 38°C water at w:v = 1:7 before using) was fed to the calves at a maximum rate of 3 L/d until d 13 and then 3 L/d MR for the remainder of the study. Dry feed starter (Pellet, 6 mm diameter and 10 mm long) was fed twice daily at 0900 and 1600 h. The starter contained 58.5% corn, 27.0% soybean meal, 10.0% wheat bran, 1.0% salt, 1.1% dicalcium phosphate, 1.4% limestone, and 1.0% premix. The chemical composition of the starter was 17.9% CP, 10.9 MJ/kg metabolizable energy, 20.7% neutral detergent fiber, 4.5% acid detergent fiber, 0.8% Ca, and 0.6% P. The premix provided a per kg of pellet diet as follows, vitamin A 15,000 IU, vitamin D 5,000 IU, vitamin E 50 mg, Fe 90 mg, Cu 12.5 mg, Mn 60 mg, Zn 100 mg, Se 0.3 mg, I 1.0 mg, and Co 0.5 mg. Starter, grass hay and water were available ad libitum. The starter was formulated to meet the nutrient requirements of beef cattle according to the Chinese feeding standard (China Standard NY/T 815).
Growth performance
The amounts of milk, MR, starter and hay intake were recorded daily. All calves were weighed on the first morning of the 1st week after birth and every 4 weeks. The average daily gain (ADG) was calculated based on the weights.
Rumen fermentation parameters
After the calves were weaned, an oral stomach tube was used to collect the rumen fluid samples before morning feeding from all calves [8] to analyze the rumen fermentation parameters, ruminal enzyme activity and microbial communities. The pH of the rumen liquor was determined using a pH meter (Model PB-20, Sartorius). The ammonia N concentration was determined by a spectrometer (Model 721) using colorimetry with NH4Cl solution as a standard. For the determination of volatile fatty acids (VFAs), a 2 mL sample of the fermentation medium was placed in centrifugal tubes, mixed uniformly with 0.5 mL of 25% ortho-phosphoric acid, and then centrifuged at 10,000 rpm for 10 min. The supernatant was analyzed using gas chromatography (GC-8A, Shimadzu Corp., Kyoto, Japan). The temperature of the injector/detector and the column were 260°C and 220°C, respectively. The concentrations of microbial crude protein (MCP) were estimated using a purine method as described by Makkar and Becker [9].
Enzyme activities
The rumen content samples were submitted to ultrasonic disintegration in an ice bath for 10 min (3 s for work, 5 s for rest) at 20 kHz. The resultant samples were subjected to centrifugation at 28,000 g for 20 min at 4°C. The clear supernatant was used for determining ruminal hydrolytic enzyme activity. Cellulose, xylanase and amylase activities (μmol of sugar released/h per gram of total ruminal content dry matter) were determined according to Martin [10] by measuring the release of reducing sugars from the substrates (carboxymethy cellulose [CMCase], microcrystalline cellulase [MRCase], xylan and starch, Sigma-C9481, Sigma-MKBB4236, Sigma-X4252, and Sigma-S4126) for 30 min at 39°C with 0.2 mL of substrate and 0.1 mL of enzymatic sample. After that, 0.4 mL 3,5-dinitrosalicyIic acid was added to the mixture, which was then incubated for 5 min at 100°C to stop the hydrolysis reaction. The reducing sugars were quantified by spectrophotometry at 540 nm after the reaction [11].
Total DNA extraction and real-time quantitative polymerase chain reaction
Microbial DNA was extracted using the bead-beating method described by Gagen [12]. All DNA samples were quantified using Qubit 2.0 (Invitrogen, Waltham, MA, USA). The amplifying primer sets of total bacteria, Fibrobacter succinogenes (F. succinogenes), Ruminococcus albus (R. albus), Ruminococcus flavefaciens (R. flavefaciens), and Butyrivibrio fibrisolvens (B. fibrisolvens) are listed in Table 1. Absolute quantitative real-time polymerase chain reaction (PCR) was performed using the ABI 7500 real-time PCR system (Applied Biosystems, Foster City, CA, USA) as described by Chen [13] with fluorescence detection of SYBR green dye.
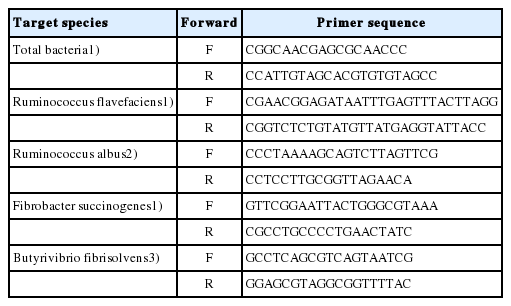
PCR primers for real-time polymerase chain reaction assay
Calculation and statistical analyses
The standard curves of total bacteria, F. succinogenes, R. albus, R. flavefaciens, and B. fibrisolvens were as follows: Total bacteria Y = −3.2554X+37.545 (R2 = 0.9929, E = 104.17%); F. succinogenes Y = −3.3183X+36.376 (R2 = 0.9974, E = 100.15%); R. albus Y = −3.3691X+36.317 (R2 = 0.9962, E = 99.53%); R. flavefaciens Y = −3.3224X+35.775 (R2 = 0.9988, E = 99.98%), and B. fibrisolvens Y = −3.2491X+38.978 (R2 = 0.9967, E = 103.14%), where X is the logarithm of the copy numbers, Y is the threshold cycle, and E is the amplification efficiency.
A general linear model procedure (SAS Inst. Inc., Cary, NC, USA) was used to analyze the data. The data were analyzed by one-way analysis of variance. Multiple comparisons of the means among treatments were conducted using Duncan’s multiple range tests. The degree of significance was defined as follows: p>0.10, not significant; p = 0.05 to 0.10, trends; p≤0.05, significant.
RESULTS
Weaning age, feed intake and growth performance
The results of the average weaning ages and growth performance of yellow cattle calves affected by different weaning times are shown in Table 2. The average weaning age was different: 46 d, 58 d, and 63 d for EW500, EW750, and EW1,000, respectively. Early weaning increased the final BW (p<0.05), with the highest value in EW750. Thus, ADG was greater in EW750 than in the other groups (p<0.05).

Effects of various weaning times on the weaning ages and growth performance of yellow cattle calves
From 5 to 9 weeks of age, the average milk intake of EW1,000 was the highest, while the starter intake in EW1,000 was lower than in the other two EW groups (p<0.05). Compared with NW, EW had a higher hay intake (p<0.05). However, from wk 9 to wk 21, the starter intake of EW1,000 was significantly lower than those of the other two EW groups (p<0.05).
Rumen fermentation parameters
The effects of various weaning times on the rumen fermentation of yellow cattle calves are presented in Table 3. Compared with NW, the EW calves had a lower rumen pH (p<0.05), but all values were in the normal range. The concentrations of VFAs were enhanced by EW (p<0.05), with the greatest value observed in EW750. For EW, the proportion of acetate decreased (p<0.05), but the proportion of propionate increased (p<0.05), resulting in a reduction in the acetate-to-propionate ratio (p<0.05). Compared with NW, EW increased the butyrate proportion (p<0.05), with the greatest value observed in EW750. Ammonia N was decreased in EW500 (p<0.05) compared with NW. MCP was not affected by EW (p>0.05).

Effects of various weaning times on the rumen fermentation of yellow cattle calves
Rumen enzyme activities
The changes of the ruminal enzyme activity in beef calves affected by various weaning times are shown in Table 4. Compared with NW, the activities of CMCase was increased in EW750 (p<0.05), and the xylanase activity was enhanced in EW500 (p<0.05). The MRCase and amylase activities were greater (p<0.05) in EW500 and EW750 than in NW or EW1,000.
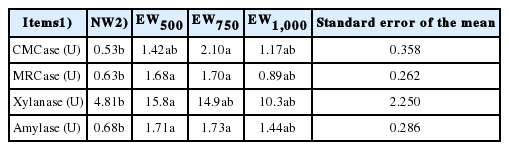
Effects of various weaning times on ruminal enzyme activity in yellow cattle calves
Rumen microbial communities
Early weaning had no effect on the number of total bacteria (p> 0.05), but it could alter its composition (Table 5). The population of R. albus was increased in EW750 and EW1,000 versus in NW or EW500 (p<0.05), whereas there was no significant difference in the number of R. flavefaciens among the four groups (p>0.05). EW750 had the greatest number of F. succinogenes (p<0.05). However, EW decreased the population of B. fibrisolvens compared with NW (p<0.05).
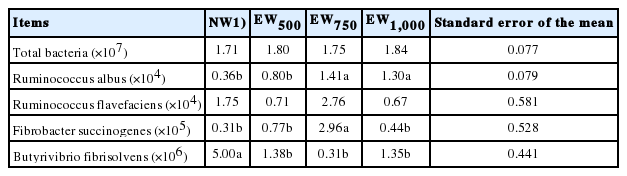
Effects of various weaning times on the microbial populations of the rumen of yellow cattle calves
DISSCUSSION
Weaning age and growth performance
Compared with beef cattle, the calves used in the experiment were Southern Chinese Cattle, which have a smaller birth weight and lower mature BW [14]. Thus, these differences may lead to different results when EW is applied.
Guo [15] reported that yellow cattle calves are always weaned using the conventional method at the age of 90 to 180 d. However, calves could be weaned at 35 d with a concentrate intake ranging from 366 to 500 g/d [16]. In this study, the calves in EW500 were weaned earlier, at 48 d of age versus at 63 d of EW1,000. When weaning age was used as a criterion for weaning, 32.9% of producers weaned calves at 56 d of age; however, 2.3% weaned calves as early as 21 d, and 14.2% delayed weaning for more than 12 wk [16]. However, the normal weaning age for the beef industry was much later, with ages from 200 to 300 d [17]. The difference in weaning age may be due to the different breeds and the method of milk withdrawal used by different studies.
The ADG of the whole experimental period in the EW groups was higher than for NW, which was consistent with the results of Hulbert [18]. EW increased the BW of the calves, possibly due to the higher intake of concentrate. As reported by Roth [19], the concentrate consumption by the concentrate-dependent weaning group was 11.7% higher than that of the conventional weaning group, and consequently the weight gain was 11.1% higher for the concentrate-dependent weaning group.
Effects on rumen fermentation
Rumen pH is crucial for normal rumen development, rumen fermentation, and overall calf health [20]. Although the ruminal pH values of the calves were all within the normal range (>6.3), the EW calves had a lower pH, suggesting greater ruminal activity. Anderson [21] found similar results where the ruminal pH was lower in the EW calves than in the conventionally weaned calves. The decrease in pH by EW may be due to the increase in rumen VFAs, which acidified the rumen content.
VFAs also represent the rumen fermentation pattern and the efficiency of nutrient digestion; the higher total VFA in the EW calves suggests increased metabolic activity [22]. In the present study, the EW calves had a higher total VFA concentration than the NW calves. This might have been associated with the greater solid feed consumption, the earlier establishment of ruminal microbes, and better fermentation of the feeds [20]. Satter and Esdale [23] suggested that a low pH may increase the production of butyrate from lactate fermentation. The consistently lower ruminal pH of the EW calves may have contributed to the higher proportion of butyrate. On the other hand, VFAs could stimulate the development of ruminal papillae in young calves [24], and butyrate is the VFA most responsible for the stimulation of rumen epithelial development [25]. Sakata [26] proposed that the stimulatory effect of the administration of VFAs into the rumen upon the mitotic index of rumen epithelial cells might be due to an increase in plasma insulin concentration. Lane and Jesse [6] found that the infusion of VFAs resulted in an increase in blood insulin concentration. The concentration of insulin in the blood of pre-weaned calves are similar to the values observed for monogastric animals but lower as calves achieve a significant intake of solid feed and ruminal fermentation is established [27]. Future experiments need to be conducted to measure the blood insulin concentration because at present no such data exist.
The EW calves had a lower ammonia N concentration than those weaned conventionally in this study. This is in line with Godfery [28], whose results showed that milk intake tends to increase rumen NH3 and that weaned calves have a lower ruminal NH3 than unweaned calves. The reduced ammonia concentrations in EW calves may indicate an improved utilization by the rumen microorganisms related to the solid feed intake [29] or increased absorption across a more mature rumen wall [30].
Effects on the ruminal enzyme activity
Quantification of the activity of various enzyme systems in whole rumen contents is a way to evaluate the capability of the ruminal microflora to degrade dietary substrates [31]. Ruminal enzymes are primarily produced by ruminal microbes, and the increased activity of enzymes (CMCase, MRCase, xylanase, and amylase) were mainly attributed to the growth of microbes, thus resulting in an increase in ruminal metabolism. In this study, the EW calves had higher ruminal enzyme activity, which demonstrates that the EW program could increase the ruminal activity of calves.
Effects on the ruminal microbial communities
At birth, there is no anaerobic microbial population in the rumen of young ruminants. The establishment of a complex microbial ecosystem is a long process that depends on many factors, including genetic background, age, management, and feeding conditions [20]. Suárez [32] reported that solid feed intake stimulates microbial proliferation and VFA production in the rumen of pre-weaned dairy calves, which reflect the capacity of ruminal microbiota to degrade feedstuffs. The intake of hay and concentrate progressively increases, providing substrates to the ruminal microbiota. However, the total bacteria in this study were not found to be different among the groups. As reported by Anderson [21], the total anaerobic bacteria counts increased during the first three weeks but remained fairly constant afterwards.
As the EW calves consumed increasing amounts of the starter diet and the ruminal pH decreased, the cellulolytic counts rapidly increased. However, in the study of Anderson, no difference was found in the cellulolytic bacterial counts in the EW group and a conventionally weaned group [21]. Although the total cellulolytic bacteria counts did not change, the composition may have been different, as in the present study, where the R. albus and F. succinogenes populations were increased but B. fibrisolvens was decreased by EW. The characterization of the ruminal microbial community provides opportunities to improve animal food digestion efficiency and develop efficient fermentation systems to convert plant biomasses into biofuels [5]. In this study, only some known cellulolytic bacteria were quantified; perhaps 16S rDNA gene amplicon pyrosequencing could be applied to explore the structure of the bacterial community affected by different weaning times in future studies.
IMPLICATION
The results of the present experiment showed that EW has advantages in terms of BW and ADG and many benefits for the rumen development of beef calves, such as increasing the concentrations of total volatile fatty acids, decreasing the ammonia N concentration, improving ruminal enzyme activity and altering the composition of the rumen cellulolytic bacteria. From these findings, it was also inferred that early weaning at 750 g solid feed intake may be much better than the other two treatments.
ACKNOWLEDGMENTS
This work was carried out with the support of Public Technology Application Research of Zhejiang Province (2015C32031), Zhejiang Provincial Natural Science Foundation (LQ14C170004), and Special Fund for Agro-scientific Research in the Public Interest (201303143). We also thank Elsevier for its linguistic assistance during the preparation of this manuscript.
Notes
CONFLICT OF INTEREST
We certify that there is no conflict of interest with any financial organization regarding the material discussed in the manuscript.