Variance components estimation for farrowing traits of three purebred pigs in Korea
Article information
Abstract
Objective
This study was conducted to estimate breed-specific variance components for total number born (TNB), number born alive (NBA) and mortality rate from birth through weaning including stillbirths (MORT) of three main swine breeds in Korea. In addition, the importance of including maternal genetic and service sire effects in estimation models was evaluated.
Methods
Records of farrowing traits from 6,412 Duroc, 18,020 Landrace, and 54,254 Yorkshire sows collected from January 2001 to September 2016 from different farms in Korea were used in the analysis. Animal models and the restricted maximum likelihood method were used to estimate variances in animal genetic, permanent environmental, maternal genetic, service sire and residuals.
Results
The heritability estimates ranged from 0.072 to 0.102, 0.090 to 0.099, and 0.109 to 0.121 for TNB; 0.087 to 0.110, 0.088 to 0.100, and 0.099 to 0.107 for NBA; and 0.027 to 0.031, 0.050 to 0.053, and 0.073 to 0.081 for MORT in the Duroc, Landrace and Yorkshire breeds, respectively. The proportion of the total variation due to permanent environmental effects, maternal genetic effects, and service sire effects ranged from 0.042 to 0.088, 0.001 to 0.031, and 0.001 to 0.021, respectively. Spearman rank correlations among models ranged from 0.98 to 0.99, demonstrating that the maternal genetic and service sire effects have small effects on the precision of the breeding value.
Conclusion
Models that include additive genetic and permanent environmental effects are suitable for farrowing traits in Duroc, Landrace, and Yorkshire populations in Korea. This breed-specific variance components estimates for litter traits can be utilized for pig improvement programs in Korea.
INTRODUCTION
One of the most important goals in pig breeding is to wean large, heavy litters [1]. To increase the number of weaned piglets per sow per year, great emphasis is placed on selection for the number born alive (NBA). A successful genetic improvement program requires accurate genetic parameter estimates [2]. Advances in computing capacity and the development of animal mixed models using restricted maximum likelihood procedures [3] have resulted in numerous studies regarding genetic parameters. Use of appropriate models in estimating the genetic merit of individual animals is the most reliable way of making use of performance information in selection. Such information is important to designing appropriate management and breeding strategies aimed at improving productivity.
Several studies have shown that the heritability estimates for farrowing traits such as litter size at farrowing and NBA are low [2,4,5]. Even though heritability estimates are low, genetic variances for litter traits were sufficiently large to indicate that the litter traits could be improved through selection [2]. Estimates should be breed-specific because there are differences in estimates of variance components among breeds [2]. Some studies have also revealed the implication of adding maternal or service sire effects in the estimation model [6–8]. Therefore, this study was conducted to estimate the genetic parameters for total number born (TNB), NBA, and mortality (MORT) in Duroc, Landrace, and Yorkshire populations in Korea. Moreover, the implications of including maternal genetic and service sire effects in estimation models were evaluated.
MATERIALS AND METHODS
Data
Reproductive data for this study were obtained from Duroc, Landrace and Yorkshire litters born from January 2001 to September 2016 on different farms in Korea. All records for each sow included the following information: pedigree, registration number, herd, breed, date of birth of sow, insemination date, farrowing date, parity number, TNB, NBA, and MORT. The TNB and NBA were recorded immediately after all piglets were born. The NBA was defined as TNB minus the number died at farrowing. The MORT comprises mortality from birth through weaning, including stillbirths. The data were composed of 6,412 Duroc, 18,020 Landrace, and 54,254 Yorkshire sow records. These sow records were from 418 sires and 2,107 sows in Duroc, 693 sires, and 3,585 sows in Landrace, and 1,252 sires and 8,706 sows in Yorkshire. The structure of the data set is shown in Table 1.

Number of herds, records, animals, sires, dams and contemporary groups (CG) by breed
Analysis
Initial computations were performed using ordinary least squares to evaluate non-genetic factors; specifically, fixed effects to be included in the model for their significant effects (p<0.05). The following fixed effects were tested for each trait: herd in which the animal was born, parity of the dam (1, 2, 3, 4, 5 and ≥6), herd-year-season, herd-year-month, and herd-year-week. The analysis of the significance of the fixed effects and their interactions were performed using SAS general linear model procedure (SAS Inst., Inc., Cary, NC, USA). Significant effects of parity and herd-year-week were found for all traits. Variance components were estimated through the restricted maximum likelihood method using the WOMBAT software [9]. In the analyses, three models with different combinations of random effects were fitted to estimate genetic parameters:
Model 1: y = Xb+Za+W2pe+e
Model 2: y = Xb+Za+Pm+W2pe+e
Model 3: y = Xb+Za+W1s+W2pe+e
Where, y is the vector of observation of a trait in Duroc, Landrace, or Yorkshire, b is the vector of fixed effects including contemporary group (herd-year-week) and parity; a is the vector of additive genetic effects of animals, which is assumed to be distributed
RESULTS AND DISCUSSION
The descriptive statistics for considered traits in this study by breed are shown in Table 2. The average TNB and NBA with their corresponding standard deviation in the Duroc population were 9.67±2.67 and 8.57±2.49, respectively, while MORT was 0.80± 1.13. The sows in the Landrace breed population produce more piglets than Duroc, with an average TNB and NBA of 11.76±3.25 and 10.59±3.08, respectively. Moreover, the Landrace population has an average MORT of 0.82±1.29. The Yorkshire population had the highest TNB (12.63±3.48), NBA (11.41±3.26), and MORT (0.86±1.27) among breeds in this study.

Descriptive statistics for studied traits by breed
Variance components and heritabilities
Variance components and heritabilities are shown in Table 3, 5. The animal genetic and residual variances for TNB and NBA were highest in Yorkshire, while the highest MORT was observed in Landrace. Differences in the estimated variance of maternal and service sire effects were found among breeds. The percentage variance of maternal genetic effects was higher than that of service sire effects in Duroc, while service sire effects were higher than maternal effects in Yorkshire for both TNB and NBA. In Landrace, the service sire variance was higher than the maternal variance in NBA, while the reverse was true for TNB. The differences in estimates of variance components among breeds may be due to variation among population sizes and genetic origins.
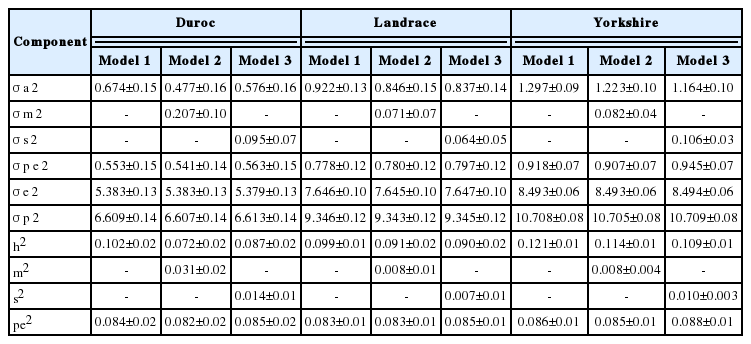
Estimates of (co)variance components and genetic parameters for total born

Estimates of (co)variance components and genetic parameters for mortality
As shown in Table 3, the range of heritability for TNB was be tween 0.072 and 0.121 from all models in all breeds. Differences in heritability estimates for TNB were observed among models in all breeds. Model 1 shows the highest heritability estimates for all breeds. In comparison among breeds for the heritability for TNB, Yorkshire had the highest estimate, ranging from 0.109 to 0.121. The heritability estimates for TNB of Duroc ranged from 0.072 to 0.102, while it ranged from 0.090 to 0.099 for Landrace. The estimates in this study are similar to those reported by Guo et al [10], with an estimate of 0.11 and 0.09 in Landrace and Yorkshire breeds, respectively. Moreover, Putz et al [11] reported estimates of 0.10 for both Landrace and Large White breeds, which is in agreement with the results of this study.
Estimates of heritability for NBA in all breeds are close to 0.1. The estimated heritability for NBA ranged from 0.087 to 0.110, 0.088 to 0.100, and 0.099 to 0.107 for the Duroc, Landrace and Yorkshire breeds, respectively (Table 4). These results are in agreement with estimates reported by Chen et al [2] of 0.09, 0.08, and 0.10 for the same breeds, respectively. Moreover, these estimates are consistent with those reported by Putz et al [11] for Landrace and Large White sows. Akanno et al [4] reported a 95% confidence intervals heritability estimate of 0.06 to 0.10 in their meta-analysis study of pigs in the tropics based on 29 studies of NBA. The results of the present study were also consistent with the heritability of 0.10 published by the NSIF [12].
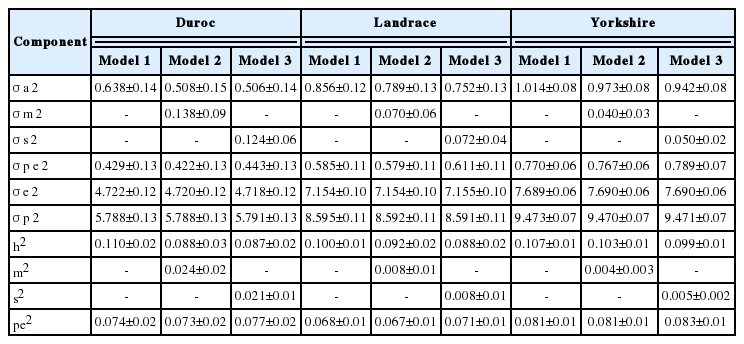
Estimates of (co)variance components and genetic parameters for number born alive
Estimated variance components for MORT are shown in Table 5. Heritability estimates for MORT ranged from 0.027 to 0.031, 0.050 to 0.053, and 0.073 to 0.081 for the Duroc, Landrace and Yorkshire breeds, respectively. In this study, MORT is defined as mortality from birth through weaning, including stillbirths. Hermesch et al [13] reported a heritability estimate of 0.05 for the mortality rate of each litter within 30 days of birth, including stillbirths. Moreover, Putz et al [11] reported an estimate of 0.07 and 0.13 for mortality at day 30 in Landrace and Large White breeds, respectively. However the results of this study were lower than the estimated heritabilities of 0.09 for mortality rate before day 5 for both Landrace and Yorkshire breeds reported by Guo et al [10]. Furthermore, Akanno et al [4] reported a 0.20 weighted mean heritability for pre-weaning mortality. In the present study, heritability was slightly higher or lower, which may have been caused by differences in the population structure and measurement of traits.
Additive maternal effects
Additive maternal effects explained a different percentage of variability for TNB and NBA among breeds. Specifically, maternal accounted for a small portion of the variance in Landrace and Yorkshire breeds, whereas it explained a slightly higher percentage in Duroc. Additive maternal effects explained 0.4% to 0.8% of the total variability for TNB and NBA in Landrace and Yorkshire breeds. The percentage of variance due to maternal effects of Duroc for TNB and NBA was 3.1% and 2.4%, respectively. In MORT, maternal effects were not large sources of variation across breeds. Chen et al [2] estimated variation due to maternal effects for NBA of 1.0% for both Duroc and Yorkshire, while 2% was estimated for Landrace. The estimates in this study were considerably lower than those reported by Irgang et al [14] and Rydhmer et al [15].
Spearman rank correlations indicated that maternal genetic effects were not significant for any farrowing traits or breeds considered in this study. However, a small reduction in heritability in all breeds was observed when maternal genetic effects were added to the model. The correlations between model 1 and model 2 for all traits ranged from 0.98 to 0.99 across breeds, which agrees with the results of other studies, indicating maternal genetic effects did not add significant information [2,6,16].
Service sire effects
Service sire effects explained a very small part of total variability in this analysis. The percentage of the variance explained by service sire effects ranged from 0.5% to 2.1% for TNB and NBA in all breeds. For MORT, service sire effects were not large sources of variation (0.1% to 0.7%). The results in this study for TNB and NBA are in agreement with the estimates reported by Lewis et al [17] and Kim et al [7]. The proportion of service sire effect on the total variability reported by Guo et al [10] for MORT are in the range of the results found in this study; however, they found higher effects of TNB and NBA than were observed in the present study. Moreover, Chen et al [2] estimated a higher variation due to service sire effects relative to the values of 3.0% to 4.0% reported in the present study for NBA in Duroc, Landrace, and Yorkshire breeds. Wolf and Wolfova [8] also reported that 2.0% to 3.0% of the variance was due to service sire effects in Czech Large White, while they were responsible for 2.0% of the variance in Czech Landrace for TNB and NBA.
Spearman rank correlations revealed that the service sire effects had only a minor impact on any farrowing traits and breed considered in this study. The correlations between model 1 and model 3 for all traits ranged from 0.98 to 0.99 across breeds. These results suggest that the addition of service sire effects in models for breeding value estimation will only have small effects on the precision of the breeding value. However, small reductions in heritability in all breeds were observed when service sire effects were added to the model. Models with or without service sire effects are recommended for genetic evaluation of litter traits [8].
Permanent environmental effects
The proportion of the total variation due to permanent environmental effects ranged from 0.082 to 0.088, 0.067 to 0.083, and 0.042 to 0.065 for TNB, NBA and MORT, respectively, across breeds and models as shown in Table 3 to 5. These results are consistent with the results reported by Putz et al [11]. Hanenberg et al [18] reported that the estimated variation due to permanent environmental effects was 0.090 to 0.085 for TNB and NBA. The results for NBA observed in the present study are also in agreement with the estimates of 0.07 to 0.08 reported by Chen et al [2] and the estimate of 0.06 reported by Kaufmann et al [19]. However, the results for NBA were lower than the estimates reported by Haley and Lee [20] and Ferraz and Johnson [21].
CONCLUSION
In general, heritability estimates for farrowing traits were low across breeds. However, sufficiently large genetic variances were also observed in this study. According to Chen et al [2], these findings could imply that those traits could be improved through optimum selection. Moreover, the results of this study showed that maternal genetic and service sire effects were not large sources of variation and had small effects on the precision of the breeding value. Model 1, which included additive genetic and permanent environmental effects, is the appropriate model for use in genetic improvement programs in Korea, which may potentially increase the accuracy of breeding value estimates and will probably result in increased genetic progress.
ACKNOWLEDGMENTS
This research was supported by the Golden Seed Project, Ministry of Agriculture, Food and Rural Affairs (MAFRA), Ministry of Oceans and Fisheries (MOF), Rural Development Administration (RDA) and Korea Forest Service (KFS).
Notes
CONFLICT OF INTEREST
We certify that there is no conflict of interest with any financial organization regarding the material discussed in the manuscript.