The potential interaction between ewe body condition score and nutrition during very late pregnancy and lactation on the performance of twin-bearing ewes and their lambs
Article information
Abstract
Objective
The present study aimed to determine the impact of ewe body condition score (BCS) (over a range of 2.0 to 3.0) and nutritional treatments (consisting of differing herbage masses) during very late pregnancy and lactation and their potential interaction on the performance of twin-bearing ewes and their lambs to weaning.
Methods
On day 142 of pregnancy, twin-bearing ewes with a BCS of 2.0, 2.5, or 3.0 were allocated to a “Moderate’ or ‘Unrestricted’ nutritional treatment until day 95 of lactation (weaning). The nutritional treatments aimed to achieve average herbage masses of 1,200 to 1,300 kg dry matter (DM)/ha (Moderate) and 1,500 to 1,800 kg DM/ha (Unrestricted).
Results
There were no three-way interactions between ewe BCS group, nutritional treatment and time for any ewe or lamb parameter. The nutritional treatments had no effect (p>0.05) on lamb birth or weaning weight. Lambs born to Moderate ewes had greater survival and total litter weight at weaning (p<0.05). Regardless of BCS group, Unrestricted treatment ewes had greater body condition and back-fat depth at weaning than Moderate treatment ewes (p<0.05). Ewes of BCS 2.0 group reared lighter lambs to weaning (p<0.05) and tended to have a lower total litter weight (p = 0.06) than BCS 3.0 group ewes.
Conclusion
This study suggests farmers should aim to have all ewes with a BCS of 2.5 or 3 in late pregnancy for optimal lamb weaning performance. Furthermore, there is no benefit to lamb production of offering ewes pasture masses >1,200 kg DM/ha during very late pregnancy and lactation.
INTRODUCTION
New Zealand pastoral systems are predominantly based on perennial ryegrass (Lolium perenne) and white clover (Trifolium repens) swards with pasture growth rates typically lowest during winter [1], coinciding with the late pregnancy period of sheep. Recent work on feeding ewes perennial ryegrass and white clover swards during mid- to late-pregnancy has shown ewes can be managed with pre- and post grazing pasture masses of ~1,200 and 800 kg dry matter (DM)/ha, respectively, with no or little impact on lamb or ewe performance [2–4]. However, a limitation of these studies was that feeding levels during the lactation period were ad libitum. Sub-optimal nutrition can have negative effects on daily milk yield and length of the lactation period [5,6], and thus lamb live weight at weaning [7,8]. Traditionally farmers place ewes in lambing paddocks within one to two weeks of the start of the lambing period. Corner-Thomas et al [9] found lambs born to ewes offered pasture masses of 1,500 to 1,700 kg DM/ha from day 141 of pregnancy and throughout lactation were heavier at weaning than those born to ewes offered pasture masses of 1,200 to 1,400 kg DM/ha. This suggests an advantage of greater pasture masses in lactation, however, this conflicts with Morris and Kenyon [10] who reported no difference in ewe feed intake and lamb weaning weight with pasture masses of 1,200 and 2,000 kg DM/ha. This conflict suggests further research is required to determine if there is any benefit from offering pasture masses above 1,200 kg DM/ha in late pregnancy and lactation.
Ewe body condition score (BCS) in late pregnancy and lac tation can affect lamb birth weight, live weight gain, and weaning weight (see review Kenyon et al [11]). However, these effects can be inconsistent. Ewes in poorer condition at lambing will have less body fat to mobolise [12], and may therefore display a greater response to higher nutrition during lactation than ewes of high BCS. Litherland et al [13] reported that with ewes of moderate body condition (BCS 2.5) feeding level in lactation can be more important than feeding level in late-pregnancy, in terms of lamb weaning weight. Consequently, offering different feeding regimes to ewes of varying body conditions at lambing may enable targeted use of available pasture for maximum ewe and lamb production.
Therefore the aims of the present study were to determine the impact of ewe BCS group (over a range of 2.0 to 3.0) and nutritional treatments during very late pregnancy and lactation and their potential interaction on the performance of twin-bearing ewes and their lambs to weaning.
MATERIALS AND METHODS
Study design and animals
The study was conducted at Massey University’s Keeble Farm, 5 km south of Palmerston North (40°S, 175°E) during the period July to December 2014 with approval from the Massey University Ethics Committee. This study is part of a series of studies aimed at determining optimum perennial ryegrass and white clover feeding levels throughout pregnancy and lactation. Therefore, it followed a similar experimental design to that used in the series, building on previous findings [3,4,9,14]. The study included 177 twin-bearing Romney mixed-age ewes (3 to 5 years of age). The ewes had been bred during a 17-day breeding period which began on 21 March 2014 and were selected at pregnancy diagnosis on 27 June 2014 (82 days after the start of breeding; P82). The selected ewes weighed an average of 66.6±0.4 kg and had a BCS of either 2.0 (n = 69), 2.5 (n = 73), or 3.0 (n = 64) on a scale of 1 to 5 [11,15]. Following breeding all ewes had been managed together under commercial conditions, with post-grazing herbage masses below 1,000 kg DM/ha. At P103 all ewes were randomly allocated within each BCS groups to either a Moderate or Unrestricted nutritional treatment to begin at P142. At this time all ewes were given an anthelmintic (Bionic Capsule, Merial/Ancare NZ Ltd, Manukau City, New Zealand), which released albendazole and abamectin over 100 days. This resulted in the following treatment groups: BCS 2.0 (Moderate n = 33, Unrestricted n = 35), BCS 2.5 (Moderate n = 33, Unrestricted n = 34), BCS 3.0 (Moderate n = 35, Unrestricted n = 36). However, all ewes remained as one group with target pre- and post-grazing herbage masses of 1,000 to 1,100 and 600 to 700 kg DM/ha respectively until P142. It has previously been established that these grazing conditions allow total ewe live weight to increase with expected conceptus mass [10,16].
At P142, ewes were placed in their nutritional treatments (which included ewes of the three BCS groups), where they remained in the same paddock until 15 days after the mid-point of lambing (L15). The aim of the Moderate nutritional treatment was to achieve average herbage masses within the range of 1,200 to 1,300 kg DM/ha, while the Unrestricted nutritional treatment aimed to achieve average herbage masses within the range of 1,500 to 1,800 kg DM/ha. In this grazing experiment the nutritional treatments were differentiated through a difference in available herbage mass and therefore it is very difficult to calculate a realistic estimate of individual ME or crude protein (CP) intake. However, previous research has found that ewes grazing perennial ryegrass white clover herbage masses below 1,200 kg DM/ha in mid to late pregnancy and in lactation results in restricted intake [10,17,18]. Therefore it is unlikely that either nutritional treatment would have resulted in restricted intakes of either metabolisable energy (ME) or CP. From L15 until the end of the study (L95), ewes and lambs were rotationally grazed within their nutritional treatments, continuing to ensure the average target herbage masses were met. Throughout the entire study period the ewes and their lambs grazed an established perennial ryegrass and white clover sward mix. The total area utilised in this study was 20 ha.
Animal measurements
Ewe liveweights were recorded within 1 hour of removal from pasture at (P82, P103, P142, L45, and L95). Ewe BCS was recorded at (P82, P103, P142, L45, and L95) by one experienced operator. Ewe back-fat depth (depth of fat over the 12th rib, 50 mm from the mid-line) was measured at (P142 and L95) using ultrasound.
Within 12 h of birth all lambs, regardless of whether alive or dead, were identified to their dam, sexed, birth-rank recorded, weighed and tagged. Liveweights of lambs were also recorded at L45 and L95. The presence, or absence, of a lamb at L95 was used as an indicator of lamb survival to L95. Lamb back-fat depth (depth of fat over the 12th rib, 50 mm for the mid-line) was measured at L95 using ultrasound from a random cohort of 169 lambs [2.0BCS (Moderate n = 28, Unrestricted n = 23), 2.5BCS (Moderate n = 30, Unrestricted n = 27), 3.0BCS (Moderate n = 29, Unrestricted n = 32)].
Herbage measurements
Pre- and post-grazing herbage masses were recorded each time the ewes were moved between paddocks during P103–P142 and again between L15–L95. Herbage mass was recorded at the start and end of the continuous grazing period (P142 and L15). Herbage mass was measured using a rising plate meter (Ashgrove Pastoral Productions, New Zealand, 50 readings per paddock) with a standard calibration (herbage mass = [158×average meter reading]+200; [19]).
Grab herbage samples [20] were taken pre-grazing at (L1, L16, L36, L59) from each nutritional treatment. The individual samples were frozen at −20°C using near infrared reflectance (NIR) to determine the CP percentage and ME content. A Bruker MPA NIR spectrophotometer was used to scan the samples and the resulting NIR spectra were analysed using the Optic user software (OPUS) version 5.0 (Ettlingen, Germany).
Statistical analysis
The analysis included 177 twin-bearing ewes with complete sets of alive lambs at tagging [2.0BCS (Moderate n = 26, Unrestricted n = 31), 2.5BCS (Moderate n = 29, Unrestricted n = 30), 3.0BCS (Moderate n = 32, Unrestricted n = 29)] out of the original 206 ewes. The non-inclusion of data from 29 ewes was due to the death of one or more lambs before tagging, ewe death or removal due to ill-health during the study period or incomplete data [2.0BCS (Moderate n = 7, Unrestricted n = 4), 2.5BCS (Moderate n = 4, Unrestricted n = 4), 3.0BCS (Moderate n = 3, Unrestricted n = 7)].
All statistical analyses were performed using SAS (Statistical Analysis System, version 9.2; SAS Institute Inc., Cary, NC, USA). The study was designed to investigate the potential interaction between ewe BCS and nutritional treatment on ewe and lamb parameters. Therefore, the interaction of ewe BCS and nutritional treatment was included in all models regardless of significance level.
Ewe live weight, BCS and ewe back-fat depth were analysed using the MIXED procedure allowing for repeated measures with a model including the fixed effects of measurement time, ewe BCS group, nutritional treatment and all two-way and three-way interactions between measurement time, ewe BCS group and nutritional treatment. The models included date of lambing as a covariate. There were no three-way interactions between measurement time, ewe BCS group and nutritional treatment for any of the ewe or lamb measurements, and therefore the data is not shown. However this interaction was retained in the statistical model because the study was designed to test this effect.
Lamb live weight and back-fat depth were analysed using the MIXED procedure with a model including the fixed effects of sex of the lamb, ewe BCS group, nutritional treatment and the interaction between ewe BCS group and nutritional treatment. Ewe was fitted as a random effect and date of birth as a covariate. Repeated measures analysis was not undertaken for lamb live weight as not all lambs were alive at all measurement times.
For each ewe, total litter weight (the combined live weight of all lambs alive at L95 plus a nominal value of 0 kg for lambs that had died) was calculated. The total litter weight was analysed using the MIXED procedure with a model including the fixed effects of ewe BCS group, nutritional treatment and their interaction and with date of lambing as a covariate.
Lamb survival to L95 was analysed as a binomial trait (alive vs dead) and a logit transformation using the GENMOD procedure. The model included the fixed effects of sex of the lamb, ewe BCS group, nutritional treatment and the interaction between ewe BCS group and nutritional treatment and with date of birth as a covariate.
Pasture masses, ME content and CP % were analysed using the MIXED procedure with a model including the fixed effect of nutritional treatment.
RESULTS
Herbage mass and quality
During P103 to P142, the pre- and post-grazing herbage masses were 1,169±17 and 684±17 kg DM/ha, respectively. During P142 to L15 pasture masses were greater for the Unrestricted treatment than the Moderate treatment (1,701±60 vs 1,168±68 kg DM/ha; p<0.05). During L15 to L95, the pre- and post-grazing herbage masses were greater for the Unrestricted treatment than the Moderate treatment (pre-grazing 1,959±58 vs 1,397±26; p<0.05 and post-grazing 1,544±23 vs 1,176±23 kg DM/ha; p<0.05). During L1–L59 the pre-grazing ME values of Moderate and Unrestricted treatments did not differ (9.7±0.2 vs 10.1±0.2 MJ/kg DM; p>0.05). Similarly, during L1–L59 the pre-grazing CP values of Moderate and Unrestricted treatments did not differ (16.3±1.3 vs 17.9±1.3 MJ/kg DM; p>0.05).
Ewe live weight
There was a two-way interaction between BCS group and time for ewe live weight (p<0.05; Table 1). At P103, ewes in the BCS 2.0 group were lighter (p<0.05) than BCS 2.5 group ewes which in turn tended (p = 0.06) to be lighter than BCS 3.0 group ewes (Table 1). Similarly, at P142 ewes in the BCS 2.0 group tended (p = 0.07) to be lighter than BCS 2.5 group ewes which were in turn lighter (p<0.05) than BCS 3.0 group ewes. Between P103 and P142, BCS 2.0 group ewes gained proportionally more live weight (p>0.05) than the other BCS groups, such that at P142 ewes in the BCS 2.0 group did not differ from BCS 2.5 group ewes (p>0.05) and were lighter than BCS 3.0 group ewes (p<0.05). This pattern remained at L45. Between L45 and L95, BCS 2.0, and 2.5 group ewes gained live weight (p>0.05), while the live weight of BCS 3.0 group ewes remained stable (p>0.05). Thus at L95 there was no difference in ewe live weight between the BCS groups (p>0.05). There was no two-way interaction between nutritional treatment and time (p>0.05).

Effect of ewe body condition score group (2.0 vs 2.5 vs 3.0) and nutritional treatment in very late pregnancy and lactation (Moderate vs Unrestricted) on ewe live weight (kg; mean±SEM) at P103, P142, L45, and L95
Ewe body condition score
There was a two-way interaction between BCS group and time for ewe BCS (p<0.05; Table 2). At P103, P142, and L45 the BCS of ewes differed between each of the three BCS groups (p<0.05). However, between L45 and L95, BCS 2.0 group ewes gained proportionally more body condition (p>0.05) than the other BCS groups, such that, at L95 ewes in the BCS 2.0 and 2.5 groups did not differ in BCS from one another (p>0.05) and had a lower BCS than ewes in the BCS 3.0 group (p<0.05).

Effect of ewe body condition score group (2.0 vs 2.5 vs 3.0) and nutritional treatment in very late pregnancy and lactation (Moderate vs Unrestricted) on ewe body condition score (mean±SEM) at P103, P142, L45, and L95
There was also a two-way interaction between nutritional treat ment and time (p<0.05; Table 2). Between P103 and L45, the BCS of both the Moderate and Unrestricted ewes remained similar and stable. However, between L45 and L95 the Unrestricted ewes gained body condition (p>0.05), while the Moderate ewes body condition remained stable (p>0.05). Thus at L95 Unrestricted ewes had a greater BCS than Moderate ewes (p<0.05).
Ewe back-fat depth
There was a two-way interaction between BCS group and time such that at P142 ewes in the BCS 2.0 group had lower back-fat depths than BCS 2.5 group ewes, which were in turn lower than BCS 3.0 group ewes (p<0.05; Table 3). Over time the BCS 2.0 group ewes gained back-fat (p<0.05), while BCS 2.5 and 3.0 group ewes remained stable (p>0.05). Consequently, at L95, ewes in the BCS 2.0 group had lower back-fat depths than BCS 3.0 group ewes (p<0.05), but ewes in the BCS 2.5 group did not differ from either BCS group (p>0.05). There was a two-way interaction between nutritional treatment and time such that there was no difference in back-fat depth between Moderate and Unrestricted ewes at P142 (p>0.05). However, between P142 and L95 Unrestricted ewes gained back-fat (p<0.05), while the back-fat depth of Moderate ewes remained stable (p>0.05). Consequently, at L95 Unrestricted ewes had a greater back-fat depth than Moderate ewes (p<0.05).
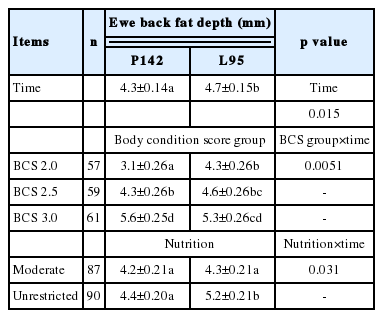
Effect of ewe body condition score group (2.0 vs 2.5 vs 3.0) and nutritional treatment in very late pregnancy and lactation (Moderate vs Unrestricted) on ewe back-fat depth (mm; mean±SEM) at P142 and L95
Lamb liveweight and survival
There was no effect of either ewe BCS group or nutritional treatment on lamb birth weight (p>0.05; Table 4).
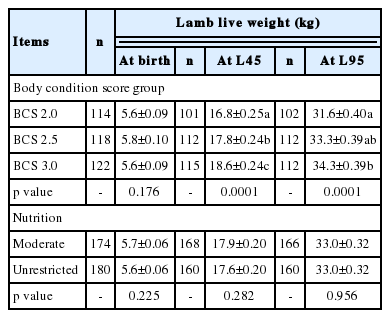
Effect of ewe body condition score group (2.0 vs 2.5 vs 3.0) and nutritional treatment in very late pregnancy and lactation (Moderate vs Unrestricted) on lamb live weight (kg; mean±SEM) at birth, L45 and L95
At L45, lambs born to ewes in the BCS 2.0 group were lighter than lambs born to BCS 2.5 ewes, which were in turn lighter than lambs born to BCS 3.0 group ewes (p<0.05). There was no effect of nutritional treatment on lamb live weight at L45 (p>0.05).
At L95, lambs born to ewes in the BCS 2.0 group were lighter than lambs born to ewes in the BCS 3.0 (p<0.05), but lambs born to ewes in the BCS 2.5 group did not differ from either BCS group (p>0.05). There was no effect of nutritional treatment on lamb live weight at L95 (p>0.05).
There was an effect of nutritional treatment on lamb survival such that lambs born to ewes in the Moderate treatment had a greater rate of survival than lambs born to ewes in the Unrestricted treatment (p<0.05; Table 5). There was no effect of ewe BCS group on lamb survival (p>0.05). There was no interaction between ewe BCS group and nutritional treatment for lamb survival (p>0.05).
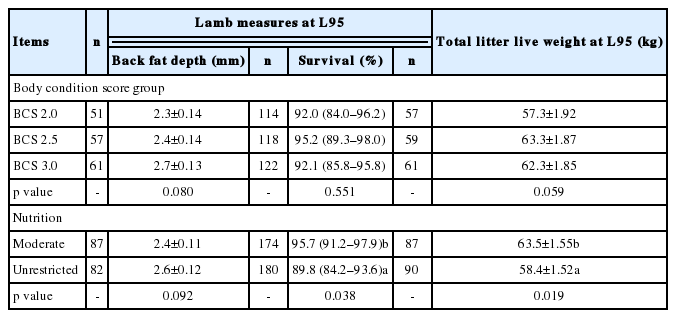
Effect of ewe body condition score group (2.0 vs 2.5 vs 3.0) and nutritional treatment in very late pregnancy and lactation (Moderate vs Unrestricted) on lamb back-fat depth at L95 (mm; mean±SEM), back-transformed logit mean (95% confidence interval) lamb survival to L95 and total lamb litter weight (kg; mean±SEM) per ewe at L95 (kg)
Lamb back-fat depth at L95
There tended to be an effect of ewe BCS group on lamb back-fat depth at L95 (p = 0.08), with pairwise analysis indicating that lambs born to ewes in the BCS 2.0 group had a lower back-fat depth at L95 than lambs born to BCS 3.0 ewes (p<0.05), but lambs born to BCS 2.5 ewes did not differ from either group (p>0.05; Table 5). There tended to be an effect of nutritional treatment on lamb back-fat depth at L95 (p = 0.09), with pairwise analysis indicating that lambs born to Unrestricted ewes had a greater back-fat depth at L95 than those born to Moderate ewes (p<0.05).
Total lamb litter live weight per ewe at L95
There was an effect of nutritional treatment on litter live weight per ewe such that Moderate ewes had a greater total lamb litter live weight per ewe at L95 than Unrestricted ewes (p<0.05; Table 5). There tended to be an effect of ewe BCS group on total lamb litter live weight per ewe at L95 (p = 0.06), with pairwise analysis indicating that ewes in the BCS 2.0 group had a lower total lamb litter live weight than BCS 2.5 group ewes and 3.0 ewes (p<0.05), which did not differ from one another (p>0.05).
DISCUSSION
The pre- and post-grazing herbage masses measured indicate that the target nutritional treatments were successfully implemented during late pregnancy and lactation, allowing for the testing of the effects of the nutritional treatment on the performance of the ewe and lambs to weaning. Furthermore, the differences in BCS groups at the start of the treatment period enabled the testing of the effect of BCS over the range of 2.0 to 3.0 and the potential interaction between nutritional treatment and BCS on ewe and lamb performance to weaning. No interactions between BCS and nutritional treatment were identified for any of the performance indicators and therefore only interactions with time are discussed.
The nutritional treatments had no effect on lamb birth weight. This matches similar studies which have found no or minimal impact of nutritional treatments during very late pregnancy [4,9, 14]. It is also acknowledged that the nutritional treatments likely had insufficient time for any effect to occur. Furthermore, in all of these pre-mentioned studies the so-called ‘restricted’ nutritional treatments were designed to provide sufficient maintenance energy for the ewe and her foetuses in late pregnancy. Conversely, many studies which imposed under nutrition during late pregnancy reported reduced lamb birth weights (see review Rooke et al [21]).
The nutritional treatments had no effect on lamb weaning weight. Morris and Kenyon [10] also reported offering ewes swards of 4 cm or 8 cm (equivalent to 1,200 and 2,000 kg DM/ha, respectively) during lactation had no effect on ewe feed intake or the resulting lamb weaning weight. In contrast, Corner-Thomas et al [9] found that lambs born to ewes offered pasture masses equivalent to the unrestricted treatment (1,500 to 1,700 kg DM/ha) were slightly heavier (1.9 kg) at weaning than those born to ewes offered pasture masses equivalent to the moderate treatment (1,200 to 1,400 kg DM/ha). Therefore, combined these data suggest over the range of 1,200 to 2,000 kg DM/ha there is little to no benefit of additional pasture mass on lamb weaning weight.
Lambs born to ewes in the Moderate treatment had a greater rate of survival than those born to ewes in the Unrestricted treatment. The cause for this greater rate of survival is unclear and unexpected. Previous studies have reported no effect of nutritional treatments during late pregnancy on lamb survival [4,9, 10,14,22]. In the present study, total litter weight at weaning was greater in the Moderate treatment (~5 kg) than the Unrestricted treatment, which was driven by the greater lamb survival. In contrast to the present findings, Corner-Thomas et al [9] found no difference in lamb survival or total litter weight at weaning of ewes offered pasture masses of 1,500 to 1,700 vs 1,200 to 1,400 kg DM/ha during late pregnancy and lactation. These somewhat conflicting results suggest there may be little advantage to the lambs of offering twin-rearing ewes, pasture masses greater than 1,200 kg DM/ha during very late pregnancy and throughout the lactation period, if the aim is to maximise total litter weight at weaning. However, more research maybe required to confirm these findings.
Ewes in the Unrestricted nutritional treatment had a greater BCS and back-fat depth at weaning than those in the Moderate nutritional treatment. This was also found by Corner-Thomas et al [9] and suggests that greater pasture masses over the range 1,200 to 2,000 kg DM/ha provide greater resources to gain body condition. Heavier, better BCS ewes at weaning maybe more likely to be in that position at the start of the following breeding period, resulting in greater breeding performance [11]. This is especially noteworthy if summer dry conditions limit pasture production and quality and hence the potential of the ewes to gain condition between weaning and the start of the breeding period. Conversely, Morris and Kenyon [10] observed no difference in feed intake, live weight or body condition of ewes offered swards in the range of 1,200 to 2,000 kg DM/ha during late pregnancy and lactation.
Ewe BCS had no effect on lamb birth weight. This supports other studies in which ewe BCS was measured in either mid or late pregnancy [11,14,22,23]. However, others have observed a positive relationship between ewe BCS and lamb birth weight [3,9,24,25]. Although, Kenyon et al [11] suggested the impact of ewe BCS on fetal growth and lamb birth weight is greatest in situations where ewe nutrition is limited. In the present study ewe nutrition during pregnancy was at a level to meet ewe and fetus requirements, therefore, a lack of effect of ewe BCS on lamb birth weight is not unexpected.
At weaning those lambs born to ewes in the BCS 2.0 group were lighter and tended to have lower back-fat depth than those born to ewes in the BCS 3.0 group. Ewe BCS and fat levels are positively related to milk production [7,13,23]. Further, a positive relationship between ewe BCS and lamb growth has been reported [11,24–27]. Specifically, previous studies under similar conditions have shown that ewes with a BCS of 2.0 wean lighter lambs than those with a BCS of 2.5 or 3.0 [2–4], as found in the present study. Combined these results indicate that even with ad libitum feed levels of pasture during very late pregnancy and lactation farmers should ensure all ewes have a BCS of 2.5 or above in late lactation to maximise lamb growth.
Ewe BCS had no effect on lamb survival to weaning. Previous research shows there is conflicting evidence on the effect of ewe BCS on lamb survival with either no effect [14,28], or a positive effect of ewe BCS reported on lamb survival [22,29]. In the present study, ewes in the BCS 2.0 group tended to have lower total litter weights at weaning (~5 to 6 kg) than BCS 3.0 ewes, due to greater individual lamb weaning weights. Kenyon et al [3] also found BCS 2.0 ewes had lower total litter weights at weaning than BCS 2.5 ewes, but BCS 3.0 ewes did not differ from either group. Everett Hincks et al [26] reported that triplet-rearing ewes with a BCS≤2.5 weaned 3.5 kg less total litter weight than ewes with a BCS≥3.0. Similarly, Mathias-Davis [30] observed triplet-rearing ewes with a BCS≤3.0 weaned less total litter weight than ewes with a BCS≥3.5. Overall, the results of these studies suggest that low BCS can be associated with poor lamb survival and thus should be avoided. Furthermore, when combined with the additive effect of poorer lamb growth rates, low BCS ewes can result in lower total litter weights.
At weaning the BCS 3.0 group of ewes were in better condition than the BCS 2.0 and 2.5 groups. This suggests they may have an advantage going into the next breeding in terms of their potential breeding performance [11].
CONCLUSION
The aim of the study was to examine the effect of ewe BCS and two nutritional treatments during very late pregnancy and lactation and the potential interaction of ewe BCS and nutritional treatment on twin-bearing ewe and lamb performance to weaning. No interactions between ewe BCS and nutritional treatment were found. The results of this study indicate there is no advantage in terms of lamb weaning weight or total weight of lamb weaned of offering ewes pasture masses greater than 1,200 kg DM/ha during the period examined. However, ewes which grazed pasture masses between 1,500 to 1,800 kg DM/ha had greater BCS and back-fat depth at weaning than those which grazed pasture masses between 1,200 to 1,300 kg DM/ha. Furthermore, the results of this study indicate farmers should ensure ewes have a BCS of greater than 2.0 in late pregnancy in order to optimise both ewe and lamb performance to weaning.
ACKNOWLEDGMENTS
The authors acknowledge the technical assistance given by Mr Dean Burnham and Mr Geoff Purchas. In addition, the authors thank Massey University and Gravida for funding this study.
Notes
CONFLICT OF INTEREST
We certify that there is no conflict of interest with any financial organization regarding the material discussed in the manuscript.