Data from 513 Hanwoo steer from 17 farms in Gyengsangbuk-do were employed to construct an ANCOVA model of how economic traits are influenced by five SNPs and environmental factors. Here economic traits were C18:1, MUFAs, MS, and CWT and five SNPs (g.12870 T>C, g.13126 T>C, g.15532 C>A, g.16907 T>C, and g.17924 G>A), which we previously found to influence the flavor and quality of beef [
7]. Some of these SNPs might change their functions by producing missense codons. The g.13126 T<C changes an amino acid from tyrosine to histidine. The g.15532 C<A or g.17924 G<A changes an amino acid from leucine to isoleucine or from alanine to threonine. Although the other SNPs are synonymous, we could not rule out the possibility that they might change splicing regulatory sequences, or that such genetic associations might be spuriously produced with their linked loci within each block [
18].
Then, we constructed an adjusted statistical model using an ANCOVA model and calculated adj (Y) values. The MDR method was used for individual SNPs and five-factor interactions for each economic trait (C18:1, MUFAs, MS, and CWT). According to the results, the accuracy of SNP interactions was much higher than that of individual SNPs. The most significant two-factor interaction was g.13126 T>C*g.15532 C>A for C18:1 and MUFAs. In addition, the g.12870 T>C*g.15532 C>A interaction showed the highest accuracy in MS, and the g.12870 T>C*g.17924 G>A interaction showed the highest accuracy in CWT. The three SNPs in exons 34 (g.15532 C<A), 37 (g.16907 T<C), and 39 (g.17924 G<A) were all associated with myristic acid in a crossbred of Limousin and Jersey (p<0.05) but not with C18:1 [
8]. The g.17924 was associated also with oleic acid in American Angus cattle (p<0.05) [
10] and Korean cattle (p<0.05) [
19]. This implies that these two-factor interactions had the greatest impact on economic traits influencing the flavor and quality of beef. The selected interaction for CWT changed before adjustment because CWT was heavily influenced by environmental factors.
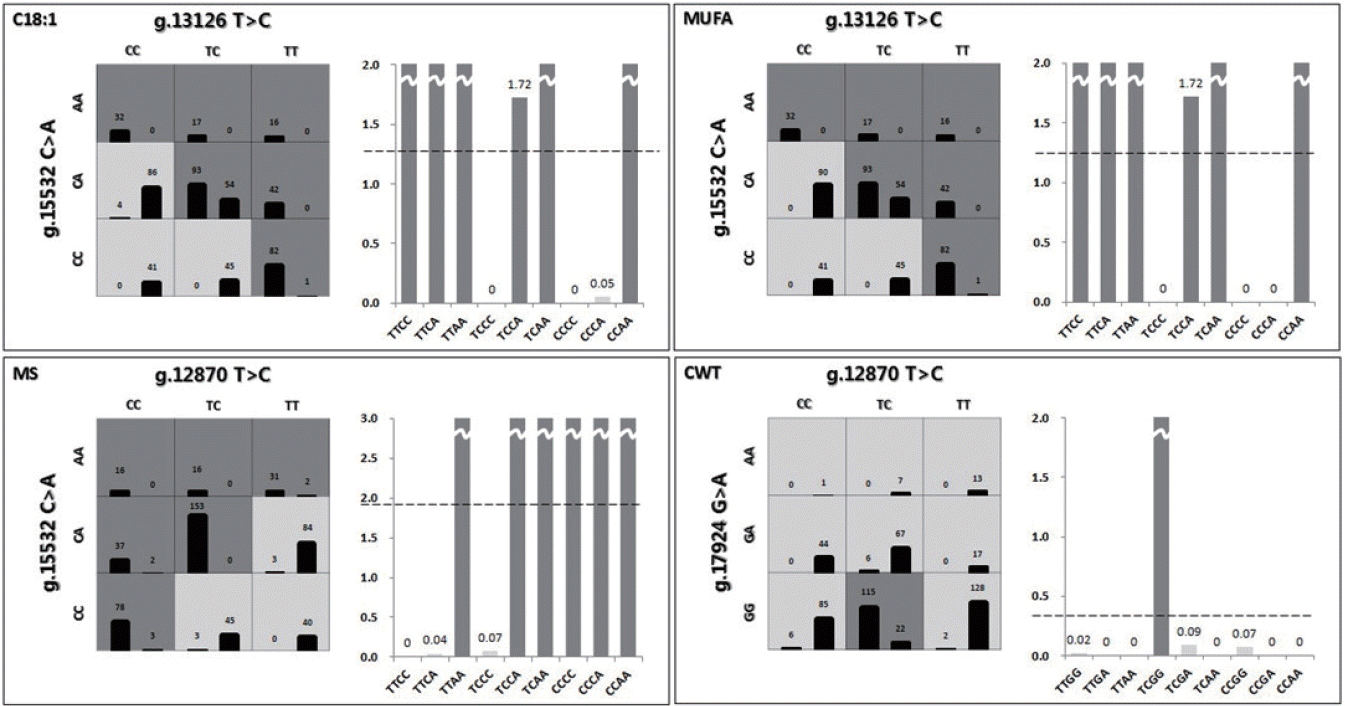
Figure 1 shows the contingency tables of the best two-factor interactions for each economic trait. The chi-square test of interactions was conducted to validate the results, and all tests were significant. In the figure, three factors and their possible multifactor classes or cells are represented in a three-dimensional space [
20]. The left bar of the cell refers to case frequency, and the right bar, to control frequency. Dark grey cells and grey cells indicate “high-risk” and “low-risk” groups, respectively, depending on whether the case-control ratio was above a certain threshold. The threshold was determined based on the case-control ratio for the whole data. Because the data were passed through the k-means clustering method for each trait, they had three different case-control ratios. Therefore, cells were classified based on the threshold for each trait. The high- and low-risk groups are shown in the graphs. The threshold was 1.2599 in C18:1. Nine genotypes of the two-factor interaction were divided into two groups by comparing their case-control ratios and thresholds. TTCC, TTCA, TTAA, TCCA, TCAA, and CCAA were labeled as the high-risk group and the others as the low-risk group. In MUFAs, MS, and CWT, the thresholds were 1.2208, 1.9148, and 0.3359, respectively. Similarly, each genotype was determined by comparing its ratio and threshold. TTCC, TTCA, TTAA, TCCA, TCAA, and CCAA for MUFAs; TTAA, TCCA, TCAA, CCCC, CCCA, and CCAA for MS; and TCGA for CWT were classified as the high-risk group. There was a significant difference between the high- and low-risk groups (
Table 5), indicating that high-risk genotypes were superior. In particular, two-factor interactions showed clear differences between the high- and low-risk groups. According to the results, the gene-gene interaction effect was superior to the individual SNP effect. As shown in
Table 5, individual and interaction effects of SNPs were examined and compared for C18:1, MUFAs, MS, and CWT. The superior genotype groups, which were all and significant, were 44.238 (standard deviation [SD] = 0.896, p<0.001, Cohen’s d = 1.905) for C18:1, 53.162 (SD = 0.911, p<0.001, Cohen’s d = 1.977) for MUFAs, 5.846 (SD = 0.3, p<0.001, Cohen’s d = 1.852) for MS, and 432.251 (SD = 3.787, p<0.001, Cohen’s d = 1.132) for CWT (
Table 5). The interaction effect of SNPs was greater than the individual effect for C18:1, MUFAs, MS, and CWT.


 PDF Links
 PubReader
 ePub Link
 Full text via DOI
 Full text via PMC
 Download Citation
 Print
Print


