Influence of rendering methods on yield and quality of chicken fat recovered from broiler skin
Article information
Abstract
Objective
In order to utilize fat from broiler byproducts efficiently, it is necessary to develop an appropriate rendering procedure and establish quality information for the rendered fat. A study was therefore undertaken to evaluate the influence of rendering methods on the amounts and general properties of the fat recovered from broiler skin.
Methods
The yield and quality of the broiler skin fat rendered through high and lower energy microwave rendering (3.6 W/g for 10 min and 2.4 W/g for 10 min for high power microwave rendering (HPMR) and high power microwave rendering (LPMR), respectively), oven baking (OB, at 180°C for 40 min), and water cooking (WC, boiling for 40 min) were compared.
Results
Microwave-rendered skin exhibited the highest yields and fat recovery rates, followed by OB, and WC fats (p<0.05). HPMR fat had the highest L*, a*, and b* values, whereas WC fat had the highest moisture content, acid values, and thiobarbituric acid (TBA) values (p<0.05). There was no significant difference in the acid value, peroxide value, and TBA values between HPMR and LPMR fats.
Conclusion
Microwave rendering at a power level of 3.6 W/g for 10 min is suggested base on the yield and quality of chicken fat.
INTRODUCTION
The production of broiler meat increased dramatically from 73.1 million tons in 2008 to 83.1 million tons in 2012 globally [1]. Along with the increasing consumption of chicken meat, the production of slaughtering byproducts, such as skin and abdominal fat tissues, has been increased dramatically. Byproducts count approximately 37% of the live weight of broilers [2]. A broiler carcass contains approximately 15% skin [3]; broiler skin without adipose tissues contains approximately 20% to 30% fat [4]. How to utilize these high quantity low-valued byproducts and convert to value-added products efficiently has become a great concern for the poultry industry. Rendering refers to the processing of animal fatty tissue from various animal food production chains, e.g. slaughterhouse, meat processing plants, butcher’s shops, and supermarkets, into purified fats [5]. Rendering not only eliminates possible environmental pollution which caused by the disposal of byproducts and wastes, but also utilizes those byproducts more efficiently. It was estimated that 1.01 million metric tons of poultry fat are rendered in US annually [2]. In addition to be added in animal feeds to provide energy and increase palatability, chicken fat can be also used as cooking oil or utilized as a biodiesel fuel [2]. Most rendering systems utilize heat to release fat from the cells of fatty tissues, and then separate the fat from the other surrounding nonfat matrix [6]. Depending on the presence or absence of water or steam, there are various rendering methods, including dry rendering, wet rendering, and frying [4,6].
Microwave radiation refers to the electromagnetic radiation in the microwave frequency range of 300 MHz–300 GHz, whereas the microwave oven appliances are generally operated at a frequency of 2.45 GHz [7]. Various applications of microwave in the food processing, including drying, cooking, rendering, pasteurization, sterilization, and extraction have been reported [8]. Under an oscillating electric field of specific frequency, microwaving causes molecular frictions of electric dipoles (particularly water molecular), and then increases temperature of microwaved samples [9]. More detailed principles about the microwave processing have been interpreted [10]. Because of rapidly heating of materials, microwaving has been explored for extracting oil and fat from seeds and other foods [11]. Lipid oxidation not only leads to the formation of rancid flavors which turndowns the acceptance of products, but it might also result in the degradation of nutritional quality; it might even produce some oxidation products related to the development of certain diseases [5,12]. In order to utilize fat from broiler byproducts efficiently, it is necessary to develop an appropriate rendering procedure and establish quality information for the rendered fat. A study was therefore undertaken to evaluate the influence of rendering methods on the amounts and general properties of the fat recovered from broiler skin.
MATERIALS AND METHODS
Materials
Frozen broiler skins (Charoen Pokphand Enterprise (Taiwan) Co. Ltd., Nantou, Taiwan) were grinded, mixed thoroughly, vacuum-packaged, and stored at −18°C. Prior to testing, the skins were thawed at room temperature for 4 h. All chemicals applied in the current study for determining fat quality were analytical grade.
Rendering of broiler skin fat
The following rendering methods were applied according to the studies of Sheu and Chen [4] and Zhang et al [5] with some modifications.
Oven baking: skin (250 g) placed in a stainless pan was heated in a conventional oven (KZ-HA 18, Sampo Corporation, Taipei, Taiwan) at 180°C for 40 min.
Water cooking: skin (250 g) with water (1:2, w/w) placed in a beaker was boiled on a hot plate for 40 min. After removing skin residues, the liquid was cooled down to room temperature, and fat layer was separated using a separatory funnel.
Low power microwave rendering: skin (250 g) placed in a beaker was rendered at a power level of 2.4 W/g for 10 min using a microwave oven (JE1043TGWW, GE Appliances Taiwan Corporation, Taipei, Taiwan).
High power microwave rendering: ground skin (250 g) placed in a beaker was rendered at a power level of 3.6 W/g for 10 min using the same microwave oven.
Analysis of samples
Rendering yield, fat recovery rate, and moisture content
The rendering yield and fat recovery rate of chicken fat were determined according to the methods of Sheu and Chen [4] and Zhang et al [5] using the following equations.
Chicken fat (5 g) was weighed into an aluminum dish and dried at 105°C to a constant weight. The percentage of moisture was then calculated.
Color
Fat (50 mL) at 25°C was placed in a petri dish and color values were measured using a colorimeter (NR-3000, Nippon Denshoku Ind. Co., Ltd., Tokyo, Japan) which was calibrated before measurement. All measurements were conducted in triplicate and averaged.
Acid value, peroxide value, and thiobarbituric acid value
The acid values and peroxide values of chicken fat were determined using the AOAC method [13] and expressed as mg KOH/g and meq/kg, respectively. The thiobarbituric acid (TBA) value was determined according to the AOCS method [14]. Fat previously weighted (approximately 50 to 200 mg) was dissolved and made up to 25 mL with 1-butanol. Five-mL of the test solution was transferred and mixed thoroughly with 5 mL of the TBA reagent. After heated at 95°C for 120 min, cooled with tap water for about 10 min until it reaches room temperature, the absorbance of the reaction solution was determined at 530 nm. A reagent blank was also prepared. Results were calculated using the formula of TBA value (μmol/g oil) = (absorbancetest solution − absorbancereagent blank)×50×1,000/mass of the test portion.
Statistical analysis
All measurements were conducted in triplicate. Data was analyzed using the analysis of variance procedure (ANOVA) of Statistical Analysis System’s Procedures (SAS Institute Inc., Cary, NC, USA) with a 5% level of significance. Means were separated using the Scheffe’s test [15].
RESULTS AND DISCUSSION
Yield and fat recovery rate of fat
Figure 1 illustrated that the yields of high power microwave rendering (HPMR) and low power microwave rendering (LPMR) fats were significantly higher (38.4% and 36.6%, respectively), followed by OB (30.4%) and WC (23.3%) fats (p<0.05); Sheu and Chen [4] reported that microwave-rendered chicken skin had the highest yield among the samples evaluated; both studies demonstrated that microwave-rendered fats had higher yields than oven-baked and water-cooked ones. Cheng et al [16] found that yield of abdominal fat tissue increased as the rendering temperature and time increased. Zhang et al [5] reported that yields of the rendered chicken fat increased (p<0.05) as the microwave power increased from 2.0 W/g to 2.75 W/g, and no significant increase was observed as the power level increased further to 3.0 W/g. The fat content of broiler skin in our study determined by ether extraction was 51.7%, which was close to 51.5% reported [4], and both were lower than 72% to 73% in broiler abdominal fat tissues [5]. In the current study, the fat recovery rates of HPMR and LPMR fats were 74.2% and 70.1%, respectively, followed by OB (58.9%) and WC (44.9%) fats. Sheu and Chen [4] reported that broiler skin microwave-rendered for 8 min had a higher fat recovery rate compared to the oven-baked or water-cooked for 40 min. Zhang et al [5] reported a 96.5% recovery rate of fat from broiler abdominal fat tissue rendered at a power level of 2.75 W/g for 10 min; as the power level increased to 3.00 W/g, almost all the fat was rendered out from the tissues. The difference in the fat recovery rates in the different studies was probably because of the different raw materials (i.e., skin or abdominal fat tissues), rendering power levels, and duration applied. Li et al [17] and Zhang et al [5] explained that microwave power and irradiation time are the two major factors determining the various rendering parameters, such as rendering temperature and rendering speed, and eventually affect the rendering efficiency and quality of the final product.
Acid value of the chicken fat produced through various rendering methods. OB,: oven baking at 180°C for 40 min; WC, boiling for 40 min; LPMR, low power (2.4 W/g for 10 min) microwave rendering; HPMR, high power (3.6 W/g for 10 min) microwave rendering. A–B Means within with different letters are significantly different (p<0.05).
Moisture content of broiler skin fat
Table 1 shows that WC fat had the highest moisture content (p< 0.05). Sheu and Chen [4] found that water-cooked broiler skin fat had the highest moisture content compared to the microwaved and oven-baked ones. In our study, the moisture content of WC fat (2.19%) was apparently higher than 0.25% which was a limit suggested [18]. The incomplete separation of fat and water because of the limitation in the laboratory operation might be partially responsible for the high moisture content of these samples [5]. In our study, HPMR fat tended to have lower moisture content than LPMR fat (0.32% vs 0.59%) even though without significant difference (p>0.05). Zhang et al [5] reported that the moisture contents of the rendered broiler abdominal fat decreased significantly from 2.33% to 1.50% when the microwave power level increased from 2.00 W/g to 2.25 W/g and no moisture was detected when the power level increased further to 2.75 W/g and more; the moisture content of fat decreased dramatically from 16.67% to 2.57% when the rendering time increased for 6 min to 8 min at the same power level of 2.75 W/g, and no moisture was detected when rendering for 10 min. During microwave irradiation, Zhang et al [5] explained that water in the fat tissues was exuded out and evaporated, particularly when the temperature exceeded 100°C. The evaporation and removement of water was related with the sample temperature which influenced by the microwave power. As the power level increased, sample temperature increased and moisture content decreased. In our study, HPMR fat, which had a higher final temperature than LPMR fat (140°C vs 135°C); water was evaporated more easily and eventually resulting in less moisture content. High moisture content has been illustrated to result in fat quality deterioration [5]. On the other hand, when no water resides in fats, high temperature speeds up oxidation and eventually deteriorates fat quality [19].
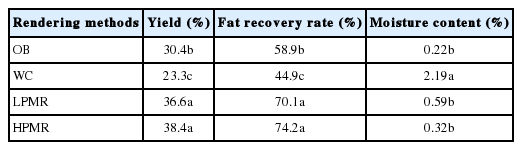
Yield, fat recovery rate, and moisture content of the chicken fat produced through various rendering methods
Color of rendered fat
Color is one of the most critical factors influencing consumers’ decision when selecting and purchasing foods. Many factors, such as genetic background, ages of animals, locations of animal body, and feeds (particularly pigments, e.g., xanthophylls and carotenoids, in feeds) attribute to the differences in colors of skin and fat [20,21]. Commonly, the L*, a*, and b* values of samples were determined in order to express the lightness, redness, and yellowness, respectively, of samples [5,22]. Table 2 shows that the microwave-rendered fat was lighter and more red and yellow in color than OB and WC fats as implicated by the higher L*, a*, and b* values. Sheu and Chen [4] found that microwave-rendered fats had higher b value than water-cooked and oven-baked ones, and the color differences among the rendered fats were probably due to the different rendering temperatures and moisture contents in fats. In our study, HPMR fat had significantly higher a* and b* values compared with LPMR fat (p<0.05). Zhang et al [5] found that chicken fat rendered at power level of 2.00 W/g had the highest L* and b* values and the lowest a* value. As the power levels increased or irradiation time extended, the rendered fat became darker and browner. During the rendering process, fat color may also be influenced by the Maillard browning reaction [4]. As reacting the amino groups of the polar head of phospholipids with the certain oxidative breakdown products of fatty acids (such as aldehydes), lipid oxidation interacts with the Maillard reaction, and both further contribute coordinately to the browning in fatty foods [23]. Additionally, some lipid oxidation products, such as glyoxal, methylglyoxal, and other carbonyl compounds, might react with amines, amino acids, and proteins, and consequently attribute the browning reaction which observed in many fatty foods during processing and storage [23]. Temperature and other factors, such as atmospheric oxygen, moisture content, and types of amino acids and reducing sugars affect the progress of the Maillard reaction in foods [24]. In this study, HPMR fat had higher final temperatures compared to LPMR fat (140°C and 135°C, respectively) because of more energy provided probably agitated the progress of the browning reaction and eventually attributed to significantly higher a* and b* values of the samples [5].
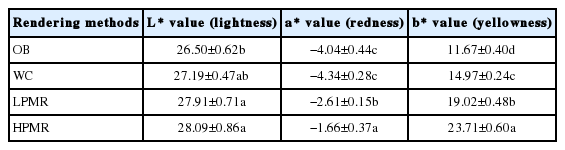
Color parameters of the chicken fat produced through various rendering methods
Acid value
Figure 1 illustrated that WC fat had significantly higher acid value (1.01 mg KOH/g) than the other rendered fats (0.90, 0.87, and 0.87 mg KOH/g for OB, LPEM, and HPEM fats, respectively, without significant difference between treatments). In this study, regardless of the rendering methods, all the values did not exceed the limits of 2 mg KOH/g suggested [25]. Zhang et al [5] reported no significant difference exhibited between the acid values of the chicken fats rendered at microwave power levels of 2.0 and 2.25 W/g (1.60 and 1.57 mg KOH/g, respectively); however, the acid values significantly decreased to 1.33 and 1.29 mg KOH/g, respectively, as the power level increased to 2.5 W/g and 2.75 W/g; the authors indicated that many factors, such as oxygen content in interface, water activity, and temperature of food might influence the oxidation of fat. If fat contains some water, the moisture content influences fat quality considerably. For example, in their study, the fat rendered at 2.0 W/g had higher moisture content and acid value (p<0.05) as compared to the sample rendered at 2.50 W/g [5]. In our study, WC fat with the highest moisture content (2.19%, p<0.05) also had significantly higher acid value compared to LPMR, HPMR, and OB fats (0.59%, 0.32%, and 0.22% of moisture contents, respectively). Karoui et al [26] indicated that the formation of free fatty acids might be promoted by reacting oils or fats with moisture and it further deteriorates qualities of products. On the other hand, Zhang et al [5] found that as the microwave power level increased further to 2.75 W/g and above, the moisture levels in the samples decreased to a non-detectable level. Meanwhile, the increases (p< 0.05) in the fat quality index including acid values indicated the decreased quality of fat. The stronger the microwave power was, the faster the sample temperature rose, and the higher the final temperature of rendered fat was. When no moisture exhibiting in the samples and microwave energy level increased, more energy provided would result in an increased oxidation rate in fats, illustrating with an increased acid values of samples [19].
Peroxide value
In this study, no difference (p>0.05) in the peroxide value was observed between the samples (Figure 2); regardless of the rendering methods, all the rendered broiler skin fats had peroxide values less than 10 meq/kg, which is the limit allowed by the standards of the Codex Alimentarius [27] for edible fats and oils [28]. Except for the skin fat obtained from the griddle rendering had the highest (p<0.05) peroxide value, Sheu and Chen [4] found that there was no significant difference in peroxide values between the fats rendered by deep-fat frying, water cooking (WC), microwave rendering, and oven baking (OB). Pereira et al [29] explained that higher rendering temperature and more oxygen incorporation during rendering process might attribute to the higher peroxide values of dry-rendered fat when compared with wet-rendered fat. Cheng et al [16] found that the higher the heating temperature or the longer the heating time, the higher peroxide value of rendered chicken fat. Zhang et al [5] reported peroxide values decreased (p<0.05) as the microwave power level increased from 2.0 W/g to 2.75 W/g probably because of less moisture retained in the fat. However, as the power increased further to 3.0 W/g, no water was left in the samples. More energy obtained as higher microwave level provided would result in an increased sample temperature and eventually speeded up the fat oxidation; in the same study, at the same power level of 2.75 W/g, as the microwave time extended from 6 to 8 min, the decrease in the peroxide values (7.1 meq/kg to 4.7 meq/kg) coincided with the decreased moisture content of samples (16.7% to 2.6%). However, as the microwave time extended further to 10 min and more, no water was left in fat and the peroxide values of samples increased numerically.
Peroxide value of the chicken fat produced through various rendering methods. OB, oven baking at 180°C for 40 min; WC, boiling for 40 min; LPMR, low power (2.4 W/g for 10 min) microwave rendering; HPMR, high power (3.6 W/g for 10 min) microwave rendering. A–B Means within with different letters are significantly different (p<0.05).
Thiobarbituric acid value
Figure 3 shows that WC fat had the highest (p<0.05) TBA value, followed by OB, LPMR, and HPMR fats. Sheu and Chen [4] found that griddle rendered skin fat had the highest TBA values, followed by oven-baked, water-cooked, and microwave-rendered fats. Zhang et al [5] observed that TBA values of the rendered chicken fats significantly decreased when the microwave power level increased from 2.00 W/g to 2.75 W/g. Water in fat acted as a medium to absorb microwave energy. If there is more energy provided to the samples because of a higher power level applied, the amount of water in fat would decrease. The authors explained this decrease in TBA values probably because of the fact that if there was some water, which acted as the medium absorbed microwave energy, resided in the fats as the microwave power increased, and eventually decreased the deterioration of rendered fats. However, as the microwave power increased further from 2.75 W/g to 3.0 W/g, much less moisture was resided in these samples (i.e., even not detected). At this stage, instead of the influence of moisture content, higher final sample temperature (i.e., 162.3°C vs 146.0°C) caused by the increased microwave energy eventually attributed to the increased TBA values of the rendered fat. Zhang et al [5] commented that if fat contained water, the moisture content determined the variation of fat quality indexes; contrarily, when there was no water left in fat, temperature rise resulted in the increasing of TBA value of chicken fat.
TBA value of the chicken fat produced through various rendering methods. OB, oven baking at 180°C for 40 min; WC, boiling for 40 min; LPMR, low power (2.4 W/g for 10 min) microwave rendering; HPMR, high power (3.6 W/g for 10 min) microwave rendering. A–B Means within with different letters are significantly different (p<0.05).
CONCLUSION
Among all the rendering methods evaluated in the current study, including high and lower energy microwave rendering (3.6 W/g for 10 min and 2.4 W/g for 10 min, respectively), OB (at 180°C for 40 min), and WC (boiling for 40 min), the microwave rendering resulted in high yield and fat recovery rate (p<0.05). Also, the microwave-rendered fats had lower acid values and TBA values when compared to the water-cooked one (p<0.05). In conclusion, on the basis of the results of the current study, microwave rendering is a promising method to render chicken fat from broiler skin with high yield and quality. Further studies which focus on the influences of microwave energy level and rendering duration on chicken fat as well as the sensory acceptability of rendered fat during storage should be conducted.
ACKNOWLEDGMENTS
The authors would like to thank Charoen Pokphand Enterprise (Taiwan) Co. Ltd. (Nantou, Taiwan) for kindly providing broiler skins.
Notes
CONFLICT OF INTEREST
We certify that there is no conflict of interest with any financial organization regarding the material discussed in the manuscript.