Effects of dietary protein level on growth performance and nitrogen excretion of dairy heifers
Article information
Abstract
Objective
Protein supplementation is costly and can result in excess nitrogen (N) excretion. The objective of this study was to evaluate the effects of feeding different levels of dietary protein on average daily gain, body size, rumen fermentation, and nitrogen excretion of 8 to 10 month-old Holstein heifers.
Methods
Thirty-six Holstein heifers were divided into 12 blocks according to age (273±6.2 d) and were randomly assigned to diets containing a low (10.2% dry matter [DM]), medium (11.9% DM), or high (13.5% DM) level of dietary crude protein (CP). All diets contained approximately 70% roughage and 30% concentrate with similar dietary metabolizable energy (ME) content (2.47 Mcal/kg).
Results
Dry matter intake did not differ among the treatments, and average daily gain increased with the increasing dietary protein, 0.79, 0.95, 0.97 kg/d for low, medium, and high group, respectively. Body height increased linearly with increasing dietary CP but no other significant differences in body dimensions were found among the treatments. The increased ratios of dietary CP improved the rate of rear teat length growth remarkably (p<0.05). There was no difference in rumen pH or ruminal major volatile fatty acid (acetate, propionate, and butyrate) concentration among the 3 diets, but rumen ammonia-N concentration increased with the higher dietary CP (p<0.05). Increasing N intake led to increased total N excretion; urinary N excretion was significantly increased (p<0.05) but fecal N excretion was similar among the treatments.
Conclusion
These data suggest that the diet containing 11.9% CP (ME 2.47 Mcal/kg) could meet the maintenance and growth requirements of 9 to 11 month-old Holstein heifers gaining approximately 0.9 kg/d.
INTRODUCTION
In the past few decades, major fresh water lakes in China, like Taihu, Dianchi and Chaohu, have been polluted [1]. Excessive concentrations of nitrogen (N) and phosphorus (P) are recognized as a main cause of eutrophication in lakes. Non-point source N and P emissions, such as those resultant from dairy farms, are a key contributor to excessive N and P loading of lakes and waterways [1,2]. A recent survey showed that the average livestock producers in eastern China fed heifers 0.51% dietary P on dry matter (DM) basis and that dietary P ranged from 0.46% to 0.72% DM [3]. This survey also identified the average diet contained 14.8% DM crude protein (CP) and that dietary CP levels ranged from 12.5% to 17.2% [3]. The mean quantities of dietary CP and P are much greater than the amount recommended by the NRC [4]. Thus, it is necessary to evaluate the true requirement of N and P in heifers.
Wang et al [5] reported that milk yield was not different when cows were fed diets with dietary P of 0.37% (DM) or 0.57% (DM), but fecal P excretion decreased by 23% as dietary P lessened by 0.1 percentage points. Previous work has also revealed that lessening dietary P from 0.42% to 0.26% did not affect 8 to 10 month-old heifers’ growth performance [6]. Similar results have been identified for CP. Former studies have reported no improvement in milk yield or milk protein production when dietary CP was increased from 16.5%–16.7% to 18.5%–19.4% for Holstein dairy cows producing 34 to 38 kg of milk per day. Moreover, urinary N excretion decreased by 13.1% to 14.8% as dietary CP dropped by one percentage point [7,8]. There was less attention focused on effects of dietary CP on heifers growth performance, therefore, the objective of current study is to assess feeding different levels of dietary CP on average daily gain (ADG), body size, rumen fermentation, and N excretion of 9 to 11 month-old heifers.
MATERIAL AND METHODS
Animals and experimental diets
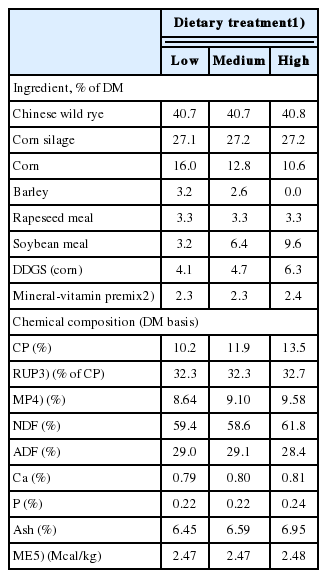
The use of animals was approved by the Animal Care Committee of Zhejiang University, Hangzhou, China. Thirty-six Holstein heifers were divided into 12 blocks according to age (273±6.2 d) and were randomly assigned to a low (10.2%), medium (11.9%), and high (13.5%) level of dietary CP (Table 1). All diets contained approximately 70% roughage and 30% concentrate and had similar amount of metabolizable energy (ME) content. Different dietary CP levels were obtained by adjusting the proportion of ground corn, barley, rapeseed meal, distillers dried grains with solubles, and soybean meal. The low CP (low) group was designed to replicate the Chinese dairy cow feeding standard recommendations (NY/T 34–2004, body weight [BW] from 250 to 350 kg, ADG from 800 to 1,000 g) [9]. The amount of CP in medium CP (medium) group was designed to meet the CP requirement recommended by the NRC (BW from 250 to 350 kg, ADG from 800 to 1,000 g) [4]. The high CP (high) group best represented the level of CP commonly fed by livestock producers in the east region of China [3]. All heifers were housed in a tie-stall barn with free access to water. Heifers were fed 3 times daily at 0630, 1400, and 2030 h and adapted to the treatment diet for 10 d prior to beginning measurement. Measurements were collected for 8 weeks from October until December 2014.
Measurements and analytical methods
Feed samples were collected weekly. Samples were dried for determination of the treatment DM with adjustment of treatment rations to achieve daily dry matter intake (DMI) of 2.50% of BW. The remaining samples were dried in a forced oven at 55°C for 48 h, milled using Wiley mill with1-mm screen, and analyzed for CP, calcium (Ca), P, ash [10], neutral detergent fiber, acid detergent fiber [11]. Body height, body length, heart girth, and teat length were measured at the beginning of the treatment period and every 4 week until the end of the treatment period. Blood samples (5 mL) were collected from the coccygeal vein on the d 1, 25, and 51, and centrifuged at 3,000×g for 10 min to collect serum, which was frozen (−20°C) for later analysis. Plasma urea nitrogen (PUN), Ca and P concentrations were analyzed using a HITACHI (7020) Automatic Analyzer, and kits were provided by Ningbo Medicalsystem Biotechnology CO., LTD (Ningbo, China). Total collection of feces and urine was conducted during week 7. All excreted urine was weighed and subsamples (100 mL of urine) were gathered at 0700, 1430, and 2030 h, and mixed across hours within a day for later analysis. Feces samples were analyzed for total N (Kjeltec auto analyzer) and urine samples were analyzed for total N (Kjeltec auto analyzer) and urea N using kits obtained from Ningbo Medical-system Biotechnology CO., LTD (Ningbo, China). On the d 57 of experimental period, rumen fluid samples were acquired approximately 4 h after morning feeding using an oral stomach tube [12]. Ruminal pH was immediately recorded with a portable pH meter (Starter 300; Ohaus Instruments Co. Ltd., Shanghai, China). Rumen fluids were strained through 4 layers of cheesecloth, and strained fluid was collected and stored at −20°C for subsequent analysis of ammonia-N and volatile fatty acid (VFA) [13].
Calculations and statistical analysis
The BW of each cow was calculated based on the measurement of heart girth and body length using the following equation: BW (kg) = heart girth2 (m)×body length (m)×87.5 [14–16]. Data were analyzed using SPSS statistical software package (IBM SPSS statistics 20.0; IBM Corp., Armonk, NY, USA). The data on PUN, plasma Ca, and P concentrations were statistically analyzed as repeated measures in time for effects of treatment, time, treatment×time by the Mixed procedure of SPSS. Data on DMI, ADG, manure excretion, body measurements, and rumen fermentation measurements were analyzed using general linear model (GLM) of SPSS. Teat lengths were analyzed by using univariate of GLM, data at the beginning were used as co-variable. Treatments were also tested for linear and quadratic effects by orthogonal polynomial contrasts. Probability values of p<0.05 were used to define statistical significance and values of p<0.10 and p≥0.05 were accepted as statistical trends.
RESULTS AND DISCUSSION
Feed ingredients, dry matter intake, crude protein intake, average daily gain
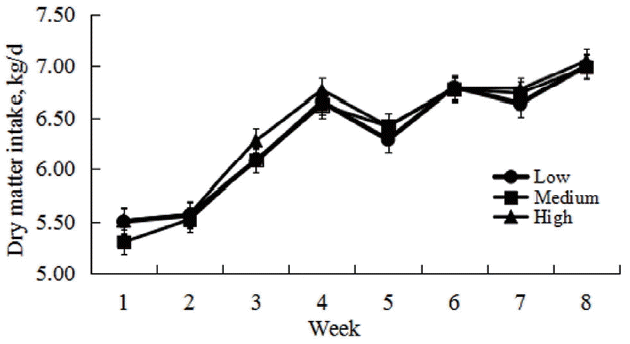
The experimental diets had a similar composition of nutrients but with different CP concentrations and intake (Tables 1 and 2). Heifers began the study at 273±6.2 d of age and 235±8.2 kg of BW with no differences among treatments. Increasing the dietary CP had no influence in DMI, and average DMI was 6.3 kg/d (p>0.05; Figure 1). It is likely that DMI was no different among treatments because of restricted feeding. Previous work has suggested that the ADG of Holstein heifers must be greater than 800 g/d and less than 1,000 g/d [17]. This growth rate is optimal as it ensures that heifers reach a BW of 570 kg at 24 mo of age and helps to prevent excessive fattening. In this study, the ADG was similar between the high group and medium group (ADG>900 g/d), but ADG was lower (799.9 g/d) in low group (p<0.05; Table 2). The ratios of dietary protein to energy, as well as the sum of rumen undegraded protein, are the two major factors that affect the ADG of dairy heifers [4]. These results agreed with the previous reports that the ADG was 900 g/d on a diet with 11.9% CP [18].

Initial age, body weight (BW), and average daily gain (ADG) of heifers fed different dietary protein level
Body growth and mammary development
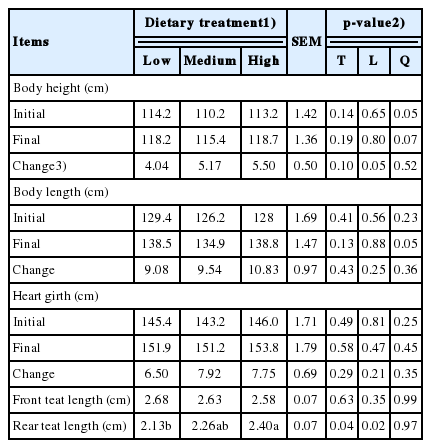
Structural growth was evaluated by measuring body height, body length, and heart girth (Table 3). No differences were found in initial values for these parameters among the treatments, but across the feeding period the net increase in body height was higher for High group than Low group (p = 0.10). Lammers et al [19] and Gabler et al [20] reported that heifers’ structural growth was maximized with a high protein diet, which increased the rate of body growth by 13% to 18%. The growth rate of body height was 0.081, 0.104, and 0.110 cm/d for Low, Medium, and High group, respectively. According to this growth rate, the Low, Medium, and High group should reach recommended breeding size (body height 127 cm) by 15.0, 13.7, and 13.5 month-old, respectively. Obviously, Low group can’t meet the optimal breeding age at 13 to 14 month-old [21].
The increased ratios of dietary protein remarkably improved the rate of rear teat length growth (p<0.05; Table 3). Teat length was used as an indirect measurement of mammary development, and the dairy cows fed higher CP diets tend to have lengthier teats [22]. Sejren et al [23] reported that accelerated prepubertal heifer growth rates have been shown to decrease mammary secretary tissue development, which led to lower subsequent milk production. However, other studies suggested that feeding high CP diets to heifers might be essential for optimal mammary development [19,24], but this conclusion still need more studies to support.
Serum parameters and rumen fermentation
Blood Ca and P levels were similar among the treatments (Table 4) and were in normal ranges recommended by NRC [4]. Plasma urea N levels linearly increased with higher ratios of dietary protein (p<0.05; Table 4). The PUN concentration is related to protein intake and is influenced by energy and protein levels in the diet [18,25]. Gabler et al [26] stated that when diets had similar DMI and nonstructural carbohydrates concentrations, higher CP intake or specific CP fractions increased PUN values.
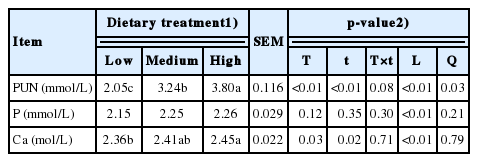
Effect of dietary protein level on the plasma urea nitrogen (PUN), calcium (Ca) and phosphorus (P) of heifers
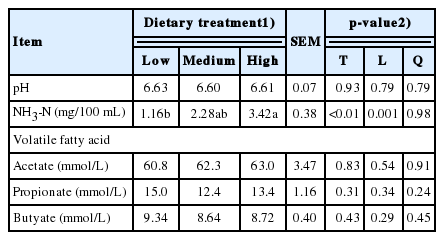
The rumen fermentation characteristics are presented in Table 5. No significantly differences were detected in rumen pH or VFA (acetate, propionate, and butyrate) among treatments. Ammonia-N concentrations were increased with increasing ratios of dietary protein (p<0.05). Satter et al [27] reported that 2 mg/dL of ammonia-N was the lower limit needed for rumen microbial growth and 5 mg/dL was the upper limit for animal health and safety. In the current study, ammonia-N on the high and medium CP diets was 2.38, and 3.42 mg/dL, respectively, but the concentration of low group was lower than 2 mg/dL. Based on the recommendations in Satter et al [27], the low CP diets may have produced insufficient ammonia-N for microbial growth in rumen.
Manure excretion, nitrogen intake and excretion
There were no differences in fecal, urine, and total manure excretion for heifers fed diets with different dietary CP (Table 6). Total manure and wet fecal excretion are closely related to DMI [28]. In this study, DMI were not different among treatments, so it was not surprising that manure excretion was similar. Nitrogen intake was greater in heifers fed higher protein compared with those fed lower protein (Table 6). Fecal excretion of N was not affected by CP level, while urinary N measurements, including urinary urea N, were linearly increased with increasing dietary CP (p<0.05). Former studies reported that increasing N intake lead to increased urinary N excretion, while fecal N excretion was not altered by treatments [26,29]. The ratio of retained N to N intake was not different in heifers among the treatments, which demonstrated that high dietary CP did not improve the N efficiency, while ME was maintained constant in diets.
CONCLUSION
It is concluded that diets containing 11.9% CP with approximately 2.47 Mcal/kg ME are sufficient to meet requirements of 9 to 11 month-old Holstein heifers gaining 0.9 kg/d. This growth rate was sufficient to allow animal to reach breeding recommendations at 13 to 14 mo age. High dietary CP would increase the N excretion without improving the N utilization efficiency.
ACKNOWLEDGMENTS
This work was supported by the National Key Technology R &D of China (No. 2012BAD12B02). The authors thank Dr. Robin White at Virginia Polytechnic Institute and State University for revising English language and suggestions that substantially improved the manuscript. The authors also gratefully thank all staff at the Shanghai Lianjiang (Anhui) dairy farm for their help in this study.
Notes
CONFLICT OF INTEREST
We certify that there is no conflict of interest with any financial organization regarding the material discussed in the manuscript.
