Evaluation of gaseous concentrations, bacterial diversity and microbial quantity in different layers of deep litter system
Article information
Abstract
Objective
An experiment was conducted to investigate the environment of the deep litter system and provided theoretical basis for production.
Methods
The bedding samples were obtained from a pig breeding farm and series measurements associated with gases concentrations and the bacterial diversity as well as the quantity of Escherichia coli, Lactobacilli, Methanogens were performed in this paper.
Results
The concentrations of CO2, CH4, and NH3 in the deep litter system increased with the increasing of depth while the N2O concentrations increased fiercely from the 0 cm to the −10 cm depth but then decreased beneath the −10 cm depth. Meanwhile, the Shannon index, the dominance index as well as the evenness index at the −20 cm layer was significantly different from the other layers (p<0.05). On the other hand, the quantity of Escherichia coli reached the highest value at the surface beddings and there was a significant drop at the −20 cm layer with the increasing depth. The Lactobacilli numbers increased with the depth from 0 cm to −15 cm and then decreased significantly under the −20 cm depth. The expression of Methanogens reached its largest value at the depth of −35 cm.
Conclusion
The upper layers (0 cm to −5 cm) of this system were aerobic, the middle layers (−10 cm to −20 cm) were micro-aerobic, while that the bottom layers (below −20 cm depth) were anaerobic. In addition, from a standpoint of increasing the nitrification pathway and inhibiting the denitrification pathway, it should be advised that the deep litter system should be kept aerobic.
INTRODUCTION
As an environmentally friendly raising system for pigs, the deep litter system utilizes a mixture of bedding material such as straw, sawdust, wood shaving or other agricultural waste. This system can not only degrade the pig excreta but also reduces ammonia (NH3) and the greenhouse gases emissions [1], which has drawn increasing attention by researchers during recent years. When compared with the slatted or solid floor system, the deep litter system has many advantages. First, management costs such as waste treatment, water consumption as well as heating in winter are often reduced [2]. Second, it has been reported that the deep litter system can improve animal welfare [3]. Last, pigs kept on a deep litter system had higher growth speed and meat quality [1]. However, previous researchers mainly emphasized its physical and chemical properties [4], but few were concerned about understanding the working mechanism of deep litter system. For this reason, this work was undertaken to evaluate the environment of the deep litter system.
From the perspective of environmental protection, the key function of the deep litter system is to degrade the manure and reduce the pollution. Thus, a well-functioning deep litter system should break down the organic compounds into non-toxic, harmless and small molecules as much as possible. Under practical conditions, microorganisms play a dominate role in the degradation processes and generate many gases such as NH3, carbon dioxide (CO2), methane (CH4), and dinitrogen monoxide (N2O), which subsequently evaporate into the stall air and the surrounding environment of the beddings [5]. Chemical and biological processes cause the generation of gases from different depths of the beddings. For instance, NH3 is the intermediary product of the hydrolysis of the nitrogen excreted as urea to ammonium ions. Moreover, there are other forms of gaseous nitrogen involved in nitrification and denitrification [6]. Meanwhile, N2O, another intermediate product of nitrification and denitrification [7], when combined with NH3 concentrations could indirectly reflect the anaerobic process. The formation of CO2 is dominant when there is sufficient O2, but the generation of CH4 is closely connected to conditions where there is a lack of O2. Thus, the analysis of the generation of these two gases could predict the aerobic and anaerobic bedding circumstance at different layers.
On the other hand, microbes work as the driving force in the decomposing process, thus studying the microbial diversity and analyzing microbial quantity will help to understand the environment of the deep litter system. Bacteria are the most widely distributed microorganism in the biosphere, therefore bacterial diversity was measured to diagnose the ecosystems of deep litter. Furthermore, Escherichia coli (E. coli) and Lactobacilli are facultative anaerobes, while Methanogens are anaerobic archaea, and their quantities may indirectly indicate the environment of the deep litter. Moreover, E. coli, is widespread in manure [8] and is used as indicator microorganism for the risk of microbial contamination of the environment [9]. Whether it is prevalent in the deep litter system is not clear. Thus, the quantity of these three microorganisms were analyzed in this paper to further understand the environment of the deep litter system.
In conclusion, in order to understand the environment of deep litter system, the concentrations of CO2, CH4, N2O, and NH3 were measured by an infrared photo acoustic detection. In addition, bacterial diversity and the quantities of E. coli, Lactobacilli, Methanogens were respectively detected by polymerase chain reaction-denaturing gradient gel electrophoresis (PCR-DGGE) and real-time PCR for the same purpose.
MATERIALS AND METHODS
Animals housing and gases concentrations measurement
The bedding samples were obtained from a pig breeding farm located at the northeast of Taicang, Jiangsu province, China. The samples were collected in July 15 to July 17, 2013 and it had been one month since the bedding litter was last plowed. The average daily temperature ranged from a minimum of 27°C to a maximum of 37°C. The fattening pig house was 168 m2 and divided into three pens. Each pen was 7 m wide and 8 m long (the piggery structure was shown in Figure 1 and each pig had an average area of 1.5 m2). On the two sides of the piggery, there were two 1 m wide concrete floors and one 5 m wide bedding located in the middle of the pen. One concrete floor had a fixed crib [Figure 1 (3)] and the other had a fixed waterier [Figure 1 (8)]. One hundred and five fattening piglets with an average body weight of 45.5±0.4 kg were used in this experiment. Pigs in the deep litter system received a commercial diet that was based on corn and soybean meal. Diets were in meal form and pigs had ad libitum access to feed.

Schematic diagram of the experimental design. (1) stainless steel tube; (2) sampling site; (3) crib; (4) infrared photo acoustic detection; (5) gas collection pipe; (6) nylon material; (7) the beddings; (8) waterier.
Gases concentrations at different layers of the bedding were collected by a gas pipe. The gas pipe was inserted in a stainless steel tube [Figure 1 (1)] which was empty inside. Except for the two ends of the pipe which were exposed to the atmosphere, the other parts were airtight. One end of the pipe was connected with an infrared photo acoustic detection, the other end of the pipe was stuffed in a hole on the upper and then extended to the bottom of the stainless steel tube. The hole on the upper end of the tube was plugged by rubber in order to ensure that the pipe was cut off from the atmosphere. At the bottom of the stainless steel tube, a wedge structure was designed to let the tube be easier to insert into the deep litter. The wedge structure was wrapped tightly by nylon material to prevent the pipeline been blocked by litter in the bedding. By this way, the stainless steel tube could protect the gas collection pipe. In order to ensure the accuracy of the measurement and the safety of the gas collection pipe, the stainless steel tube needed to be short and strong. In this experiment, the diameter of the stainless steel tube was 1 cm with a length of 50 cm. At the same time, the diameter of the gas collection pipe was 0.4 cm and the length of it was 100 cm. In addition, gas concentrations at different layers were collected at different sites, in this way, the interference of the gases at different layers was reduced to the minimum. The surface of bedding was marked as 0 cm, the next layer was marked as −5 cm, the subsequent next was −10 cm and the other next layers were marked by this algorithm. Due to the bedding being hardened at the bottom, this research collected the gases through the stainless steel tube which only extended to the depth of −40 cm (the litter was also collected above the depth of −40 cm). The gases concentrations were collected three times, and the average of the three concentrations was treated as the final gas concentration. All gas concentrations in the experiment were measured by an infrared photo acoustic detection with a photo acoustic multi-gas monitor-INNOVA 1412 (LumaSense Technologies A/S, Ballerup, Denmark) equipped for simultaneous measurement of gas mixtures in accordance with ISO 6142:2001. The lower levels of detection were 5 ppm for CO2, 0.4 ppm for CH4, 0.2 ppm for NH3 and 0.03 ppm for N2O, with an accuracy rate of 95%.
Sampling collection and DNA extraction
The bedding which contained 50% sawdust, 40% rice husk, and 10% wheat stalks had been employed for 9 months. Particle size of the litter was approximately 5 mm. Litters in the system were plowed once per three months using a front-loader tractor. There were five sampling sites [Figure 1 (2)] distributed throughout the deep litter in every piggery. Near the five sampling points, a 0.5 m diameter hole was scooped out. With the same depth as the gas collection site, the litter sample collection site at different layers was 20 cm from the gas collection site and was taken by a hand-held shovel. Samples from the same layer in five sampling sites were mixed homogeneously by the four-point method and 500 g from each layer of the bedding was ultimately collected. All the bedding samples were preserved at −20°C before analyzing.
The DNA extractions were performed on 1 g of bedding samples which were washed three times by 1.5 mL phosphate-buffered saline (0.1 mmol/L, pH 7.0), after that the DNA samples were centrifuged at 14,000×g. Total DNA was extracted using the same procedure as described by [10]. The purity and the concentration of DNA were detected by NanoDrop 2000 Spectrophotometer (Thermo Scientific, Boston, MA, USA). Finally, the DNA concentration was adjusted to 50 ng/μL and the OD260/280 reading of the purified DNA was tested >1.7.
PCR amplification and denaturing gradient gel electrophoresis
The V6-V8 variable region of 16S rDNA gene of bacteria in the deep litter system was amplified by PCR with primers U968-GC (CGC CCG GGG CGC GCC CCG GGC GGG GCG GGG GCA GGG GAA CGC GAA GAA CCT TAC) and L1401 (CGG TGT GTA CAA GAC CC) [11]. PCR was performed with the Premix EX Taq version 2.0 (Takara Biotechnology, Dalian, China). The PCR mixture (20 μL) contained 10 μL of Premix EX Taq, 0.3 μL of forward and reverse primers (10 pmol) and 1 μL of diluted template DNA. The reactions were amplified in a Biometra T1 thermocycler (Göttingen, Germany) using the following program: an initial denaturation step of 94°C for 5 min; followed by 35 cycles of 94°C for 10 s, 56°C for 20 s and 68°C for 40 s; and a post-elongation step of 68°C for 7 min to eliminate artifactual double bands [12]. All PCR products were analyzed by electrophoresis on 2% agarose gels containing GoldView (Solarbio, Beijing, China) to check their size and estimate their concentration using a low DNA mass ladder (Invitrogen, Carlsbad, CA, USA) and an imaging system (Gel DOC XR+, Bio-Rad, Hercules, CA, USA).
PCR amplicons were separated by DGGE using the Dcode system (Bio-Rad Laboratories, Hercules, CA, USA). Polyacrylamide gel at an 8% concentration was prepared using acrylamide/bisacrylamide 37.5:1 in 0.5×Tris-acetate-ethylenediaminetetraacetic acid (TAE) buffer (20 mmol/L Tris, 10 mmol/L acetic acid and 0.5 mmol/L EDTA) with a 38% to 48% denaturing gradient (100% denaturant is equivalent to 7 mol/L urea and 40% deionized formamide). Electrophoresis was initiated by pre-running for 10 min at 200 V and then for 12 h at 85 V in 0.5×TAE at a constant temperature of 60°C [13]. The gels were stained with AgNO3 and scanned using GS-800 Calibrated Densitometer (Bio-Rad Laboratories, Hercules, CA, USA). To normalize different gels, five clones were generated using GelComparII version 4.0 packages (Applied Maths, Kortrijk, Belgium). The clustering was done with the unweighted pair-group method using arithmetic averages (UPGMA) [14]. DGGE profiles were quantified to obtain the peak surface of each band (ni) and the sum of the peak surfaces of all bands (N). This information was used to calculate the community biodiversity using three indices: (i) the Shannon index (H) calculated with the formula H = −∑(ni/N)ln(ni/N); (ii) the dominance index (C) calculated with the formula C = ∑(ni/N)2; and (iii) the evenness index (E) calculated with the formula E = H/InS.
Real-time PCR
Real-time PCR was used to analyze the microbial diversity and quantity of the three important microbes; E. coli, Lactobacilli, and Methanogens. Three pure strains (E. coli, Lactobacilli, Methanogens-specific) DNA were provided by College of Dalian Medical University. PCR amplification and detection were performed with step one plus sequence detection system (Applied Biosystems, ABI. Inc., Foster city, CA, USA). The reaction solution (20 μL) contained 0.5 μL SYBR GREEN I (20×), 2 μL ROX (50×), 10 μL premix, 0.5 μL Primer-F, 0.5 μL Primer-R, 1.0 μL template DNA, 3.5 μL sterile water and 2 μL mg2+ (20 mM). The amplification conditions were those of the respective references shown in Table 1. The fluorescent products were detected at the last step of each cycle. A melting curve analysis was done after amplification to distinguish the targeted PCR product from the non-targeted PCR product.
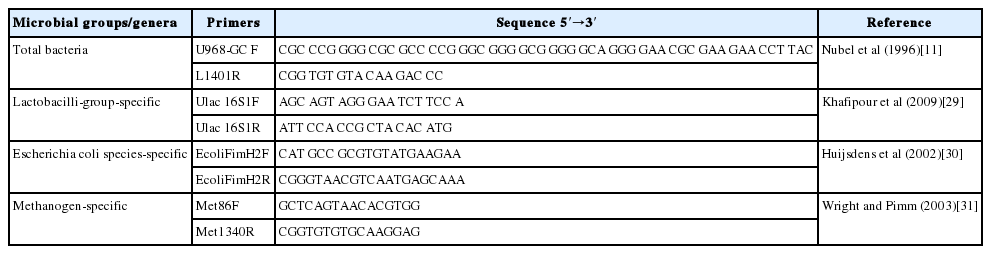
Group-/genus-specific primers used for real-time PCR in this study
Statistical analysis
Data of gases concentrations and biodiversity indices as well as quantity of E. coli, Lactobacilli, and Methanogens were analyzed by one-way analysis of variance and Duncan’s multiple range tests were used to compare differences among the three treatments. Statistical analyses were performed using IBM SPSS Statistic 20.0 (IBM, New York, USA). Less than 0.05 p values were declared significant.
RESULTS AND DISCUSSION
The distribution of CO2, CH4, N2O, and NH3 concentrations in the deep litter system
In the term of environment protection, it is suggested that a deep litter system is capable of maximizing the conversion of nitrogenous substance into small molecule substances such as nitrates and nitrites that can be absorbed by soil and minimizing the release of nitrogen containing gases such as NH3 and nitrogen oxide. As far as we know, in the decomposition processes, microorganisms produce numerous gases which could conversely affect the microbial surrounding environment of the deep litter system. Despite the significant advances in understanding gases emissions, especially greenhouse gases emissions in the deep litter system [15,16], there is a lack of understanding of the environment of this kind system. Thus, the concentrations of CO2, CH4, N2O, and NH3 at different depths were measured successively and are listed in Figure 2 in this paper.
Distributions of concentrations of CO2, CH4, N2O, and NH3 at different layers. Means with same superscripts in the same subfigure differ insignificantly (p>0.05); while with different superscripts in succession differ significantly (p<0.05); with alternative superscripts differ very significantly (p<0.01).
Figure 2(a) shows the trend of CO2 concentrations in deep litter system, which was similar with that in soil, which is, firstly rise rapidly and then the rate of increase declines [17]. In the deep litter system, the CO2 concentration was minimum at the surface of the deep litter and then it rose acutely from the 0 cm layer to the −10 cm layer. However, its increase began to slow from the −20 cm mark where the concentration had exceeded 8.0×10⁴ ppm. This result was opposite to that of Hou et al. (2016) who found that CO2 emissions increased under conditions of sufficient oxygen [18]. This difference in result occurred because CO2 emissions are not equal to the CO2 concentration. The gas emission fluxes were calculated by the following equation:
Thus, the surface layer may produce large amount of CO2 but its concentration was the lowest, possibly caused by the surface beddings being exposed to the atmosphere where the CO2 can dissipate. Along with the increasing of depth, the CO2 concentration increased. The higher CO2 concentrations are mainly attributed to the lower gas diffusivity at the deeper depths [17].
It can be observed in Figure 2(b) that the CH4 concentration was almost undetectable at the 0 cm layer, while it was acutely increased with the depth increasing from the 0 cm to the −25 cm. Beneath these depths, the CH4 concentrations increased slowly and finally reached a stabilization stage where concentration acquired its largest value. Similar with the trend of the CH4 concentration distribution at different layers in solid waste [19], the trend of CH4 in the deep litter system was to increase with depth. The reason CH4 concentrations reached a higher value at the deeper layers in waste could be due to the solid waste being compacted with low permeability materials. These materials prevented large emissions of gas to the atmosphere and created horizontal barriers within the waste that enable lateral gas migration [19]. Similarly, in this paper, the increasing CH4 concentrations along with the depth was possibly caused by the lower volatility. In addition, according to Ritzkowski et al. (2006), who reported that the formation of CH4 was suppressed and the CH4 production was reduced during in-site aeration [20]. Therefore, with the increasing of depth, an anaerobic condition gradually formed in the deep litter system. Two-thirds of N2O, a powerful greenhouse gas, emissions come from the bacterial and fungal nitrification and denitrification processes [7]. From Figure 2(c), it can be seen that the N2O concentration was at the lowest value at the surface of the beddings (namely the 0 cm layer) and increased with depth with a range from the 0 cm to the −10 cm. At the −10 cm layer, the N2O concentration reached its largest value and then it dropped with the depth to the bottom of deep litter. According to Petersen et al (2013), N2O emissions are a function of the pile depth, aeration, compost age, temperature, pH and water filled pore space [21]. In addition, Chen et al (2015) found that increasing O2 could promote N2O production, the major nitrification pathway worked near the surface and denitrification occurred under anaerobic conditions [22]. Thus, it can be seen that the nitrification pathway played a dominant role at the surface layer in the deep litter system where there was sufficient oxygen. However, due to the high volatility, the N2O concentration was the lowest at the surface. Subsequently, the air exchange rate was reduced and the rate of denitrification processes was higher with the increasing of depth. Especially, the highest N2O concentration was observed at the −10 cm depth, which was possible because the denitrification pathway was simultaneous with the nitrification pathway and this lead to higher N2O concentration. While the drop of N2O concentrations suggested that denitrification gradually played a dominant role and the anaerobic circumstance was gradually formed with the increasing of depth. N2O diffusion was restricted at the bottom of the system where N-contained gases have enough time to be deoxidized into N2.
NH3 is a major emission from the livestock and poultry industries and has a negative influence on the outdoor residential environment, as well as on the ecosystem [23]. We found that the NH3 concentration in the deep litter system was least at the surface and increased from the surface to the bottom of the beddings [shown in Figure 2(d)]. According to Guardia et al. (2008), higher aeration rates were accompanied by lower NH4+/NH3 concentrations, although that always attributed to a higher NH4+/NH3 emission [24]. NH3 concentration at the surface layers was low, while with the increasing of depth, NH3 concentrations were increased, this may be due to the active diffusion gradually decreasing.
As a whole, concentrations of CO2, CH4, and NH3 increased with the depth, which suggested that the active diffusion was gradually decreasing and an anaerobic environment gradually formed. Combined with the N2O concentrations, it suggests that nitrification plays a dominant role above the −5 cm layer where litter has a strong active diffusion and O2 was sufficient. Subsequently, nitrification and denitrification acted together at the −10 cm layer where the environment may be micro-aerobic and these two processes lead to the highest N2O concentration. Subsequently, microbial surroundings gradually became anaerobic with the increasing of depth. In summary, microbial environment in the upper layers (0 cm to −5 cm) of the deep litter system was aerobic due to high active diffusion, the middle layers (−10 cm to −20 cm) was micro-aerobic and the bottom layers (below −20 cm depth) was anaerobic. Moreover, a well deep litter system should increase the nitrification pathway and inhibit the denitrification pathway, so the upper layers were more effective and therefore, it is advisable to maintain an aerobic environment.
The distribution of bacterial diversity and expression of E. coli, Lactobacilli, and Methanogens at different layers of the deep litter system
The DGGE in its different forms is used to investigate the ecology of microorganisms in various environments, including the study of bacterial, fungal, as well as protozoal populations in the deep litter system. In this paper, DGGE was used to study bacterial diversity at various depths of the deep litter system. Figure 3 shows that the bacteria species and the bands quantity were homoplastic in the same layer of the bedding, which suggested that the experiment process in this paper had good reproducibility. As Figure 3 demonstrates, the similarity of bacterial species between the −25 cm layer and the −30 cm layer was the highest, 93%, and between the −5 cm layer and the −10 cm layer, similarity of species reached the second highest value of 87.5%. While the bacterial similarity between the −20 cm layer and other layers was the lowest, and the second lowest was found between the 0 cm layer and other layers. Overall, the bacterial similarity among the depth ranging from the −25 cm to the −40 cm was the highest, while that between the −20 cm layers and the other layers was the lowest. The biodiversity of bacterial at different depths of the bedding, as assessed by the indices of Shannon, evenness and richness calculated from the DGGE profiles, is shown in Table 2. Throughout the layers of bedding, there was a significant difference between the 0 cm layer and the −5 cm layer in the Shannon index (p<0.05) and the Shannon index at the −5 cm layer was at a peak value of 3.19. Besides, the Shannon index at depths ranging from the −5 cm to the −15 cm as well as −25 cm to the −40 cm was not significantly different. However, there was a significant difference between samples taken from the −20 cm layer and other layers (p<0.01). Meanwhile, the evenness (E) and the dominance index (C) at the −20 cm layer was significantly different with other layers (p<0.05). As a summery, the diversity associated with bacterial communities reached its highest value at the −5 cm and decreased to its lowest value at the −20 cm layer of the bedding. According to Zheng et al. (2014), the bacterial community is affected by the oxygen content during fermentation [25]. In this paper, bacterial diverisity may be affected by the active diffusion. Combined with the results of the gases concentrations distribution, the diversity at the surface layer was different from other layers, possibly because the surface litter was exposed to the atmosphere where oxygen was sufficient so that aerobic bacteria accounted for the major species. Besides, the bacterial diversity at the −5 cm depth was the highest, which may be due to active diffusion being reduced and facultative anaerobes beginning to appear. On the contrary, the bacterial diversity, the evenness as well as the dominance index demonstrated that the layer at the −20 cm depth might be a transition layer where the environment converts from the micro-aerobic to anaerobic.

Unweighted pair-group method using arithmetic averages (UPGMA) of bacterial community at different layers of the deep litter system.

Bacterial diversity indices from DGGE fingerprints of the beddings
Quantity of microbes can indirectly reflect the environment of the deep litter. Figure 4 presents the expression of E. coli, Lactobacilli, Methanogens at each depth of the beddings observed in the test. It can be observed that the numbers of E. coli reached their highest value at the surface of the beddings, which was 9.68×10⁴ cfu/g. There was a sharp decline in the quantity of E. coli at the −5 cm layer and a subsequent increase at layers ranged from the −5 cm depth to the −15 cm depth. A significant drop of the E. coli numbers at the −20 cm layer was also revealed and the difference between the −20 cm layer and the others was significant (p<0.05). Beneath the −20 cm, the numbers of E. coli increased with the depth except the −40 cm layer, where their numbers were the lowest. However, the distribution of Lactobacilli was obviously different from that of E. coli. The quantity of Lactobacilli firstly rose and then dropped. With the increasing depth, the expression of Lactobacilli approached to the largest value (6.08×10³ cfu/g) at the −15 cm layer and subsequently gradually decreased from the −20 cm depth to the −40 cm depth. In addition, there was an increasing trend in the quantity of Methanogens which increased with the depth from the 0 cm to the −25 cm and reached a peak value of 5.08×10³ cfu/g at the −35 cm layer.
Copy number/ng of Escherichia coli, Lactobacilli, Methanogens at different layers of the deep litter system. Bars show mean±standard error. The different letters show significant differences; at p<0.05.
From the above data, it was observed that the largest quantity of E. coli was on the surface layer of the beddings. This phenomenon may indicate that E. coli in the surface of the beddings mainly originate from livestock feces. There was a sharp decline at the −5 cm depth, which indicated that the deep litter system has the advantage of reducing the number of E. coli, even though the majority of the strains are nonpathogenic. Additionally, as facultative anaerobic bacteria, E. coli is able to grow aerobically and in the absence of O2 by anaerobic respiration. Thus, the number of E. coli fluctuated with the decreasing of depth ranging from the −5 cm to the −35 cm levels except at −20 cm where there appeared to be a significant decline. The trend of a sharp decline at the −20 cm layer in the quantity of E. coli was similar with that in the bacterial diversity. This phenomenon was possibly because the conditions were converting from the micro-aerobic state to the anaerobic state. As the same as E. coli, Lactobacilli are able to grow both under aerobic and anaerobic conditions [26]. As a kind of probiotics, Lactobacilli exert positive health effects by regulating the microbial communities in the intestine, vegetable residues, silage, feces and so on [27,28]. In view of their numbers, Lactobacilli were active and exerted a major influence at the layers ranging from the −5 cm to the −15 cm. However, the number of Lactobacilli descended from the −20 cm to the −40 cm level, this phenomenon may be explained by the change in the NH3 concentration. The increased concentration of NH3 with the increasing of depth led to high pH value in the litter which is not conducive to the growing of Lactobacilli. Different from the above two bacteria, Methanogens are anaerobic archaea, a large quantity of Methanogens was observed beneath the −20 cm depth, which indirectly demonstrated that beneath the −20 cm an anaerobic environment was gradually formed, at the same time, this can also indirectly reflect that above the −20 cm the microbes lived in an aerobic or microaerophilic environment.
In summary, combined with the bacterial diversity and the quantity of E. coli as well as Lactobacilli, the −20 cm layer was the transition layer where the environment converted from micro-aerobic to anaerobic. It was also found that the deep litter system has an obvious effect of inhibiting pathogenic bacteria like E. coli. The upper layers (mainly refers to the depth from the −5 cm to −15 cm) were conducive to probiotic bacterial (like Lactobacilli) populations while the bottom layers (the layers beneath the −20 cm depth) were not. Anaerobic microbes, Methanogens, were active beneath the −20 cm depth.
CONCLUSION
The bacterial diversity and concentration of gases as well as the quantities of E. coli, Lactobacilli, Methanogens in the different layers of the deep litter system, indicate that the upper layers (0 cm to −5 cm) of the system were aerobic, the middle layers (−10 cm to −20 cm) were micro-aerobic and the bottom layers (below −20 cm depth) were anaerobic. In addition, it is suggested that the management of a well-fermented deep litter system should seek to expand the aerobic layers through various ways such as turning the beddings and changing the bottom hardened litters frequently as well as ploughing the beddings.
ACKNOWLEDGMENTS
We thank Dalian Medicine University for providing us the pure strains. The research reported here was supported by the project from the committee of TaiHu Lake pollution control in China (TH2011208).
Notes
CONFLICT OF INTEREST
We certify that there is no conflict of interest with any financial organization regarding the material discussed in the manuscript.