Genetic correlations between first parity and accumulated second to last parity reproduction traits as selection aids to improve sow lifetime productivity
Article information
Abstract
Objective
The objective of this research was to estimate genetic correlations between number of piglets born alive in the first parity (NBA1), litter birth weight in the first parity (LTBW1), number of piglets weaned in the first parity (NPW1), litter weaning weight in the first parity (LTWW1), number of piglets born alive from second to last parity (NBA2+), litter birth weight from second to last parity (LTBW2+), number of piglets weaned from second to last parity (NPW2+) and litter weaning weight from second to last parity (LTWW2+), and to identify the percentages of animals (the top 10%, 25%, and 50%) for first parity and sums of second and later parity traits.
Methods
The 9,830 records consisted of 2,124 Landrace (L), 724 Yorkshire (Y), 2,650 LY, and 4,332 YL that had their first farrowing between July 1989 and December 2013. The 8-trait animal model included the fixed effects of first farrowing year-season, additive genetic group, heterosis of the sow and the litter, age at first farrowing, and days to weaning (NPW1, LTWW1, NPW2+, and LTWW2+). Random effects were animal and residual.
Results
Heritability estimates ranged from 0.08±0.02 (NBA1 and NPW1) to 0.29±0.02 (NPW2+). Genetic correlations between reproduction traits in the first parity and from second to last parity ranged from 0.17±0.08 (LTBW1 and LTBW2+) to 0.67±0.06 (LTWW1 and LTWW2+). Phenotypic correlations between reproduction traits in the first parity and from second to last parity were close to zero. Rank correlations between LTWW1 and LTWW2+ estimated breeding value tended to be higher than for other pairs of traits across all replacement percentages.
Conclusion
These rank correlations indicated that selecting boars and sows using genetic predictions for first parity reproduction traits would help improve reproduction traits in the second and later parities as well as lifetime productivity in this swine population.
INTRODUCTION
The goal of Thai commercial swine operations is high productivity and profitability while keeping costs as low as possible. In this context, efficiency of swine production becomes a key factor to the survival of swine commercial businesses. Highly productive sows are preferred and are kept longer in the production system. High sow reproductive performance would decrease culling rates and lower costs of production [1]. Conversely, poor reproductive performance increases costs of production, replacement rates, and hence replacement costs. Several reports have shown the effectiveness of selection for lifetime production traits of sows [2,3]. However, direct selection for this trait has limited usefulness in practice because records are obtained at the end of a sow’s productive life, thus it can only be used to select animals related to sows with lifetime production records. Thus, selection criteria that use traits obtained early in life that are genetically correlated to lifetime production need to be utilized as selection aids to choose replacement sows and boars as well as shorten generation interval.
If first parity reproduction traits were correlated to the reproduction traits in later parities, first parity genetic predictions could help swine producers predict subsequent reproductive performance to help with culling and selection decisions in the herd. Reproduction traits in the first and later parities would be treated as different traits because of differences in the stage of development of the reproductive system [4,5]. Reproductive performance in the first parity was shown to be associated with reproductive performance in subsequent parities [5–9], suggesting that first parity reproduction traits could be useful to help predict reproduction traits in later parities. Positive estimates of genetic correlations between number of piglets born alive (NBA) and number of piglets weaned (NPW) in the first and the later parities were estimated in the Netherlands (0.55 to 0.97 for NBA; [6], Australia (0.61 to 0.62 for NBA; [7], and Canada (0.49 to 0.93 for NBA and 0.17 to 0.81 for NPW; [9]). Similarly, positive correlations between NBA, NPW, and litter weaning weight (LTWW) in the first and later parities were found in South Korea (0.77 for NBA, 0.58 for NPW and 0.66 for LTWW; [5]). Lastly, a positive estimate of genetic correlation between total number of piglets born in the first and the sum over later parities was reported in Thailand (0.85; [8]).
Thus, the objectives of this research were: i) to estimate genetic correlations between number of piglets born alive in the first parity (NBA1), litter birth weight in the first parity (LTBW1), number of piglets weaned in the first parity (NPW1), litter weaning weight in the first parity (LTWW1), number of piglets born alive from second to last parity (NBA2+), litter birth weight from second to last parity (LTBW2+), number of piglets weaned from second to last parity (NPW2+) and litter weaning weight from second to last parity (LTWW2+), and ii) to identify the percentages of animals in common in the top 10%, 25%, and 50% using estimated breeding values (EBV) for NBA1, LTBW1, NPW1, LTWW1, NBA2+, LTWW2+, NPW2+, and LTWW2+ in a commercial swine population in Northern Thailand.
MATERIALS AND METHODS
Data, animals, matings, and traits
Data were extracted from the PigCHAMP database of a farm located in Northern Thailand. Sow reproduction records included identification number, breed group, parity, sire, dam, birth date, farrowing date, weaning date, parity number (1 to 10), number of piglets born alive, number of piglets weaned, litter weight at birth, and litter weight at weaning for each parity. The original dataset of 2,611 Landrace (L), 955 Yorkshire (Y), 3,861 LY, and 7,177 YL was edited to eliminate the records that contained missing, erroneous and incomplete information for NBA1, LTBW1, NPW1, LTWW1, NBA2+, LTBW2+, NPW2+, and LTWW2+. Sows that did not have date of birth, date of farrowing, and date of weaning, as well as gilts younger than 350 d or older than 550 d of age at first farrowing were deleted. Only sows that had complete lifetime reproduction information and farrowed for the first time between 350 d and 550 d of age were kept in the final dataset.
The edited dataset contained reproductive records from L (n = 2,124), Y (n = 724), LY (n = 2,650), and YL sows (n = 4,332) over a 24-year period (July 1989 to December 2013). Records for purebred sows were available from July 1989 to December 2013, whereas records for crossbred sows were available from November 2004 to May 2011. Purebred L and Y sows were the progeny of 640 sires (395 L and 245 Y) and 1,319 dams (895 L and 424 Y), and crossbred LY and YL sows were the progeny of 969 sires (608 L and 361 Y) and 2,674 dams (1,608 L and 1,066 Y). A total of 260 Duroc (D) boars were represented in the dataset for the three-breed terminal crosses. The mating system involved D, L, and Y. Landrace sows were mated to L boars (purebred matings) and to Y boars (F1 crossbred matings), Y sows were mated to Y boars (purebred matings), and to L boars (F1 crossbred matings), and LY and YL sows were mated to D boars only (three-breed terminal crossbred matings; all animals sent to market).
The reproduction traits considered in this research were NBA1, LTBW1, NPW1, LTWW1, NBA2+, LTBW2+, NPW2+, and LTWW2+. The NBA2+ was calculated as the sum of the number of piglets born alive from the second to the last parity. The LTBW2+ was calculated as the sum of the litter birth weights from the second to the last parity. The NPW2+ was calculated as the sum of the number of piglets weaned from the second to the last parity. The LTWW2+ was calculated as the sum of the litter weaning weights from the second to the last parity. Age at first farrowing was defined as the number of days from the birth of the sow to her first farrowing. Days to weaning was defined as the time interval from farrowing date to weaning date. Days to weaning in the first parity (DTW1) was calculated as the time interval from the first farrowing to weaning in the first parity. Days to weaning for second and later parities were calculated similarly to DTW1, and then the values were added to obtain the sum of days to weaning from the second to the last parity (DTW2). Numbers of observations, means, standard deviations, minima and maxima for all traits are shown in Table 1.
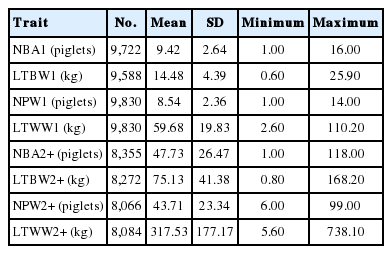
Descriptive statistics for first parity and sums from second to last parity reproduction traits
Climate, nutrition and management
The swine herd in this research was located in Chiang Mai province, Northern Thailand (latitude 18° 47′ 43″ North and longitude 98° 59′ 55″ East). The climate of the area is tropical, with average temperature ranging from 17°C to 35°C, average relative humidity ranging from 37% to 99%, and average rainfall ranging from 880 mm to 1,457 mm over the last thirteen years [10]. Seasons were defined as winter (November to February), summer (March to June), and rainy season (July to October). Gilts and sows were housed in an open-house system with water dripper, sprinkler, and fans, while boars were kept in an enclosed barn with an evaporative cooling system. Boars were fed 2.5 kg/d of feed with 16% crude protein and 3,200 to 3,500 kcal/kg. Sows received rations of different composition depending on the status of their reproductive cycle. Gilts and non-lactating sows were fed 2.5 kg/d of feed with 16% crude protein and 3,200 to 3,500 kcal/kg of energy. Nursing sows were fed 5 to 6 kg/d of feed with 17% to 18% crude protein and 4,060 kcal/kg of energy. Females were kept in individual stalls during mating and gestation, and in individual pens together with their litters during lactation. Estrus was detected twice a day using boar exposure and observation of reddening and swelling of the vulva. Gilts and sows expressing standing heat and clear reddening and swelling of the vulva were determined to be in estrus. Gilts were inseminated when they reached at least 140 kg of body weight, or they were 8 to 9 mo of age, or they had their third observed estrus. Sows were mated twice after the second observed estrus (firstly 12 hours after estrous detection and then 12 hours later). Gilts and sows were moved to farrowing pens approximately 7 d before farrowing. After weaning, sows were moved to mating stalls. Piglets were weaned when they reached 5 to 7 kg of body weight or 26 to 30 d of age.
Estimation of variance and covariance components
Variance and covariance components were estimated using multiple-trait restricted maximum likelihood (REML) procedures and were computed using an Average Information Restricted Maximum Likelihood (AI-REML) algorithm with program ASREML [11]. The eight-trait mixed analysis included all traits of the first parity (NBA1, LTBW1, NPW1, and LTWW1) and sums of second and later parity traits (NBA2+, LTBW2+, NPW2+, and LTWW2+). The mixed model for each trait contained fixed effects of contemporary group (first farrowing year-season), additive genetic group of the sow (as a function of Yorkshire fraction of sow), heterosis of the sow (as a function of the heterozygosity of the sow, i.e., the probability of having alleles of different breeds in one locus of the sow), heterosis of the litter (as a function of the heterozygosity of the litter, i.e., the probability of having alleles of different breeds in one locus of the litter), a covariate for age at first farrowing (12 to 18 mo) and a covariate for days to weaning (11 to 38 d for NPW1 and LTWW1; 12 to 455 d for NPW2+ and LTWW2+). The random effects in the mixed model were sow, boar, and residual. The eight-trait mixed model can be written in matrix notation as follows:
Where y is the vector of NBA1, LTBW1, NPW1, LTWW1, NBA2+, LTBW2+, NPW2+, and LTWW2+ records ordered by trait within sows, b is the vector of contemporary group (first farrowing year-season) effects and covariates for age at first farrowing (mo) and days to weaning (d), ga is a vector of regression additive genetic group effects (difference between Y and L as a function of Y fraction), gn is the vector of heterosis effects of the sow and the litter, aa is the vector of random animal additive genetic effects, X is an incidence matrix of 1’s and zero’s that relates sow records to elements of vector b, Zga is an incidence matrix of expected Y fractions of sows that relates sow records to elements of vector ga, Zgn is an incidence matrix of heterozygosities of the sow and the litter that relates sow records to elements of vector gn, Za is an incidence matrix 1’s and zero’s that relates sow records to elements of vector aa, and e is the vector of residual random effects. The assumptions of the eight-trait mixed animal model were:
Where Ga = G0 ⊗ A, G0 is an 8×8 matrix of additive genetic variances and covariances among NBA1, LTBW1, NPW1, LTWW1, NBA2+, LTBW2+, NPW2+ and LTWW2+, ⊗ is direct product, and A is the additive relationship matrix among all animals in the pedigree file (19,824 animals, 1,829 sires, and 4,473 dams). The pedigree file included all sows, all boars mated to L sows (L boars for purebred matings; Y boars for F1 LY crossbred matings), Y sows (Y boars for purebred matings; L boars for F1 YL crossbred matings), and LY and YL sows (mated only to D boars to produce three-breed terminal crossbred pigs for market), and all known relatives. Lastly, matrix R = R0 ⊗ I, where R0 is the covariance matrix among residuals among NBA1, LTBW1, NPW1, LTWW1, NBA2+, LTBW2+, NPW2+ and LTWW2+, and I is an identity matrix.
Estimation of genetic parameters
Estimates of variance components were used to compute heritabilities for all traits, and genetic and phenotypic correlations among NBA1, LTBW1, NPW1, LTWW1, NBA2+, LTBW2+, NPW2+, and LTWW2+. Heritabilities, genetic correlations, and phenotypic correlations were computed using the usual expressions.
Prediction of genetic values and rank correlations
Animal EBV were computed as the sum of the estimate of a group genetic effect (= regression group additive genetic effect times the Y fraction of the animal) plus their predicted random additive genetic effects. Rankings of EBV for first parity reproduction traits (NBA1, LTBW1, NPW1, and LTWW1) and sums from second to last parity traits (NBA2+, LTBW2+, NPW2+, and LTWW2+) were compared using Spearman’s rank correlation coefficients obtained with the CORR procedure of SAS [12]. Spearman rank correlations for each breed group were computed for the top 10%, 25%, and 50% of boars and for the top 10%, 25%, and 50% of sows to evaluate changes in rank correlations between pairs of traits at each replacement rate. These proportions of boars and gilts encompass the typical replacement rates suggested for boars (10%) and sows (50%) in the US [13] and Thailand [8] plus an intermediate value (25%).
RESULTS AND DISCUSSION
Fixed effects
The level of significance for all fixed effects included in the model are summarized in Table 2. First farrowing year-season effects were the only fixed effect that influenced all traits (p<0.0001). Variation in climate conditions, as well as changes in personnel, management strategies, and quality and quantity of feed during the years of the study may have been largely responsible for differences among farrowing year-seasons. Culling decisions may have also influenced fluctuations in first-farrowing year-season effects over time [14].
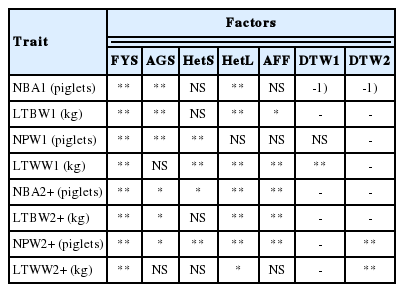
Levels of significance for factors included in the single-trait fixed model
Differences between Y and L were –0.56±0.12 piglets (p<0.0001) for NBA1, –0.83±0.20 kg (p<0.0001) for LTBW1, –0.29±0.11 piglets (p = 0.0081) for NPW1, –0.98±0.91 kg (p = 0.2802) for LTWW1, –2.78±1.36 piglets (p = 0.0414) for NBA2+, –4.73± 2.19 kg (p = 0.0308) for LTBW2+, –1.42±0.68 piglets (p = 0.0358) for NPW2+, and –9.17±6.00 kg (p = 0.1261) for LTWW2+. These breed differences indicated that purebred Y sows produced lower number of piglets born and weaned, and lighter piglets at birth in the first parity (NBA1, NPW1, LTBW1) and for the sums from the second to last parities (NBA2+, NPW2+, LTBW2+). Differences between Y and L for litter weight at weaning in the first parity and for the sum of litter weights at weaning from the second to the last parity were non-significant. Thus, under the conditions of this Thai herd, L sows performed better for reproductive traits at birth and at weaning than Y sows, but they performed similarly for litter weight at weaning.
Estimates of heterosis of the sow were 0.13±0.07 piglets (p = 0.0819) for NBA1, –0.12±0.12 kg (p = 0.3173) for LTBW1, 0.45±0.06 piglets (p<0.0001) for NPW1, 1.81±0.52 kg (p = 0.0005) for LTWW1, 1.70±0.77 piglets (p = 0.0278) for NBA2+, 0.80± 1.26 kg (p = 0.5222) for LTBW2+, 1.37±0.38 piglets (p = 0.0004) for NPW2+, and –1.40±3.40 kg (p = 0.6818) for LTWW2+. Thus, heterosis of the sow increased number of piglets and litter weight at weaning in the first parity and the sums of number of piglets born alive and weaned from the second to the last parity. This indicated that, under the conditions of this Thai herd, LY and YL crossbred sows were superior to the average of purebred L and Y sows for number of piglets and litter weight at weaning in the first parity, and number of piglets born alive and weaned from the second to the last parity. This outcome agreed with the positive estimates of heterosis of the sow for NPW1 (1.54±0.18 piglets for YL and 1.59±0.16 piglets for LY) and LTWW1 (15.27±1.17 kg for YL and 15.57±1.00 kg for LY) obtained previously in a swine population in Central Thailand [15].
Estimates of heterosis of the litter were positive and mostly significant for number of piglets in the first parity and for sums from the second to the last parity. Heterosis estimates were 0.03±0.00 piglets (p<0.0001) for NBA1, 0.00±0.01 piglets (p = 0.6527) for NPW1, 0.31±0.02 piglets (p<0.0001) for NBA2+, and 0.12±0.01 piglets (p<0.0001) for NPW2+. Conversely, estimates of heterosis of the litter were mostly negative and significant for litter weights in the first parity and for sums from the second to the last parity. Heterosis estimates were negative for LTBW1 (–0.01±0.00 kg; p = 0.0001), LTWW1 (–1.00±0.08 kg; p<0.0001), and LTWW2+ (–0.17±0.08 kg; p = 0.0232), and positive for LTBW2+ (0.07±0.03 kg; p = 0.0088). Thus, heterosis of the litter increased the number of piglets and decreased litter weight in the first parity and for the sums of the second to last parities, but it had no significant effect on number of piglets at weaning in the first parity.
Gilts that began to farrow at older ages had heavier first parity litters at birth (LTBW1 = 0.02±0.01 kg/mo; p = 0.0155) and at weaning (LTWW1 = 0.19±0.04 kg/mo; p<0.0001), but lower sums of numbers of piglets born alive (NBA2+ = –0.40±0.06 piglets/mo; p<0.0001) and weaned (NPW2+ = –0.18±0.03 piglets/mo; p<0.0001), and lighter sums of litter weights at birth from the second to the last parity (LTBW2+ = –0.36±0.10 kg/mo; p = 0.0003). Polish researchers also found that NBA1 tended to increase as age at first farrowing increased in Landrace [3]. Similarly, Thai researchers found that NBA1 increased as age at first mating increased in Landrace sows [16]. Also in agreement with these results, sums of reproduction traits from the second to the last parity or lifetime production traits were found to decrease as age at first farrowing increased in Landrace (Sweeden; [17]), Yorkshire (Findland; [18]) and in commercial swine herds (Mexico; [19]).
The average number of days to weaning was 26 d (minimum = 11 d; maximum = 38 d). The average number of days to weaning in this Thai population (26 d) was within the range of optimal days to weaning (21 d to 28 d) reported for various swine populations [20,21]. Larger number of days to weaning increased the sum of number of piglets weaned from the second to the last parity (NPW2+ = 0.19±0.00 piglets/d; p<0.0001), but not the number of piglets for the first parity. Conversely, larger number of days to weaning increased both litter weight in the first parity (LTWW1 = 0.93±0.08 kg/d; p<0.0001) and the sum of litter weights from the second to the last parity (LTWW2+ = 1.28±0.01 kg/d; p<0.0001). Longer days to weaning also increased LTWW1 and NPW2+ (p<0.05) in commercial swine farms in the United States [22]. Similarly, sows with 24 days to weaning had heavier litters at weaning in the first parity (LTWW1; p<0.05) than sows with 14 days to weaning, but this difference in days to weaning had no influence on number of piglets at weaning in the first parity in Canadian commercial herds [23].
Heritability estimates
Additive genetic, environmental and phenotypic variances for first parity traits (NBA1, LTBW1, NPW1, LTWW1) and for sums from second to last parity traits (NBA2+, LTBW2+, NPW2+, LTWW2+) are summarized in Table 3. Heritability estimates and their standard error for first parity traits (NBA1, LTBW1, NPW1, LTWW1) and for sums from second to last parity traits (NBA2+, LTBW2+, NPW2+, LTWW2+) are presented along the diagonals in Table 4. Estimates of heritabilities for first parity traits were low. Estimates were lower for numbers of piglets at birth (0.08±0.02) and at weaning (0.08±0.02) than for litter weight at birth (0.11±0.02) and at weaning (0.15±0.02). In contrast, heritabilities for sums of numbers of piglets and litter weights at birth and at weaning from the second to the last parity were all moderate. Values ranged from 0.20±0.02 for LTBW2+ to 0.29±0.02 for NPW2+. Estimates of heritability for number of piglets born alive and number of piglets weaned in the first parity were similar to values reported for L sows in various countries (0.08±0.01 for NBA1 in The Netherlands, 6; 0.06±0.01 for NBA1 in Spain, [24]; 0.16±0.04 for NPW1 in Latvia, [25]). Higher heritability values for first parity traits were obtained by [5] in a commercial swine population in South Korea (0.25 for NBA1, 0.16 for NPW1, and 0.20 for LTWW1) and by [4] in an Iberian swine population in Spain (0.15±0.02 for NBA1). However, the estimate of heritability for NBA2+ (0.26±0.02) here was higher than the estimate for an Iberian pig population in Spain (0.12± 0.01; 4). Heritabilities for sums of other reproductive traits from the second to the last parity were unavailable in the literature.
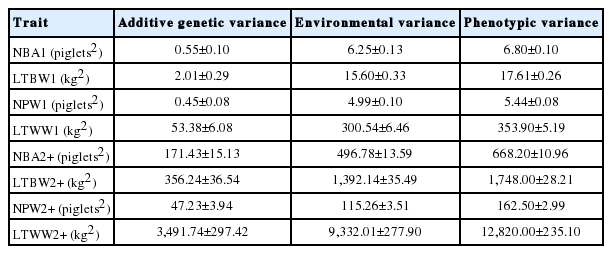
Estimates of additive genetic, environmental, and phenotypic variances for first parity and sums from second to last parity reproduction traits

Estimates of heritabilities (±SE; diagonal), phenotypic correlations (±SE; below diagonal), and genetic correlations (±SE; above diagonal) for first parity and sums from second to last parity reproduction traits
Genetic and phenotypic correlations
Estimates of genetic correlations among reproduction traits in the first parity and for sums from the second to the last parity are presented above the diagonal and phenotypic correlations below the diagonal in Table 4. Genetic correlations between the same reproduction trait in the first parity and its corresponding sum from the second to the last parity were all positive, ranging from low (0.17±0.08 between LTBW1 and LTBW2+) to moderate (0.67±0.06 between LTWW1 and LTWW2+) and had a low standard error. Phenotypic correlations between reproduction traits in the first parity and their sum from the second to the last parity were all low, with values ranging from 0.06±0.01 (NPW1 and NPW2+) to 0.13±0.01 (LTWW1 and LTWW2+).
The genetic correlation of 0.19±0.09 between NBA1 and NBA2+ here was substantially lower than the value of 0.84±0.05 obtained in Iberian swine [4]. No other genetic correlation values were available for comparison. However, there were several studies which considered reproductive traits in each parity as a separate trait. Genetic correlations in these studies ranged from 0.49 to 0.93 between NBA1 and NBA in later parities, 0.52 to 0.78 between LBW1 and LBW in later parities, 0.17 to 0.81 between NPW1 and NPW in later parities, and 0.66 between LTWW1 and LTWW in later parities [5–7,9,26]. Thus, genetic correlations between first parity and later parity traits in these studies were consistent with the genetic correlations between reproductive traits in the first parity and sums from the second to the last parity obtained here.
The positive genetic correlations between first parity and sums of second to last parity reproduction traits obtained here suggested that first parity records would help increase the accuracy of selection of sows for subsequent parity performance. This suggests that selection of replacement sows should consider using first parity reproduction traits information rather than pedigree alone when the selection objective is to increase lifetime productivity. The lower heritabilities estimated for first parity traits in this herd indicated that environmental effects had a larger proportional influence than for sums of second to last parity traits. Improvements in housing conditions, nutrition, and health care of gilts may help reduce the impact of these environmental effects on first parity reproduction traits resulting in increases in values of heritability and genetic correlations with sums of second and later parity traits, higher genetic prediction accuracies, and faster rates of selection progress for lifetime productivity.
Rank correlations
Spearman rank correlations between EBV for first parity and for sums of second to last parity reproduction traits for the top 10%, 25%, and 50% of L and Y boars are shown in Table 5. Rank correlations between L and Y boar EBV for first parity traits (NBA1, LTBW1, NPW1, and LTWW1) were positively associated with sums of second to last parity traits (NBA2+, LTBW2+, NPW2+, and LTWW2+; p<0.01), except for correlation between NBA1 and NBA2+ and between LTBW1 and LTBW2+ in the top 10% of L boars. Rank correlations tended to increase as the percentage of boars increased from the top 10% (average of 0.31 for L boars and 0.53 for Y boars) to the top 25% (average of 0.43 for L boars and 0.58 for Y boars) to the top 50% (average of 0.85 for L boars and 0.95 for Y boars). Furthermore, rank correlations between first parity and sums of second to last parity reproduction traits tended to be higher for Y than for L boars across all replacement percentages (top 10%, 25%, and 50%) indicating that replacement Y sires would be more reliably chosen than replacement L sires in this population, particularly for litter weight traits.
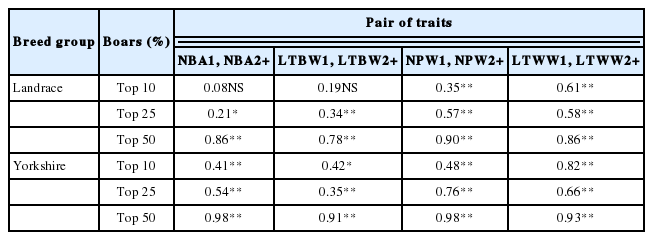
Spearman rank correlations between EBV for first parity and sums from second to last parity reproduction traits for the top 10%, 25%, and 50% of boars
Spearman rank correlations between EBV for first parity and for sums of second to last parity reproduction traits for the top 10%, 25%, and 50% of L, Y, and crossbred (LY and YL) sows are shown in Table 6. Rank correlations between first parity and sums of second to last parity reproduction traits followed the same pattern as rank correlations for boars in this population. Rank correlations between first parity and sums of second to last parity reproduction traits were higher for Y sows than for L sows, whereas rank correlations for crossbred sows were in between Y and L sows. Similarly, the top 10% of sows had the lowest rank correlations between EBV for first parity and sums of second to last parity reproduction traits (average of 0.20 for L sows, 0.32 for Y sows, and 0.27 for crossbred sows), the top 25% of sows was second (average of 0.30 for L sows, 0.33 for Y sows, and 0.28 for crossbred sows), and the highest rank correlations were those for the top 50% of sows (average of 0.49 for L sows, 0.53 for Y sows, and 0.34 for crossbred sows). This indicated that the higher replacement rate for L, Y, and crossbred sows, the lower the feasibility of choosing sows with low EBV for reproduction traits in the first parity but low EBV for sums of reproduction traits in the second and later parities.
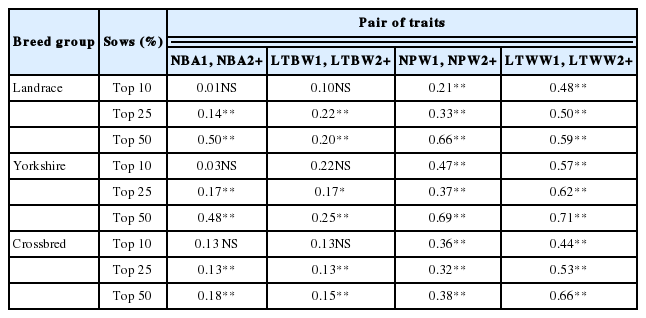
Spearman rank correlations between EBV for first parity and sums from second to last parity reproduction traits for the top 10%, 25%, and 50% of sows
Thus, although first parity reproduction information would help identify boars and sows with high EBV for sums of second to last parity, its usefulness would be lower at low replacement percentages (10%; average of 0.42 for boars and 0.26 for sows) and for litter size traits (average of 0.59 for boars, and 0.31 for sows) than at high replacement percentages (50%; average of 0.90 for boars and 0.45 for sows) and for litter weight traits (average of 0.62 for boars, and 0.37 for sows). Studies in various countries indicated replacement rates of 10% for boars and 50% for sows in commercial operations [8,13,27,28]. Considering these replacement rates (i.e., 10% for boars and 50% for sows), rank correlations in this Thai swine herd would indicate that first parity reproduction data would help identify replacement sows more accurately than replacement boars for their superiority for lifetime productivity.
Genomic information combined with phenotypic and pedigree data increased accuracy of EBV of young pigs and decreased generation interval in commercial swine resulting in faster rates of genetic progress for lifetime productivity [28–30]. It is likely that genotyping animals in this swine population with high-density chips such as the Illumina PorcineSNP60 Bead Chip would have an even larger impact on EBV accuracies and rates of genetic progress for lifetime productivity than the use of first-parity records only. Provided funding were available, it would be desirable to genotype at least a portion of this swine population to assess the impact of utilizing genotypes, pedigree, and phenotypes to select replacement animals under tropical conditions in Thailand instead of using only pedigree and phenotypes.
CONCLUSION
The genetic correlations between reproduction traits in the first parity and sums of second to last parity indicated that direct selection for first parity litter traits would help improve sums of second to last parity litter traits, and consequently also improve lifetime productivity. Higher positive rank correlations between first parity and sums of second to last parity EBV for the top 50% of sows than for the top 10% of boars indicated that first parity data would help identify replacement sows more accurately than replacement boars to improve lifetime productivity in this swine herd.
ACKNOWLEDGMENTS
The authors gratefully thank the Royal Golden Jubilee project (RGJ; PHD/0230/2553) of the Thailand Research Fund (TRF) for the financial support and the University of Florida for supporting the training of the first author as a research scholar. The authors are also grateful to the Four T Co., Ltd. for providing the data and other relevant information on the swine population used in this research.
Notes
CONFLICT OF INTEREST
We certify that there is no conflict of interest with any financial organization regarding the material discussed in the manuscript.