Performance of Broiler Chickens Fed Low Protein, Limiting Amino Acid Supplemented Diets Formulated Either on Total or Standardized Ileal Digestible Amino Acid Basis
Article information
Abstract
The aim of present experiment was to investigate the effect of protein reduction in commercial broiler chicken rations with incorporation of de-oiled rice bran (DORB) and supplementation of limiting amino acids (valine, isoleucine, and/or tryptophan) with ration formulation either on total amino acid (TAA) or standardized ileal digestible amino acids (SIDAA). The experimental design consisted of T1, TAA control; T2 and T3, 0.75% and 1.5% protein reduction by 3% and 6% DORB incorporation, respectively by replacing soybean meal with supplemental limiting amino acids to meet TAA requirement; T4, SIDAA control, T5 and T6, 0.75% and 1.5% protein reduction by DORB incorporation (3% and 6%) with supplemental limiting amino acids on SIDAA basis. A total of 360 d-old fast growing broiler chicks (Vencobb-400) were divided into 36 homogenous groups of ten chicks each, and six dietary treatments described were allocated randomly with six replications. During 42 days trial, the feed intake was significantly (p<0.05) reduced by TAA factor compared to SIDAA factor and protein factor significantly (p<0.05) reduced the feed intake at 1.5% reduction compared to normal protein group. This was observed only during pre-starter phase but not thereafter. The cumulative body weight gain (BWG) was significantly (p<0.05) reduced in TAA formulations with protein step-down of 1.5% (T3, 1,993 g) compared to control (T1, 2,067 g), while under SIDAA formulations, BWG was not affected with protein reduction of 1.5% (T6, 2,076 g) compared to T4 (2,129 g). The feed conversion ratio (FCR) was significantly (p<0.05) reduced in both TAA and SIDAA formulations with 1.5% protein step-down (T3, 1.741; T6, 1.704) compared to respective controls (T1, 1.696; T4, 1.663). The SIDAA formulation revealed significantly (p<0.05) higher BWG (2,095 g) and better FCR (1.684) compared to TAA formulation (2,028 g; 1.721). Intake of crude protein and all limiting amino acids (SID basis) was higher in SIDAA group than TAA group with resultant higher nitrogen retention (4.438 vs 4.027 g/bird/d). The nitrogen excretion was minimized with 1.5% protein reduction (1.608 g/bird) compared to normal protein group (1.794 g/bird). The serum uric acid concentration was significantly reduced in T3 (9.45 mg/dL) as compared to T4 (10.75 mg/dL). All carcass parameters were significantly (p<0.05) higher in SIDAA formulation over TAA formulation and 1.5% protein reduction significantly reduced carcass, breast and thigh yields. In conclusion, the dietary protein can be reduced by 0.75% with TAA formulation and 1.5% with SIDAA formulation through DORB incorporation and supplementation of limiting amino acids and among formulations, SIDAA formulation was better than TAA formulation.
INTRODUCTION
Protein is considered as one of the major cost components in commercial poultry feed. Reduction of dietary protein level and use of synthetic amino acid is suggested to reduce the feed cost and also to contain the environmental pollution of nitrogen (Corzo et al., 2009). For protein reduction, locally available feed ingredient such as de-oiled rice bran (DORB) can be thought of as substitute to partially replace soybean meal the costliest and widely used protein source. Piyaratne et al. (2009) used rice bran (with oil) up to 20% in broiler rations by balancing limiting amino acids. However, in this study, the limiting amino acids were not supplemented as crystalline amino acids, rather the soybean meal content was increased to balance the limiting amino acids and hence, the protein content of the diet was increased by 2.0% in the diet balanced for all limiting amino acids. Moreover, in none of the studies utilizing DORB (Das and Ghosh, 2000; Khan et al., 2002; Piyaratne et al., 2009), the protein reduction was addressed and most of the studies were conducted with a low total lysine level (<1.10%) to avoid deficiencies of other limiting amino acids, and the used lysine levels in fact were far below the recommended levels for present day fast growing commercial broilers. In this context, our previous study clearly demonstrated significant reduction of broiler performance in 6% DORB based low protein diets due to deficiencies of amino acid valine, isoleucine and tryptophan (Basavanta Kumar et al., 2015).
Feed formulation to balance amino acid viz., total amino acids (TAA), apparent/true digestible, apparent/true ileal digestible and standardized ileal digestible amino acid (SIDAA) basis were suggested and tried. Among these, formulation of diets based on SIDAA was suggested as a mean for better utilization of substitutable feed ingredients (Hoehler et al., 2006; Szczurek, 2010). However, some studies (Djouvinov et al., 2005; Mairoka et al., 2005; Ghaffari et al., 2007) did not show any advantage in feed formulation based on SID/ileal digestible amino acid basis compared to TAA basis. Keeping this concept in view, the study was undertaken to reduce protein in broiler rations by incorporation of DORB with supplementation of limiting amino acids and in addition, a comparison was made between TAA and SIDAA formulations.
MATERIALS AND METHODS
Ingredients and amino acid analysis
The feed ingredients procured were analyzed for moisture, crude protein (CP), ether extract, crude fiber (AOAC, 2005), nitrogen free extractives as difference and the amino acid composition was estimated at Evonik Laboratory. The experimental diets were formulated based on the analyzed amino acid composition of ingredients. The SIDAA profile of the experimental diets was arrived at by multiplying the amino acid profile of each raw material with digestibility coefficients suggested by Hoehler et al. (2006; Table 1), and the metabolizable energy content of the diet was estimated according to Rostagno (2011) based on the analyzed proximate composition and the reported digestibility coefficients for each nutrient from Rostagno (2011).

Ingredient amino acid profile and individual amino acids standardized ileal digestibility coefficients of ingredients employed in feed formulation
Experimental design and diets
Three levels of DORB (0, 3%, and 6%) were combined with two types of formulation (TAA or SIDAA) to yield a total of six treatments (Table 2). The TAA control diet (T1) was a typical corn-soybean meal type commercial diet and was formulated in such a way to meet the fourth limiting amino acid (valine/isoleucine) requirement solely from feed ingredients and first three limiting amino acids (methionine, lysine and threonine) were supplemented to meet TAA requirement. In T2 and T3, the protein was reduced by 0.75% and 1.5% units by replacing soybean meal with 3% and 6% DORB, respectively and all limiting amino acids were balanced with supplementation of crystalline amino acid on TAA basis to meet ideal amino acid ratio recommended by Baker (1997). Parallelly, a SIDAA cornsoy control diet (T4) was formulated to meet recommended ideal SIDAA ratio (Hoehler et al., 2006) in such a way to meet the requirement of fourth limiting amino acid (valine/isoleucine). In treatments T5 and T6, the soybean meal was replaced with 3% and 6% DORB, respectively and both treatments were formulated to meet SIDAA requirement with supplementation of crystalline amino acids. In order to have a reasonable comparison between TAA and SIDAA formulated groups, all the diets were made iso-caloric and the SID lysine content of TAA control (T1) was considered as a basal level for SIDAA based control (T4). The other limiting amino acids levels were maintained to meet minimum ideal amino acid ratio recommended either for TAA or SIDAA. The diets were formulated using Microsoft Excel based program. All diets were fed in mash form during pre-starter (0 to 14 days), starter (15 to 28 days) and finisher (29 to 42 days) phases. The ingredient and nutrient composition of the experimental diets is presented in Table 2, and the amino acid composition of the experimental diets is presented in Table 3.
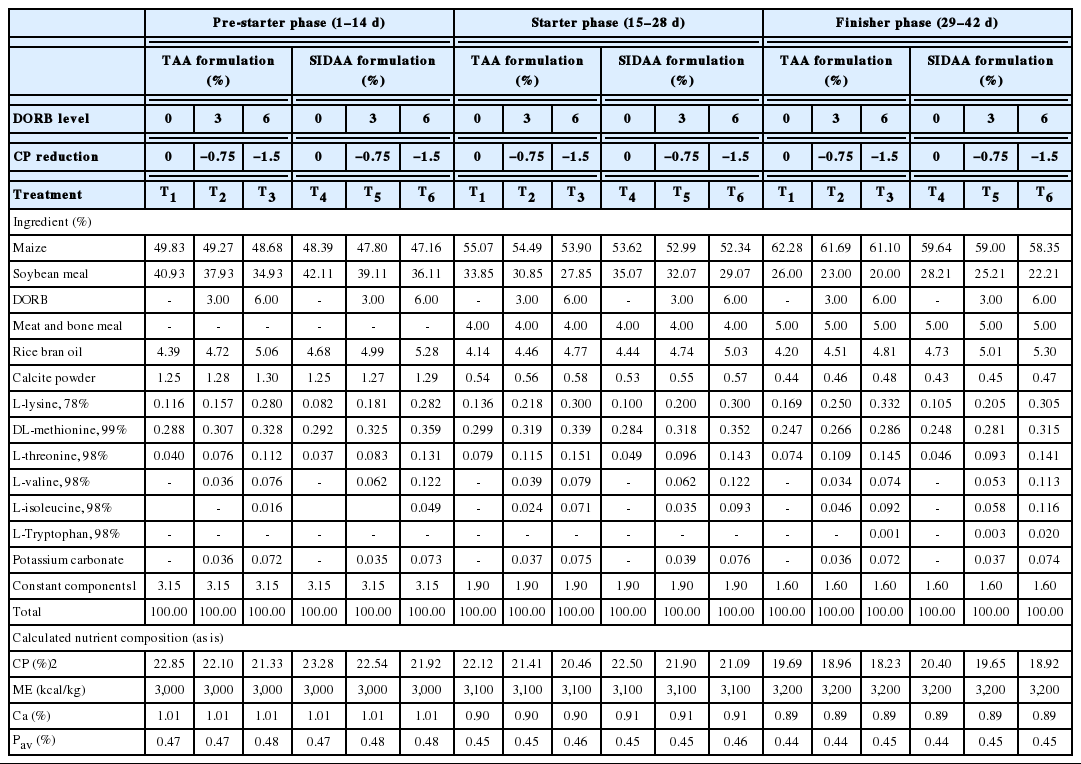
Ingredient composition (%, as is) of the experimental diets at pre-starter, starter and finisher phases

The total and standardized ileal digestible amino acid composition of experimental diets (%, as is) at pre-starter, starter and finisher phases
Experimental birds
The present experiment was carried out after approval for use of chicks and experimental procedures by Institutional Animal Ethics Committee under the guidelines of Committee for the Purpose of Control and Supervision of Experiments on Animals (CPCSEA), Ministry of Environment, Forests and Climate Change, Government of India. A total of 360 one d-old straight run fast growing commercial broiler chicks (Vencobb-400) were divided into thirty six homogenous groups with ten chicks in each pen. The six experimental diets were randomly allocated to six pens each and each pen was considered as one replicate unit. All the chicks were reared under deep litter system in conventional open ventilated shed with standard vaccination program and uniform managemental practices throughout the 42 d period.
Parameters studied
Growth performance parameters
At weekly interval the replicate wise feed intake and body weight (BW) of individual birds were recorded. The mortality of the bird was recorded as and when occurred. The mortality corrected feed conversion ratio (FCR) was calculated as unit feed intake to the unit body weight gain (BWG) (Kumar et al., 2015).
Intake of metabolizable energy, crude protein and amino acids
Based on the feed intake, intake of metabolizable energy (ME) was calculated from the estimated value while the CP and amino acid intakes were calculated based on the analyzed CP and amino acid composition.
Serum biochemical profile
On 42nd d, blood was collected from two birds form each replicate for serum collection which was analyzed for uric acid using clinical auto-analyzer (BS-300, MINDRAY, ShenZen, China) as per the manufacture’s specifications using a standard commercial kit.
Carcass characteristics
On d 42, two birds from each replicate were randomly selected, starved over night with the provision for ad libitum water and sacrificed by cervical dislocation. The dressing percentage was calculated as the per cent of the carcass weight to the BW after removing the feathers, neck, legs and internal viscera. Weights of different cuts viz., breast, thigh, drumstick, and wing of the carcass were taken and each part was expressed as percentage of pre-slaughter BW (g/100 g).
Statistical analysis
The experimental data was statistically analyzed by two-way analysis of variance (ANOVA) with Bonferroni post test (p<0.05) to separate the factor and interaction effect and also by one-way ANOVA with Tukey’s multiple range test (p<0.05) by using GraphPad Prism (GraphPad Prism 5.01 for windows, GraphPad Software, San Diego CA, USA, www.graphpad.com).
RESULTS AND DISCUSSION
Feed intake
The feed intake (Table 4) under TAA formulation was significantly reduced with 1.5% protein reduction (6% DORB; T3) compared to TAA control (T1) despite of limiting amino acid supplementation. This was only observed during pre-starter phase. Interestingly under SIDAA treatments, such type of negation was not seen. Factorial analysis revealed significantly (p<0.05) higher feed intake in SIDAA formulation and 1.5% unit protein reduction was found to significantly reduce the feed intake compared to normal protein group (0% DORB) during pre-starter phase. The influence of dietary treatments or factors on the feed intake only during relatively younger age (<14 days) could be due to relatively under developed GIT (Batal and Parson, 2002) which undeniably resulted in poor amino acid digestibility, consequently resulting in still lesser SIDAA composition than estimated (Adedokun et al., 2008). The resultant amino acid imbalance might have severely depressed the feed intake during pre-starter phase. During rest of the phases, the feed intake remained similar among the treatments irrespective of differences in the amino acid profile of diets, which follows the “Theory of food intake and growth” proposed by Emmans (1981; 1989) which emphasizes that, birds attempt to grow at their genetic potential, for which they attempt to eat sufficient quantity feed (hence nutrient) required to grow at that rate unless and until the bulkiness of feed or the inability of birds to lose sufficient heat to environment constrains the feed intake. The non-significant pattern of feed intake observed between SIDAA and TAA formulations was also observed by Mairoka et al. (2005) and subsequently many studies also reported similar feed intake between TAA and digestible amino acid formulations (Szczurek, 2010; Nasr and Kheiri, 2012). Similar to findings of this study, non-significant effect of low protein limiting amino acid supplemented diets on the feed intake was also observed in previous studies (Narmond et al., 2008; Darsi et al., 2012).
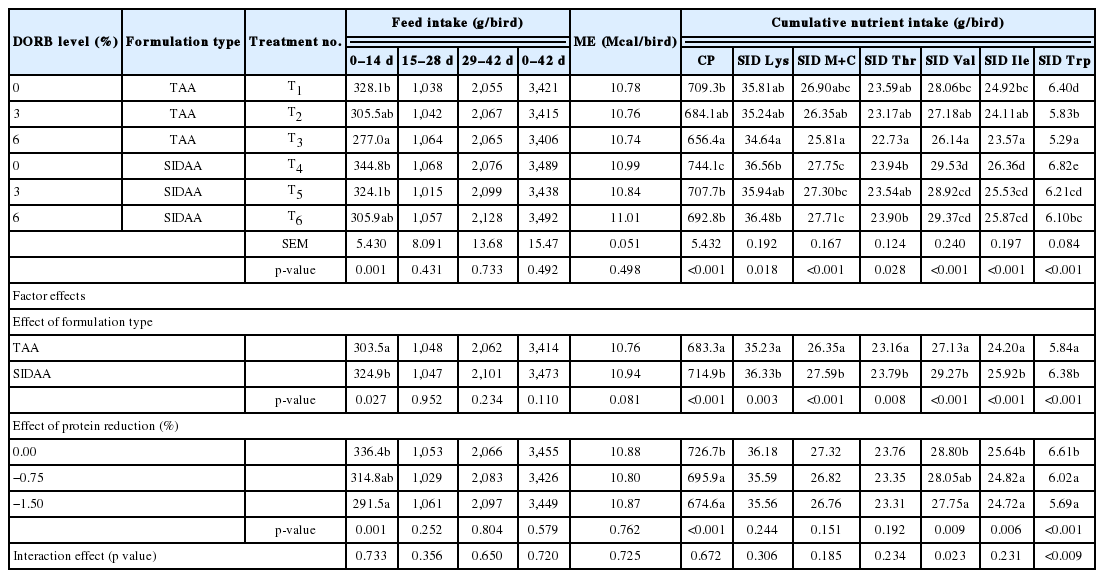
Feed intake and cumulative intake of metabolizable energy, crude protein and amino acids in broiler chicken fed DORB based low protein, limiting amino acid supplemented diets
Cumulative intake of metabolizable energy, crude protein and limiting amino acids
The cumulative intake of ME was not affected due to dietary treatments, while the CP intake (Table 4) tended to decrease (p<0.001) as the level of protein reduced by 1.5% unit (T3) in TAA formulations and by 0.75% and above in SIDAA formulated treatments compared to respective controls. Results revealed significantly higher CP intake in SIDAA formulations over TAA formulations and step down of protein by 0.75% and 1.50% units significantly reduced the CP intake vis-à-vis normal protein group. The cumulative ME intake fairly remained similar among the treatments as an indication of adoptive behavior of birds to consume feed to meet their energy requirement for growth (Emmans, 1981; 1989). The deficiency of available amino acids (SIDAA) in T2 perhaps resulted in increased feed intake to match for the limiting amino acid deficiency, which made the birds to consume similar CP as that of T1. In contrast, under SIDAA treatments, since the diets were having same SIDAA levels, the birds probably did not increase their feed intake as the bird’s amino acid requirement was met, subsequently resulting in lesser CP intake with 3% DORB inclusion itself. The higher CP intake due to SIDAA factor than TAA factor was rather a reflection of relatively higher dietary CP content in diet per-se. Inclusion of DORB to reduce CP with limiting amino acid supplementation resulted in significant reduction of CP intake both at 3% and 6% inclusions compared to no DORB group, justifying the importance of supplemental amino acids in reducing dietary protein levels (Narmond et al., 2008; Darsi et al., 2012). The significantly higher intakes of all limiting amino acids (SID basis) observed under SIDAA formulation over TAA formulation was a reflection of higher SID amino acid content in SIDAA formulations than TAA formulation. The protein factor significantly reduced the intake of SID valine with protein reduction of 1.5% units, while SID isoleucine and tryptophan intakes were significantly reduced at and above 0.75% unit protein step down compared to normal protein group. The interaction effect of main factors was noticed only for SID valine and tryptophan intakes, where the SIDAA formulation significantly improved intakes of these two amino acids for same level of protein. In spite of protein reduction, the birds were able to meet the requirement of first three limiting amino acids probably by making minor adjustment in feed intake however; this adaptation was not adequate to increase the intake of subsequent limiting amino acids (valine, isoleucine, and tryptophan).
Body weight gain
The BWG (Table 5) under 1.5% unit low protein TAA formulation (T3) was significantly (p<0.001) reduced during pre-starter and on cumulative basis compared to control (T1). In contrast, under SIDAA formulation, 1.5% protein reduction (T6) revealed significant BWG reduction vis-à-vis control (T4) only during pre-starter phase however; similar performance was evident during rest of the phases and cumulatively irrespective of protein level. The BWG under SIDAA formulated 1.5% low protein diet (T6) was comparable to TAA control (T1) during all phases and cumulatively. The results revealed significantly (p<0.05) improved BWG under SIDAA formulation over TAA formulation throughout the experimental period. The protein factor revealed a feasibility of protein reduction of 0.75% with limiting amino acid supplementation, while further protein reduction (1.5%) significantly reduced the BWG during pre-starter and on cumulative basis.
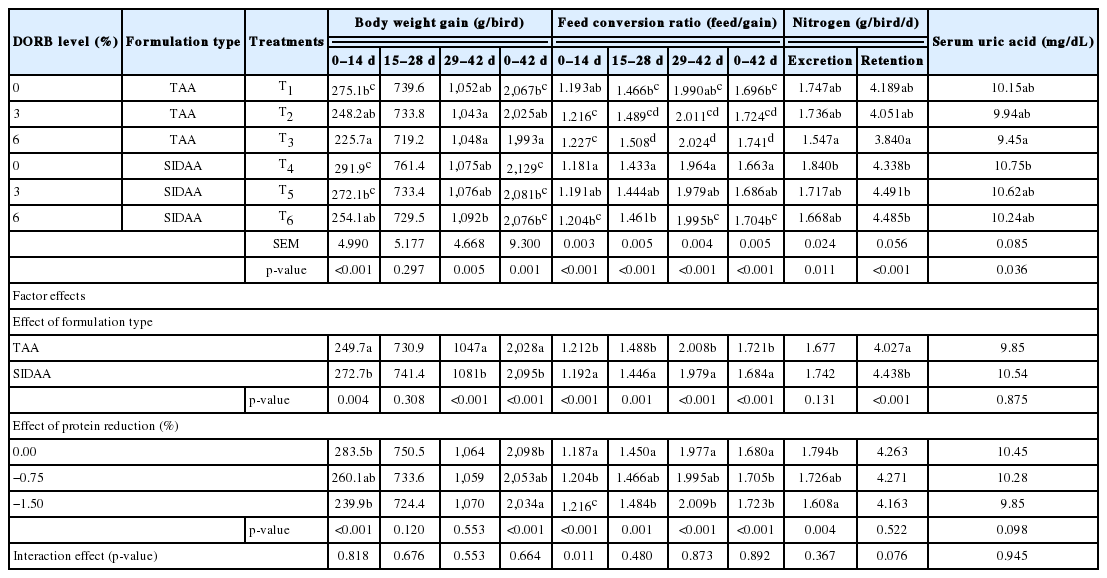
Body weight gain, feed conversion ratios, nitrogen excretion, retention (39 to 42 day) and serum uric acid levels (42nd day) of birds under different treatments
During the pre-starter phase, comparison within formulation type revealed significant growth retardation on 1.5% unit protein step down among both TAA and SIDAA based treatments which could be due to age related differences in digestibility coefficients of amino acids in ingredients (Adedokun et al., 2008). On cumulative basis, among TAA based treatments, 1.5% protein step down (T3) resulted in significant depression of BWG despite of limiting amino acid supplementation. This can be attributed to differences in amino acid content on SID basis, which inevitably resulted in significantly reduced intake of all limiting amino acids. In contrast, among SIDAA formulations, the BWG was similar to that of control (T4) despite of protein reduction. Significantly improved BWG due to SIDAA formulation type is a clear reflection of significantly higher intake of all limiting amino acids. The lower intake of lysine (3.03%), M+C (4.49%) and threonine (2.65%) to minor extent and valine (7.31%), isoleucine (6.64%) and tryptophan (8.46%) to a major extent in TAA formulation type over SIDAA type perhaps impeded protein accretion and subsequently reduced the growth performance. Among amino acid, methionine is primarily required for initiation of protein synthesis and has been revealed to influence myogenic gene expression in broilers (Wen et al., 2014) and moreover, lysine, methionine, threonine, valine and isoleucine are components of muscle protein and their deficiency invariably reduced the BWG. The growth retardation as a result of deficiency of either individual or various combinations of limiting amino acids lysine, methionine, threonine, valine, isoleucine and tryptophan is well noticed in previous studies (Corzo et al., 2009; Corzo et al., 2011; Basavanta Kumar et. al., 2015). This type of difference between TAA and DAA formulation was also reported by earlier studies (Szczurek, 2010; Nasr and Kheiri, 2012).
Feed conversion ratio
The FCR (Table 5) was influenced by six dietary treatments and both factors throughout the feeding phases and cumulatively. Among both TAA and SIDAA formulations, the FCR was found to significantly deteriorate with a protein step down of 1.5% units compared to respective controls during all phases and cumulatively. On cumulative basis, the better FCR observed in SIDAA control (T4) was significantly superior to all TAA based treatments (T1 to T3) and 1.5% low protein SIDAA treatment (T6). Factorial separation revealed significantly (p<0.001) improved FCR in SIDAA formulation over TAA formulation during all the three phases and on cumulative basis. The protein factor revealed significant deterioration of FCR with a protein reduction level of 0.75% and above during pre-starter phase and cumulatively, while during the starter and finisher phases, protein step down of 1.5% resulted in significant FCR depression compared to normal protein group (0% DORB) and protein reduction of 0.75% unit being mediocre remained similar to both normal protein group and 1.5% low protein group.
The significantly better feed efficiency noted on factorial approach under SIDAA groups can be traced back to a significantly higher intake of all limiting amino acids as described previously. The deficiencies of various amino acid viz., valine (Corzo et al., 2011), valine and isoleucine (Corzo et al., 2009) and valine, isoleucine and tryptophan on DORB based rations (Basavanta Kumar et al., 2015) have been shown to depress feed efficiency similar to present study. The protein factor with a reduction of 1.5% unit protein and supplementation of limiting amino acids resulted in significant depression of FCR at all production phases, while, 0.75% unit protein reduction significantly reduced FCR only during pre-starter phase. Our present findings contradicts previous studies (Waldroup et al., 2005; Darsi et al., 2012) which could be due to the age related differences in the SIDAA coefficients of ingredients (Adedokun et al., 2008) and due to this reason, even in spite of formulation on SIDAA basis, in reality still there might be moderate limiting amino acid deficiency and probably this deficiency was overcome by birds through slightly increasing feed intake to grow at their genetic potential (Emmans, 1981; 1989) consequently resulting in deterioration of feed efficiency despite of optimum BWG.
Nitrogen excretion, retention and serum uric acid levels
The nitrogen excretion (g/bird/d; Table 5) was significantly minimized in TAA formulated 1.5% low protein diet (T3) than highest observation of SIDAA control (T4). Formulation type had no influence on nitrogen excretion, while the dietary protein level significantly (p<0.05) minimized nitrogen excretion at 1.5% protein reduction compared to normal protein diet. On the other hand, the nitrogen retention noticed in all SIDAA formulated treatments was significantly superior to T3. This positive effect of SIDAA formulation on nitrogen retention was clearly separated on factorial analysis. The serum uric acid level was significantly reduced in TAA based 1.5% low protein diet (T3) compared to SIDAA control (T4). The serum uric acid level was significantly reduced in TAA based 1.5% low protein diet (T3) compared to SIDAA control (T4), where a protein reduction of more than 2% existed supporting the previous findings (Narmond et al., 2008; Darsi et al., 2012).
Carcass parameters
The results revealed significantly higher yields of all carcass parameters (Table 6) due to SIDAA formulation over TAA formulation. The protein factor significantly reduced the yields of carcass, breast and thigh at 1.5% protein reduction compared to normal protein group. The abdominal fat percentage was significantly lower in SIDAA formulation over TAA formulation. Similar to our present findings, previous studies also reported higher carcass and breast meat yields (Szczurek, 2010), breast and thigh yields (Khaskar and Golian, 2009) in ileal digestible amino acid formulations over TAA formulations. The abdominal fat percentage was significantly lower in SIDAA formulation over TAA formulation, which perhaps better explains diversification of energy towards protein accretion in presence of balanced SIDAA profile (Szczurek, 2010).

Carcass characteristics of birds fed low protein, limiting amino acid supplemented diets at the end of 42nd day trial
CONCLUSION
The findings of the present study revealed possibility of protein reduction in broiler diets by 1.5% units with incorporation of DORB (6%) and supplemental limiting amino acids on SIDAA formulation, while on TAA formulation only 0.75% unit protein reduction (3% DORB) was found possible. Among formulation types, SIDAA formulation was found to significantly improve broiler performance than TAA based formulation. In addition, the protein step down also minimized the nitrogen excretion and SIDAA formulation improved the nitrogen retention over TAA formulation.
ACKNOWLEDGMENTS
The authors duly acknowledge Veterinary College, KVAFSU, Bangalore, and KVAFSU, Bidar for facilitating the work, Dr. B.V. Rao Poultry Research Foundation/WPSA (IB) for providing financial assistance for project and the Department of Animal Husbandry, GOK for providing deputation facility. We also acknowledge Evonik Pte. Ltd. Singapore for analysis of amino acid composition of the feed ingredients.
Notes
CONFLICT OF INTEREST
We certify that there is no conflict of interest with any financial organization regarding the material discussed in the manuscript.