Differences in Physicochemical and Nutritional Properties of Breast and Thigh Meat from Crossbred Chickens, Commercial Broilers, and Spent Hens
Article information
Abstract
The objective of this study was to compare the physicochemical and nutritional properties of breast and thigh meat from commercial Chinese crossbred chickens (817 Crossbred chicken, 817C), imported commercial broilers (Arbor Acres broiler, AAB), and commercial spent hens (Hyline Brown, HLB). The crossbred chickens, commercial broilers and spent hens were slaughtered at their typical market ages of 45 d, 40 d, and 560 d, respectively. The results revealed that several different characteristic features for the three breeds. The meat of the 817C was darker than that of the other two genotypes. The 817C were also characterized by higher protein, lower intramuscular fat, and better texture attributes (cooking loss, pressing loss and Warner-Bratzler shear force [WBSF]) compared with AAB and HLB. The meat of the spent hens (i.e. HLB) was higher in WBSF and total collagen content than meat of the crossbred chickens and imported broilers. Furthermore, correlation analysis and principal component analysis revealed that there was a clear relationship among physicochemical properties of chicken meats. With regard to nutritional properties, it was found that 817C and HLB exhibited higher contents of essential amino acids and essential/non-essential amino acid ratios. In addition, 817C were noted to have highest content of microelements whereas AAB have highest content of potassium. Besides, 817C birds had particularly higher proportions of desirable fatty acids, essential fatty acids, polyunsaturated/saturated and (18:0+18:1)/16:0 ratios. The present study also revealed that there were significant differences on breast meat and thigh meat for the physicochemical and nutritional properties, regardless of chicken breeds. In conclusion, meat of crossbred chickens has some unique features and exhibited more advantages over commercial broilers and spent hens. Therefore, the current investigation would provide valuable information for the chicken meat product processing, and influence the consumption of different chicken meat.
INTRODUCTION
In recent years, with the rapid economic growth and globalization of the food industry, increasing attention has been paid to the production and consumption of chicken meat. Chicken meat is rich in proteins, amino acids, carbohydrates, polyunsaturated fatty acids (PUFA), minerals, and low in fat, which is considered as one of the most desirable meats all over the world (Kamboh and Zhu, 2013). Due to the balanced nutritional components, regular dietary intake of chicken meat has been suggested to reduce the incidence of many diseases and exert a beneficial effect on human health (Jayasena et al., 2013). Furthermore, the price of chicken meat is much cheaper than red meat (such as beef, lamb and pork meat), which also widely promote the production and consumption of chicken meat (Jayasena et al., 2013). Liu et al. (2012) reported that per capita consumption of chicken meat has increased approximately five folds during the last four decades in Korea.
Consumer acceptance and processing functionality of meat depends on its quality, which is influenced by a series of factors such as genetics, age, body weight, and other environmental conditions (Jung et al., 2011). Genetics has been considered as the major factor that influence meat quality of chickens in previous studies (Zhao et al., 2011). In general, nutrition value and physicochemical properties have been noted as the most crucial aspects in consumer perception of meat and meat products. Nutrition value is of great concern, but the physicochemical properties of meat, which include water holding capacity, shear force and color, are also important elements for meat processing and consumer acceptance. In China, three main commercial chicken breeds, namely, introduced broilers, spent hens and crossbred of the broiler with the layer stocks, are widely raised. The introduced commercial broiler grown only for 40 d or so, and has become the main meat-type chicken in Chinese markets, which is mainly devoted to the fast-food industry for rotisserie-type products. The crosses (about 30% of Chinese consumption) are also popular for their higher growing rate and feed efficiency (Tang et al., 2009). The spent hens, another potential source of chicken meat, are old (80–100 weeks old) birds that are characterized by an objectionable toughness of meat because of high amounts of heat-stable collagen (Kang et al., 2009).
During the past decades, many studies on meat quality of the chicken breeds have mainly focused on carcass characteristics, color or water-holding capacity (Tang et al., 2009; Zhao et al., 2011). However, little information is available on the nutritional properties (i.e., amino acids composition, fatty acid composition, and mineral composition) of different types of chicken meat (Rikimaru and Takahashi, 2010; Franco et al., 2012). Furthermore, there are few studies on the meat physicochemical characteristics and nutritional values of some commercial spent hens and Chinese crossbred breeds, and their unique taste and nutritional value in comparison with those of broilers have not evaluated clearly via scientific analyses. Thus, the aim of the present work was to compare physicochemical and nutritional properties among Chinese crossbred chickens, commercial broilers and spent hens (i.e., 817 Crossbred chicken, Arbor Acres broiler and Hyline brown, which are widely raised in China), and the difference of these properties between breast and thigh meat were also assessed. The results could give indications as to which breeds should be used for which situation, eventually resulting in a promotion of the production of meat, and influence the consumption of different chicken meat products.
MATERIALS AND METHODS
Animals and meat sampling
Chickens of the three breeds, including 817 Crossbred chicken (817C), Arbor Acres broiler (AAB) and Hyline brown (HLB) were used. 817 Crossbred chicken (mixed-sex and with live weigh 1.3–1.5 kg), a commercial Chinese cross strain favored by the Chinese customers for the juicy texture and quick growth, was bred from commercial broiler and spent hen by the Institute of Poultry Science, Shandong Academy of Agricultural Sciences (Jinan, China); Arbor Acres broiler (mixed-sex and approximately 2.2–2.5 Kg live weigh), a standard commercial broiler, selected for meat production, are well known for quick growth; Hyline Brown (HLB), a standard commercial spent hen (live weigh 1.8–2.0 Kg), usually become available for further processed products at the end of egg laying cycle. All three chicken breeds were obtained from the holding area of a commercial plant and every breed reared in one flock under identical conditions without any discernible differences regarding nutrition or management. The diets of the three chicken breeds were the same and contained approximately 20% crude protein, 4% crude fiber and 3,050 kcal/kg of metabolic energy, which is a typical commercial feed for chickens (Wellhope Feed Co., Shanghai, China). The diets and water were provided for ad libitum intake. Birds were slaughtered at typical market ages: 817C at 45 d old, AAB at 40 d old and HLB at 560 d old.
Experimental animals of all three breeds (20 birds per breed, respectively) were slaughtered by conventional neck cut, bled for 2 min, defeater, and eviscerated. The breast (pectoralis major) and thigh (biceps femoris) muscles from the left and right sides of carcasses were dissected after chilling at 4°C for 24 h. Then, they were trimmed of visible skin, excess fat and connective tissues. All procedures were approved by the Animal Care and Use Committee of the Food Science College of Nanjing Agricultural University. The right side of breast and thigh meat were vacuum-packed and stored at 4°C until analyzed for cooking loss, pressing loss, color, and Warner-Bratzler shear force values within 2 d. The remaining half of each bird was minced separately, and then they were vacuum-packed and stored in a freezer at −20°C until further analysis of nutritional properties.
Physicochemical analysis
Proximate analysis
The minced breast and thigh meat samples which have not contained skin were employed to determine their proximate composition according to the Standard procedures of the Association of Official Analytical Chemists (AOAC, 2003).
Color measurements
Color parameters (L*, relative lightness; a*, relative redness; b*, relative yellowness) was assessed on the fresh surface of meat samples using a colorimeter (CR-400, Minolta Camera Co., Osaka, Japan). Color coordinates (L*, a*, b*) were recorded using the average value of ten repeated measurements taken from different locations on the meat surface.
Determination of total and soluble collagen content
The total collagen content of each sample was determined according to hydroxyproline method as described by Kong et al. (2008) with some modifications. Briefly, the sample (100 mg) was hydrolyzed with 25 mL of HCl at 110°C for 18 h. Then the hydrolysate was clarified with activated carbon, filtered, neutralized with 10 M NaOH, and diluted with distilled water to a final volume of 250 mL. The amount of hydroxyproline was determined by a spectrophotometer (DU 530, Beckman Instruments Inc., Fullerton, CA, USA) at 550 nm wavelength. Total collagen concentration (mg of collagen per g of meat) was calculated, assuming that collagen weighed 7.25 times the measured hydroxyproline value. Soluble collagen was extracted according to the method of Wattanachant et al. (2004). The collagen solubility was expressed as the percentage of the soluble collagen compared to total collagen.
Cooking loss and pressing loss determination
The cooking loss of the sample was determined according to the method of Li et al. (2012) previously reported. Cooking loss was calculated as the difference in sample weight before and after cooking, and expressed as a percentage of the initial sample weight.
Pressing loss was measured according to the method of Li et al. (2012) by using a compression machine (YYW-2, Nanjing Soil Instrument, Nanjing, Jiangsu, China). Pressing loss was calculated as a percentage of weight loss based on measurements before and after compression of meat, and expressed as a percentage of the original weight of the sample.
Warner-Bratzler shear force measurements
Warner-Bratzler shear force (WBSF) measurement was determined in triplicate on the same sample used for cooking loss determinations (Li et al., 2012). Three slices (1×1×3 cm) from each cooked sample were removed from each chicken meat parallel to the muscle fiber orientation. A single, peak shear force measurement was obtained for each core using a Warner-Bratzler meat shear machine (Salter 235, Manhattan KS, USA) and an average shear force (WBSF) was calculated and recorded for each muscle. A larger value indicated greater shear force and therefore, tougher meat.
Nutritional value analysis
Amino acid composition
Amino acid content in the freeze-dried meat samples was determined based on previously reported methods (Li et al., 2011). The amino acids were determined in triplicate using the Amino Acid Analyzer (L-8900, HITACHI, Tokyo, Japan), and results were presented gram of amino acids per 100 gram of freeze-dried meat samples (g/100 g).
Fatty acid profile
Fatty acid composition was analyzed by the original method of Jung et al. (2010). Fatty acid composition was analyzed by a gas chromatograph (GC-2010, Shimadzu, Tokyo, Japan) and a 100-m capillary column (SP 2560, Supelco, Bellefonte, PA, USA) with a split ratio of 100:1. The temperature programme as follows: The ramped oven temperature was 140°C for 2 min, and increased to 225°C at 5°C/min and maintained for 45 min; the inlet temperature was 240°C and the detector temperature 240°C. The injection volume was 1 μL and the carrier gas was nitrogen. The fatty acid methyl esters (FAMEs) were identified by comparing the retention times to those of a standard FAME mixture (Supelco 37 Component FAME mix, Sigma, Bellefonte, PA, USA).
Mineral composition
Mineral elements content in the samples were analyzed as described previously by Abid et al. (2014). All samples were analyzed in triplicates by inductively coupled plasma optical emission spectrometer (ICP-OES, OPTIMATM 2100 DV, Perkin Elmer Inc., Shelton, CT, USA). The proper standards for each mineral element were made within the concentration range of mineral elements contained in the sample. Gas flow parameters of the ICP-OES included plasma of 15 L/min, auxiliary of 0.2 L/min and nebulizer of 0.8 L/min. The following chemical elements were determined in the prepared solutions: phosphorus, potassium, calcium, sodium, aluminium, copper, iron, magnesium, zinc, manganese and selenium.
Statistical analysis
Experimental results were expressed as means±standard deviation of triplicate determinations. The data were analyzed by one-way analysis of variance. Tests of significant differences were determined by Duncan’s multiple range tests at p = 0.05 or independent sample T- test (p = 0.05). A two-tailed Pearson’s correlation coefficient was conducted to determine the correlations among variables. Principal component analyses (PCA) was carried out with the proximate compositions and physicochemical date using the PRIN-COMP procedure of the SPSS software. Statistical analyses were performed using the SPSS version 17.0 (SPSS Inc., Chicago, IL, USA) software package for Windows.
RESULTS AND DISCUSSION
Proximate composition and collagen characteristics
The proximate compositions of breast meat and thigh meat from 817C, AAB and HLB are presented in Table 1. It was found that chicken breeds had an obvious effect on proximate compositions of meat. For breast meat, the moisture, ash, intramuscular fat (IMF) and protein content of different chicken breeds was in the range of 74.42 to 74.93, 1.11 to 1.40, 1.12 to 2.03, and 20.46 to 22.37 g/100 g, respectively. For thigh meat, the moisture, ash, IMF and protein content of variant chicken breeds was in the range of 74.46 to 76.62, 0.96 to 0.97, 3.12 to 3.89 and 18.17 to 19.46 g/100 g, respectively. In addition, Table 1 also showed that the protein content in the breast meat was significantly higher (p<0.05) than that in the thigh meat regardless of chicken breeds. Besides, for the three types of chicken, 817C and HLB showed higher protein contents than AAB regardless of the meat portions. As shown in Table 1, the content of IMF in breast, contrary to the content of protein, was lower than in thigh. Similar results were also reported in Huda et al. (2011) for duck meat and Jaturasitha et al. (2008) for chicken meat. Additionally, 817C exhibited the lowest values of IMF for both meat portions. Similar results have also been observed by Jayasena et al. (2013) that native broilers had a lower fat content in both meat portions than commercial broilers. Jung et al. (2011) stated that the relatively low fat content of the native chicken meat probably due to the unique compositional characteristics. According to the proximate analysis, one can unequivocally state that the 817C represent a good source of protein and possesses lower fat content.
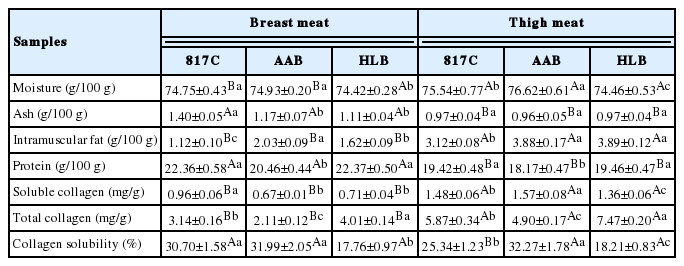
Proximate composition and collagen characteristics of breast meat and thigh meat from 817 crossbred chicken (817C), Arbor Acres broiler (AAB) and Hyline brown (HLB)
Collagen content plays a role in the overall tenderness of muscle, and Jaturasitha et al. (2008) demonstrated that the tenderness of meat was negatively correlated with collagen content. As shown in Table 1, it was obvious noted that soluble collagen, total collagen and collagen solubility of thigh meat were higher (p<0.05) than that in breast meat regardless of chicken breeds except for the collagen solubility of 817C. Furthermore, it was also found that soluble collagen, total collagen and collagen solubility of 817C, AAB and HLB exhibited significantly difference (p<0.05) regardless of the meat portions. Especially, the HLB showed the highest total collagen of breast meat and thigh meat, which were 4.01 and 7.47 mg/g, respectively, whereas the HLB also exhibited the lowest collagen solubility in both meat portions. Differences in the collagen characteristics among the three breeds could be attributed to differences in the age of the birds at slaughter (Wattanachant et al., 2004). It has also been demonstrated by Foegeding et al. (1996) that the solubility of collagen decreased with increased collagen cross-linking, and cross-linking increases as an animal ages. Therefore, older HLB had higher total collagen with more highly cross-linked collagen as indicated by the less-soluble collagen content compared with younger breeds of 817C and AAB.
Color and textural properties
Color and textural parameters of breast meat and thigh meat from different breeds are shown in Table 2. Muscle color, an important trait in chicken production, was affected by the breeds (Table 2). The 817C chicken had significantly higher a* and b* values (p<0.05) than AAB and HLB for breast meat. In addition, the thigh meat of 817C showed largest L* and b* values. Therefore, the 817C chicken was significantly more red and yellow than the AAB broiler and HLB layer. Generally, native breeds have darker meat than improved breeds (Wattanachant et al., 2004; Jayasena et al., 2013). In addition, according to Hoffman et al. (2009), meat color was also associated with the concentration of haem pigments present in the muscle, especially myoglobin.
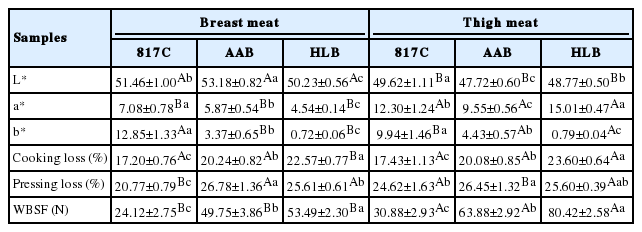
Evolution of color and textural properties of breast meat and thigh meat from 817 crossbred chicken (817C), Arbor Acres broiler (AAB) and Hyline brown (HLB)
As shown in Table 2, the cooking loss and WBSF of HLB was significant higher (p<0.05) than 817C and AAB, while 817C showed the lowest values of pressing loss, cooking loss and WBSF for both meat portions. Lower cooking loss and pressing loss of meat is beneficial because it will minimize weight loss especially during the processing of manufactured meat products. In addition, the value of WBSF in the thigh meat was significantly higher (p <0.05) than that in the breast meat for the three chicken breeds. This result was probably due to the difference in total and soluble collagen contents between the muscles. As shown in Table 1, the soluble and total collagen contents in the thigh meat was higher than the breast regardless of the chicken breeds whereas the corresponding WBSF value in thigh meat was higher. The correlation analysis obtained in Table 3 also supported that total collagen content significantly (r = 0.503) correlated with WBSF. In addition, cooking loss and WBSF is also highly correlated (r = 0.820) showed in Table 3.
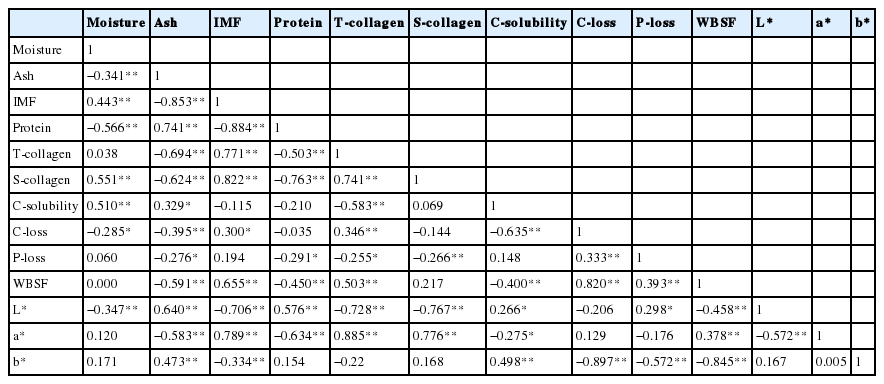
Pearson’s correlation coefficient between proximate composition, collagen characteristics, color and textural properties of chicken meat
Principal component analysis for the quality characteristics of chicken meats
PCA was conducted to provide an easy visualization of the relationships among proximate compositions (moisture, ash, IMF, protein), collagen characteristics (total collagen, soluble collagen, collagen solubility), color properties (L*, a*, b*), cooking loss, pressing loss and WBSF of chicken meats. Results for PCA applied to parameter values are summarized in Figure 1. Three principal components were extracted from statistical analysis, which explained 87.29% of the total variance in the dataset. The remaining principal components, which accounted for a very small proportion of total variability, were probably ineffective. The loadings in the PCA loading plot expressed not only how well the principal components were correlated with the original variables, but also how correlated variables were explained by the same PC and less correlated variables were explained by different PC (Xiao et al., 2014). As shown in Figure 1, soluble collagen, a*, lipid, total collagen, cooking loss and WBSF were found to be similarly loaded on PC1, which indicated positive correlations among soluble collagen, a*, lipid, total collagen, cooking loss and WBSF. In addition, the correlation results among the a*, total collagen, cooking loss and WBSF were similar to the conclusions drawn from the correlation analysis (Table 3), which suggested that total collagen content, cooking loss significantly correlated with WBSF. Thus, PCA could be helpful to provide valuable information on relationships among proximate composition, collagen characteristics, color properties, cooking loss, pressing loss and WBSF of chicken meats.

Principal component analysis (PCA) loading plot of moisture, ash, lipid (intramuscular fat), protein, L*, a*, b*, total collagen, soluble collagen, collagen solubility, cooking loss, pressing loss and Warner-Bratzler shear force (WBSF) measurement of chicken meat.
Amino acid composition
The amino acid profiles of breast meat and thigh meat from 817C, AAB, and HLB are depicted in Table 4. In the present study, it was found that types of chicken showed significant differences (p<0.05) in their amino acids contents with the exception of arginine, methionine and tyrosine in breast. When compared the indices of meat portions, the breast showed higher (p<0.05) overall amino acids contents and the essential amino acid/non-essential ratios (E/NE) than thigh meat, except for several individual amino acids in the non-essential fraction.
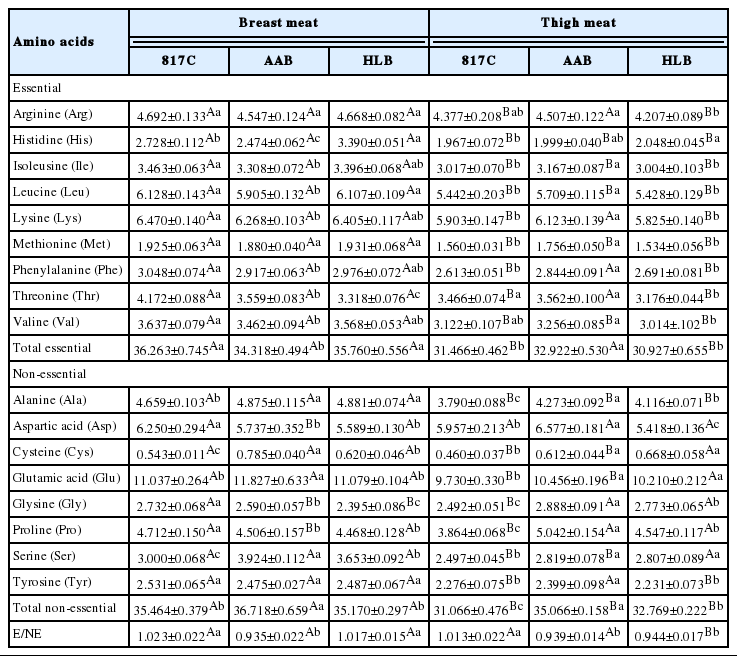
Amino acids composition of breast meat and thigh meat (g/100 g dry weight) from 817 crossbred chicken (817C), Arbor Acres broiler (AAB) and Hyline brown (HLB)
In the essential fraction, the predominant amino acids were lysine and leucine among all groups. It was noted that the leucine presented significantly higher (p<0.05) values in breast meat of 817C and HLB compared to AAB. In addition, the lysine content of 817C also showed significantly higher value than AAB in breast meat. The contents of lysine (values over 5.82 g/100 g dry weight) and leucine (values over 5.43 g/100 g dry weight) observed in current study were higher than those obtained by Wattanachant et al. (2004) from Thai indigenous and broiler chicken. Regarding total essential amino acids, significant differences were found among all three groups for both meat portions. 817C and HLB contained relatively higher total essential amino acids content than AAB in breast meat. On the other hand, glutamic acid were the most abundant amino acid found in the non-essential fraction, followed by aspartic acid, proline and alanine, while the lowest values were reported for cysteine. In comparison to other red meats such as eland and cattle (Bartoň et al., 2014) and in white meats such as rooster (Franco et al., 2012) or goose meat (Geldenhuys et al., 2015), glutamic and aspartic acid in the non-essential fraction and lysine and leucine in the essential fraction were also the major amino acids. Furthermore, for the E/NE, the mean values of the three chicken breeds in the present study were much higher than those obtained by Wattanachant et al. (2004) and Franco et al. (2012) reported. In addition, as shown in Table 4, the relatively higher E/NE values were recorded in 817C and HLB for breast meat and in 817C for thigh meat, whereas AAB recorded the lowest values for both meat portions. Therefore, the results indicated that types of chicken affected the amino acid composition considerably. Similar observation was also reported in previous studies. Zhao et al. (2011) demonstrated that the lysine content significantly differed between 120 d old native chicken and 42 d old commercial broiler. Moreover, Watanabe et al. (2014) also stated that the levels of amino acids in meat were influenced by the slaughter age. Therefore, the difference may be due to these chicken breeds were slaughtered at different market ages. Considering the human requirements (g/100 g per d) of amino acids listed in the World Health Organization’s report (WHO, 2007), 817C and HLB would be a valuable source of these essential amino acids.
Fatty acid composition
The fatty acid profiles of breast meat and thigh meat from the three types of chicken are summarized in Table 5. The major fatty acids observed in the chicken meat from 817C, AAB, and HLB were oleic (C18:1), palmitic (C16:0) and linoleic acids (C18:2), as expected. They accounted for approximately 80% of total fatty acids, in line with the results reported by previous studies (Franco et al., 2012; Jayasena et al., 2013). In general, the chicken breeds had a remarkable effect (p<0.05) on all individual fatty acids in both meat portions except for stearic acid (C18:0) in thigh meats.

Fatty acid composition (g/100 g of total fatty acids) of breast meat and thigh meat from 817 crossbred chicken (817C), Arbor Acres broiler (AAB) and Hyline brown (HLB)
In regard to the total saturated fatty acids (SFA) of breast meat, 817C showed significantly lower values (40.345%) in comparison to AAB and HLB, while there were no significant differences (p>0.05) in the thigh meat between the three breeds. Amongst the fatty acids profile of meats, the high levels of unsaturated fatty acids (FAs) are usually associated to poultry, and unsaturated FAs are considered to be beneficial to human health (Matitaputty et al., 2015). Within the monounsaturated fatty acids (MUFA) group, the 817C had greater level of oleic acid (C18:1) than the other two breeds in breast, whereas in thigh meat it was noted that AAB showed higher levels of oleic acid. Within the n-6 PUFA group, a tendency of linoleic acid (C18:2n-6) to be higher in both breast and thigh meat of HLB was noted, in accordance with the results of Contreras-Castillo et al. (2008). Another observation, that the n-3 FAs, especially eicosapentaenoic acid and docosahexaenoic acid (DHA), as a typical FA in marine fish (Chauton et al., 2015), were also detected in chickens in spite of the very minor amount.
To assess the nutritional value and consumer health of IMF, the total desirable fatty acids (DFA), total essential fatty acids (EFA), PUFA/SFA, as well as 18:0+18:1/16:0 were determined. Previous studies reported that EFA and DFA have an important role regarding to biological activity. In the present study, the proportion of DFA (18:0+MUFA+PUFA) in the IMF of breast and thigh of the three breeds ranged from 65.15% to 69.83%, 70.23% to 72.25%, respectively, within the range demonstrated by Rikimaru and Takahashi (2010). Additionally, meat from 817C chickens had higher amounts (p<0.05) of DFA than the muscles from the other chicken groups. EFA are very important for humans because they cannot be synthesized in the body and must be obtained through the dietary supplement (Jayasena et al., 2013), thus the higher EFA contents of 817C and HLB (Table 5) can be an attractive nutritional quality trait for health-conscious consumers. The ratios of PUFA/SFA are known to be important factors influencing cardiovascular disease (Yousefi et al., 2012). In the present study, 817 had more favorable PUFA/SFA ratios than AAB in breast meat, but no difference found in thigh meat for these two chicken breeds. On the other hand, Banskalieva et al. (2000) suggested that the 18:0+18:1/16:0 could be useful in describing the potential health effects of different types of lipids. In the current study 817C also had more desirable 18:0+18:1/16:0 ratios in both meat portions. Overall, these results indicate that 817C chickens have more DFA composition to human compared to those from the old HLB and AAB.
Mineral composition
The mineral composition of breast meat and thigh meat from 817C, AAB, and HLB are indicated in Table 6. In the present study, potassium occurred in the highest concentration, followed by phosphorous. This finding is similar to the results of Majewska et al. (2009) who also reported that potassium and phosphorous were the predominant minerals in chicken and ostrich meat. The potassium content was significantly higher (p<0.05) in AAB chicken than the other breeds studied in both portions. It has always been noted that vegetables, fruits and milk are the main sources of potassium in the diet. However, the present results indicated that 100 g of AAB chicken breast meat, would provide nearly 24% of the required potassium in the diet (minimum requirement is 1,500 mg/d).
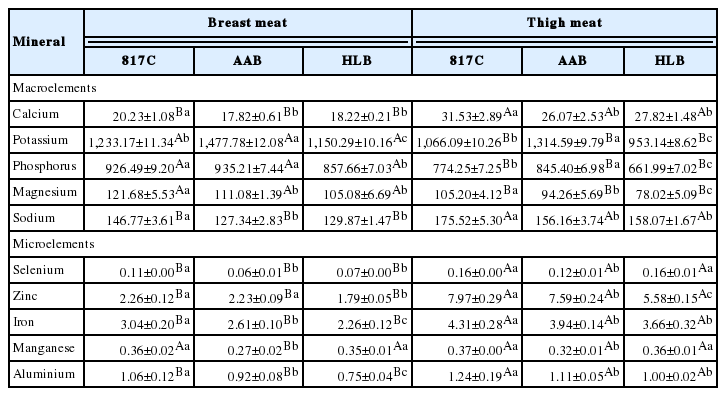
Mineral composition (mg/100 g dry weight) of breast meat and thigh meat from 817 crossbred chicken (817C), Arbor Acres broiler (AAB) and Hyline brown (HLB)
The microelements detected in this study were selenium, zinc, iron, manganese and aluminium. Similar to amino acid and fatty acid compositions, minor minerals was also found to vary with the different types of chicken investigated, and 817C exhibited the highest amounts of minor minerals in both breast and thigh meat portions. Meat is a major source of iron and zinc, it is well known that the levels of total iron and zinc in the meat is of great importance, because of regular dietary intake of these minor minerals has been suggested to reduce the incidence of many diseases and exert a beneficial effect on human health (Lombardi-Boccia et al., 2005). Furthermore, the levels of iron in 817C chicken meat were higher than that found in chicken and turkey reported by Lombardi-Boccia et al. (2005). Therefore, 817C showed the highest levels of minor minerals, and thus it can be considered as the best nutritional contribution to microelements requirements of human dietary.
CONCLUSION
The results from this study demonstrated that the physicochemical characteristics differed among breeds. At the typical market age, the 45-d-old 817C was preferable to the 40-d-old AAB broiler and 560-d-old HLB layer due to its lower fat, higher protein and the better color and texture properties (lower values of cooking loss, pressing loss and WBSF), which would meet the preference of those consumers looking for chicken meat in this niche market. Furthermore, there was a clear relationship among proximate composition, collagen characteristics, color and texture attributes of chicken meat by Pearson’s correlation analysis and PCA. In light of a health point of view, the crossbred chickens (i.e. 817C) seem superior than the other two breeds for the higher E/NE ratios, microelements content as well as the more desirable fatty acid profile (both meat portions). In conclusion, meat of crossbred chickens was judged to have better physicochemical characteristics and nutritional properties than imported broilers and spent hens. Therefore, the results from this study will provide valuable information for the meat product processing, and as well as can help consumers who prefer premium chicken meat.
ACKNOWLEDGMENTS
This research was funded by the Special Fund for Agro-Scientific Research in the Public Interest (201303083-2), the Innovation Platform Fund of Strategic New Industry (2014 Platform 030008), and the Special Fund for Science and Technology Plan Program of Northern Jiangsu Province, China (BN2015072).
Notes
CONFLICT OF INTEREST
We certify that there is no conflict of interest with any financial organization regarding the material discussed in the manuscript.