Bioavailability of Phosphorus in Two Cultivars of Pea for Broiler Chicks
Article information
Abstract
The aim was to determine the relative bioavailability of phosphorus (P) in peas for 21-day old broiler chickens using slope-ratio assay. One hundred and sixty eight male Ross 308 broiler chicks were divided into 42 groups 4 balanced for body weight and fed 7 diets in a completely randomized design (6 groups/diet) from day 1 to 21 of age. The diets were a corn-soybean meal basal diet, and the corn-soybean meal basal diet to which monosodium phosphate, brown- or yellow-seeded pea was added at the expense of cornstarch to supply 0.5% or 1% total phosphorus. Monosodium phosphate was included as a reference, and hence the estimated bioavailability of P in pea cultivars was relative to that in the monosodium phosphate. Birds and feed were weighed weekly and on d 21 they were killed to obtain tibia. The brown-seeded pea contained 23.4% crude protein, 0.47% P, whereas the yellow-seeded pea contained 24.3% crude protein and 0.38% P. Increasing dietary P supply improved (p<0.05) chick body weight gain and tibia ash and bone density. The estimated relative bioavailability of p values for brown- and yellow-seeded peas obtained using final body weight, average daily gain, tibia ash, and bone mineral density were 31.5% and 36.2%, 35.6% and 37.3%, 23.0% and 5.60%, and 40.3% and 30.3%, respectively. The estimated relative bioavailability of p values for brown- and yellow-seeded peas did not differ within each of the response criteria measured in this study. In conclusion, the relative bioavailability of P in pea did not differ depending on the cultivar (brown- vs yellow-seed). However, the relative bioavailability of P in pea may vary depending on the response criterion used to measure the bioavailability.
INTRODUCTION
About three quarters of phosphorus (P) in most plant feed ingredients is in the form of phytate P which is poorly utilized by poultry (Ravindran et al., 1995b). Consequently, poultry diets are routinely supplemented with inorganic sources of P to meet requirements (NRC, 1994). This practice not only adds considerably to the cost of poultry diets but also increases the risk of environmental pollution due to excess P excretion, especially under conditions of intensive production (Honeyman, 1993). Therefore, it is critical that poultry diets are formulated to accurately match supply with requirements.
Field pea can be utilized in poultry diets as a source of protein and energy. Brenes et al. (1993) reported that inclusion levels up to 48% raw field pea can be used as an alternative protein and energy source to replace soybean meal and corn in broiler chicken diets. Similarly, Thacker et al. (2013) reported that pea can be incorporated at levels as high as 30% in diets fed to broiler chicks with no negative effects on performance. At such high inclusion levels and considering the relatively high levels of P in pea, utilizing pea in poultry diets can make a significant contribution to total phosphorus content. However, information on bioavailability of P in pea for broiler chickens is scarce. Therefore, the objective of the current experiment was to determine the bioavailability of P in brown and yellow cultivars of peas by broiler chicks.
MATERIALS AND METHODS
The experimental protocol was reviewed and approved by the Animal Care Protocol Management and Review Committee of the University of Manitoba and birds were cared for according to the guidelines of the Canadian Council on Animal Care (CCAC, 2009).
One hundred and sixty-eight 1-d old male broiler chicks were used in the present study. On d 1, birds were weighed and divided based on body weight (BW) into 42 uniform groups each with 4 birds. The birds (Ross 308, Aviagen) were obtained from a local hatchery (Carlton Hatchery, Grunthal, MB, Canada) and were housed in Petersime battery brooders (Petersime Incubator Co., Gettysburg, OH, USA) in a room with continuous fluorescent lighting. Room temperature was maintained at 32°C, 28°C, and 24°C during wk 1, 2, and 3, respectively. The control diet was based on a corn and soybean meal and was formulated to meet or exceed the nutrient requirements (Table 1).
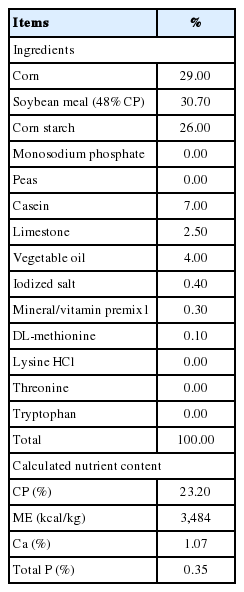
Composition of the basal diet
Six replicate cages were randomly assigned to one of 7 dietary treatments for a 21-d period. The 7 dietary treatments consisted of three reference diets formulated by adding 0, 0.5, and 1.0 g/kg total P from monosodium phosphate (MSP; that contained 24% total P) to a corn-soybean meal basal diet and by adding 0.5 and 1.0 g/kg total P from either brown- (that contained 0.47% total P) or yellow-seeded (that contained 0.38% total P) pea to the basal diet at the expense of cornstarch. Birds had free access to feed and water throughout the study period.
Growth performance and bone measurements
Birds were weighed on d 1, 7, 14, and 21 to calculate BW gain and feed intake was measured on d 7, 14, and 21 to calculate average daily feed intake. The two measurements were used to calculate feed conversion ratio. On the last day of the experiment (day 22), two birds were randomly selected from each cage and killed by cervical dislocation. Left and right tibiae were excised, placed in sealed plastic bags, and stored frozen at −20°C until subsequent analysis of tibia ash and bone mineral density, respectively.
The tibiae were de-fleshed after autoclaving at 121°C for 1 min. Tibia for determination of tibia ash were dried in an oven at 45°C for 2 d. They were then fat-extracted using hexane for 2 d, dried in a fume hood for 2 d to allow the hexane to evaporate and ashed at 550°C in a muffle furnace for 12 h. Bone mineral density was estimated from the right tibia using a dual energy x-ray absorptiometry x-ray densitometer (GE Healthcare, Lunar Prodigy Advance PA+130472, Small Animal Software, Diegem, Belgium).
Chemical analysis
Feed and pea samples were finely ground through a 1-mm screen in a Thomas Wiley Mill (Thomas model 4 Wiley Mill; Thomas Scientific, Swedesboro, NJ, USA) and thoroughly mixed before analysis. All analyses were performed in duplicates. Analyses for dry matter (DM) in feed and pea samples were carried out according to AOAC (1990; method 934.01). Ingredients and feed samples for Ca and P analysis were ashed at 600°C for 12 h, digested according to AOAC (1990; method 985.01) procedures and read on a Varian Inductively Coupled Plasma Mass Spectrometer (Varian Inc., Palo Alto, CA, USA). Crude protein (N×6.25) was determined using a Leco NS 2000 Nitrogen analyzer (LECO Corporation, St. Joseph, MI, USA). Gross energy was measured using a Parr adiabatic oxygen bomb calorimeter (Parr Instrument co., Moline, IL, USA).
Statistical analysis
Data were subjected to analysis of variance as a completely randomized design using the general linear models (GLM) procedure of SAS (SAS Institute, Inc. Cary, NC, USA). The cage was the experimental unit for growth performance variables and the 2 birds per cage for bone variables. Linear and quadratic contrasts were used to examine the relationship between growth performance response criteria or bone measurements and supplemental P from MSP, brown-seeded pea or yellow-seeded pea. Relative bioavailability of P in brown- and yellow-seeded pea was estimated using the slope-ratio technique (Finney 1978). The validity of the following 3 assumptions of the slope-ratio technique were first tested as described by Littell et al. (1997) using Proc GLM of SAS: the linearity and lack of curvature of response curve for each nutrient source, the equality of intercepts of the two regression lines, and the equality of the common-intercept and the ‘zero level’ of the basal treatment mean. Multiple regression analyses were then conducted using Proc GLM of SAS as outlined by Littell et al. (1997) to estimate the relative bioavailability of P in brown- and yellow-seeded pea.
RESULTS AND DISCUSSION
The analyzed composition of the two types of field pea tested in the present study is shown in Table 2. The crude protein, Ca and P contents were 23.35% and 24.26%, 0.07% and 0.12%, and 0.47% and 0.38%, respectively, for the brown- and yellow-seeded peas. These values are within the range of values reported for field pea for these nutrients (Hickling, 2003; NRC, 2012). Ravindran et al. (2010) reported the P content in five pea cultivars to range from 0.38% to 0.53%, with an average value of 0.45%, which is comparable with the values reported in the current study. Earlier, Igbasan et al. (1997) reported the P content in 12 pea cultivars to range from 2.9 to 5.6 g/kg DM with an average of 4.3±0.88 g/kg DM.
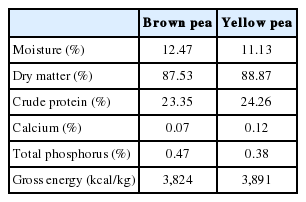
Proximate composition of brown- and yellow-seeded pea
The growth performance of broiler chicks fed diets with increasing P content from MSP, brown- and yellow-seeded is shown in Table 3. The final BW was linearly increased (p<0.001) with the addition of P from all three sources, although the performance of birds fed the diet with 0.5% additional P from yellow-seeded pea was not different from that of chicks fed the control diet. Feed intake and feed conversion ratio responses followed the same trend as weight gain (Table 3). These observations are consistent with those of Sands et al. (2003) showing a linear increase in performance of broiler chicks fed diets with increasing P content from MSP and low phytate soybean meal. Increasing supplemental P from pea from 0.5% to 1.0% increased growth responses but such improvements were not significant, except for average daily feed intake for the brown-seeded pea, which was significantly increased (p<0.05) from 25.95 to 31.72 g/bird. For all the performance response criteria, responses to P from MSP were much higher (p<0.05) compared with P from peas, which is likely a reflection of the fact that P from MSP is more readily available than P from pea. Indeed, it has been reported that P from plant-based source is of low bioavailability compared to inorganic sources such as MSP (NRC, 1994; 2012).
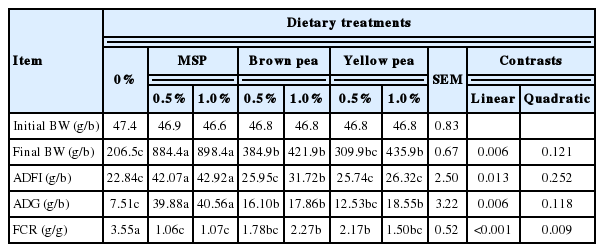
Effect of dietary treatment on performance of broilers from day 1 to day 21 of age
Tibia ash and bone mineral density of broiler chickens fed diets with increasing P from different sources are shown in Table 4. Birds fed the basal diet had a low (p<0.001) tibia ash content compared with those fed the diets with supplemental P from MSP and brown-seeded pea; values for yellow-seeded pea were similar. Tibia ash contents were not different between the birds fed the pea-containing diets. There was an increase (p<0.001) in tibia ash content as the additional P content from MSP and brown-seeded pea increased from 0% to 0.5%; no additional improvement was observed when the supplemental P content was further increased to 1.0%. The response of tibia ash content to increasing supplemental P from yellow-seeded pea was not significant (p>0.10). In the study of Sands et al. (2003), tibia ash content was shown to respond linearly to increased supplemental P from MSP and low and normal phytate soybean meal; the results of the current study are consistent with these observations. Dietary addition of P from MSP at either 0.5% or 1.0% and from pea at the 1.0% level increased (p<0.001) bone density compared with the basal diet (Table 4). Values for birds fed diets with 0.5% supplemental P from pea were not different from those of values for birds fed the basal diet.
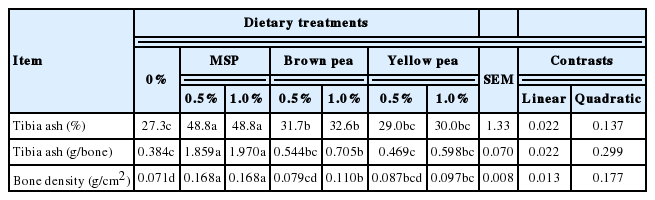
Effect of dietary treatment on bone mineralization in broilers at 21 days of age
Figures 1 to 5 shows the common-intercept multiple linear regression of average (mean±standard error) final BW daily gain (ADG), tibia ash (%), tibia ash (g) and bone mineral density on supplemental P intake in broiler chickens fed diets supplemented P from MSP, brown- and yellow-seeded pea. When using final BW as response criterion, the regression equation was Final BW = 259.35±31.58+1793.75±148.25MSP+565.22±202.67BP+64 9.30±238.83YP, R2 = 0.77; where BP and YP are brown- and yellow-seeded pea, respectively. The slope for MSP differed (p<0.0001) from that for brown-seed pea or yellow-seeded pea; however, the slope for brown-seed pea did not differ (p = 0.628) from that for yellow-seeded pea. The estimated relative bioavailability values obtained with the slope-ratio assay were 31.5% and 36.2% for BP and YP, respectively.
Common-intercept, multiple-linear regression of final body weight (FBW; g) on supplemental P intake of chicks fed diets supplemented with P from monosodium phosphate (MSP; Source 1), brown-seeded pea (BP; Source 2), and Yellow-seeded pea (YP; Source 3). The circular marker represents MSP, the plus marker represents BP, and the multiplication marker represents YB. The common-intercept, multiple-linear regression equation (mean±standard error) was Y = 259.35±31.58+1,793.75±148.25MSP+565.22±202.67BP+649.30±238.83YP, R2 = 0.77, p<0.0001; the relative bioavailabilities estimated by slope-ratio were 31.5% and 36.2% for BP and YP, respectively.
Common-intercept, multiple-linear regression of bone mineral density (mineraldensity; g/cm2) on supplemental P intake of chicks fed diets supplemented with P from monosodium phosphate (MSP; Source 1), brown-seeded pea (BP; Source 2), and Yellow-seeded pea (YP; Source 3). The circular marker represents MSP, the plus marker represents BP, and the multiplication marker represents YB. The common-intercept, multiple-linear regression equation (mean±standard error) was Y = 0.077±0.006+0.242±0.028MSP+0.097±0.039BP+0.074±0.045YP, R2 = 0.60, p<0.0001; the relative bioavailabilities estimated by slope-ratio were 40.3% and 30.3% for BP and YP, respectively.
When using ADG as response criterion, the regression equation was ADG = 8.83±1.44+89.02±7.11MSP+31.72±9.73BP+33.22±11.40YP, R2 = 0.76. The slope for MSP differed (p<0.0001) from that for brown-seed pea or yellow-seeded pea; however, the slope for brown-seed pea did not differ (p = 0.825) from that for yellow-seeded pea. The estimated relative bioavailability values obtained with the slope-ratio assay were 35.6% and 37.3% for BP and YP, respectively.
The common-intercept, multiple-linear regression equation obtained with percent tibia ash was Tibia ash (%) = 29.06±1.03+54.40±5.04MSP+12.49±6.92BP+3.05±8.09YP, R2 = 0.72. The slope for MSP differed (p<0.0001) from that for brown-seed pea or yellow-seeded pea; however, the slope for brown-seed pea did not differ (p = 0.250) from that for yellow-seeded pea. The relative bioavailabilities estimated by slope-ratio were 23.0% and 5.60% for BP and YP, respectively.
The common-intercept, multiple-linear regression equation obtained with absolute amount of tibia ash was Tibia ash (g) = 0.468±0.052+4.127±0.253MSP+0.757±0.347BP+0.381±0.406YP, R2 = 0.86. The slope for MSP differed (p<0.0001) from that for brown-seed pea or yellow-seeded pea; however, the slope for brown-seed pea did not differ (p = 0.246) from that for yellow-seeded pea. The relative bioavailabilities estimated by slope-ratio were 18.3% and 9.23% for BP and YP, respectively.
The common-intercept, multiple-linear regression equation obtained with bone mineral density (BMD) was BMD = 0.077±0.006+0.242±0.028MSP+0.097±0.039BP+0.074±0.045YP, R2 = 0.60. The slope for MSP differed (p<0.0001) from that for brown-seed pea or yellow-seeded pea; however, the slope for brown-seed pea did not differ (p = 0.596) from that for yellow-seeded pea. The relative bioavailabilities estimated by slope-ratio were 40.3% and 30.3% for BP and YP, respectively.
Based on the results in Figures 1 to 5, the relative bioavailability of P values for brown- and yellow-seeded peas did not differ regardless of the response criterion used to estimate the bioavailability. In the current study, the brown-seeded pea contained more P than the yellow-seeded pea. Igbasan et al. (1997) also reported greater content of tannin (which reduces nutrient digestibility) in brown-seeded pea than in yellow-seeded pea, and hence lower amino acid digestibility for the former than the latter in poultry. Thus, it appears that the differences in the composition between the 2 pea cultivars (brown vs yellow seeds) does not affect P bioavailability in pea.
We could not find any report on the bioavailability of P in pea for poultry in the literature and therefore the results of the current study cannot be compared. Tibia ash is routinely used as a sensitive criterion for assessing responses to dietary P in poultry (Ravindran et al., 1995a; Sands et al., 2003; Kim et al., 2008; Shastak et al., 2012). However, the value of P bioavailability obtained with tibia ash as response criteria was lower than the value obtained with final body weight, ADG or bone mineral density as response criterion. Also, the bioavailability of P in regular and low-phytate soybean meals for broilers estimated using tibia ash as response criterion was lower than that estimated using bone mineral density as response criterion (Sands et al., 2003). Additionally, the bioavailability of P in meat and bone meal for pigs estimated using metacarpal ash as response criterion was lower than that estimated using metacarpal strength as response criterion (Taylor et al., 2005). Thus, the relative bioavailability values can vary depending on the response criterion used. The proportion of digestible dietary P that is deposited in soft tissues of pigs ranges from 20% to 40% (Crenshaw, 2001), and it is affected by several factors including lean deposits (Baker et al., 2013). This variation in proportion of digestible dietary P that is deposited in soft tissues of pigs could partly explain the variation in relative P bioavailability values due to response criterion used.
Table 5 shows the estimates of bioavailability, total P content and bioavailable P content in the tested pea and as obtained using the three different response criteria. When averaged, the relative bioavailabilities in brown-seeded and yellow-seeded pea were 29.7% and 23.7%, respectively. Respective values for bioavailable P content were 0.14% and 0.09%.
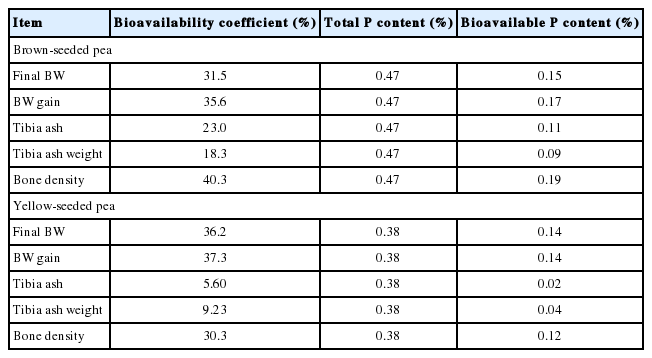
Bioavailability of P in two pea cultivars for broilers based on body weight gain, feed intake, feed conversion ratio, tibia ash and bone mineral density
In conclusion, the relative bioavailability of P in pea did not differ depending on the cultivar (brown- vs yellow-seed). However, the relative bioavailability of P in pea estimated using tibia ash as response criteria was lower than the value estimated using final body weight, ADG or bone mineral density as response criterion. Thus, relative bioavailability of P in pea may vary depending on the response criterion used to measure the bioavailability.
Common-intercept, multiple-linear regression of average daily gain (ADG; g) on supplemental P intake of chicks fed diets supplemented with P from monosodium phosphate (MSP; Source 1), brown-seeded pea (BP; Source 2), and Yellow-seeded pea (YP; Source 3). The circular marker represents MSP, the plus marker represents BP, and the multiplication marker represents YB. The common-intercept, multiple-linear regression equation (mean±standard error) was Y = 8.83±1.44+89.02±7.11MSP+31.72±9.73BP+33.22±11.40YP, R2 = 0.76, p<0.0001; the relative bioavailabilities estimated by slope-ratio were 35.6% and 37.3% for BP and YP, respectively.
Common-intercept, multiple-linear regression of relative amount of tibia ash (tibiaash; %) on supplemental P intake of chicks fed diets supplemented with P from monosodium phosphate (MSP; Source 1), brown-seeded pea (BP; Source 2), and Yellow-seeded pea (YP; Source 3). The circular marker represents MSP, the plus marker represents BP, and the multiplication marker represents YB. The common-intercept, multiple-linear regression equation (mean±standard error) was Y = 29.06±1.03+54.40±5.04MSP+12.49±6.92BP+3.05±8.09YP, R2 = 0.72, p<0.0001; the relative bioavailabilities estimated by slope-ratio were 23.0% and 5.60% for BP and YP, respectively.
Common-intercept, multiple-linear regression of absolute amount of tibia ash (tibiaash; g) on supplemental P intake of chicks fed diets supplemented with P from monosodium phosphate (MSP; Source 1), brown-seeded pea (BP; Source 2), and Yellow-seeded pea (YP; Source 3). The circular marker represents MSP, the plus marker represents BP, and the multiplication marker represents YB. The common-intercept, multiple-linear regression equation (mean±standard error) was Y = 0.468±0.052+4.127±0.253MSP+0.757±0.347BP+0.381±0.406YP, R2 = 0.86, p<0.0001; the relative bioavailabilities estimated by slope-ratio were 18.0% and 9.23% for BP and YP, respectively.
Notes
CONFLICT OF INTEREST
We certify that there is no conflict of interest with any financial organization regarding the material discussed in the manuscript.