Random Regression Models Are Suitable to Substitute the Traditional 305-Day Lactation Model in Genetic Evaluations of Holstein Cattle in Brazil
Article information
Abstract
The aim of this study was to compare two random regression models (RRM) fitted by fourth (RRM4) and fifth-order Legendre polynomials (RRM5) with a lactation model (LM) for evaluating Holstein cattle in Brazil. Two datasets with the same animals were prepared for this study. To apply test-day RRM and LMs, 262,426 test day records and 30,228 lactation records covering 305 days were prepared, respectively. The lowest values of Akaike’s information criterion, Bayesian information criterion, and estimates of the maximum of the likelihood function (−2LogL) were for RRM4. Heritability for 305-day milk yield (305MY) was 0.23 (RRM4), 0.24 (RRM5), and 0.21 (LM). Heritability, additive genetic and permanent environmental variances of test days on days in milk was from 0.16 to 0.27, from 3.76 to 6.88 and from 11.12 to 20.21, respectively. Additive genetic correlations between test days ranged from 0.20 to 0.99. Permanent environmental correlations between test days were between 0.07 and 0.99. Standard deviations of average estimated breeding values (EBVs) for 305MY from RRM4 and RRM5 were from 11% to 30% higher for bulls and around 28% higher for cows than that in LM. Rank correlations between RRM EBVs and LM EBVs were between 0.86 to 0.96 for bulls and 0.80 to 0.87 for cows. Average percentage of gain in reliability of EBVs for 305-day yield increased from 4% to 17% for bulls and from 23% to 24% for cows when reliability of EBVs from RRM models was compared to those from LM model. Random regression model fitted by fourth order Legendre polynomials is recommended for genetic evaluations of Brazilian Holstein cattle because of the higher reliability in the estimation of breeding values.
INTRODUCTION
In Brazil, the current estimation of breeding values (EBVs) of production traits for dairy bulls and cows in Brazilian selection programs is based on a 305-day lactation model (LM). This standard approach in estimating EBVs has some disadvantages when the available test day records are projected to a 305-day lactation milk yield and the projection factors assume a standard shape of the lactation curve (Sawalha et al., 2005; Bilal and Khan, 2009). On the other hand, using test day records directly has become the most used approach in genetic models designed for breeding value estimation of production traits in dairy cattle populations, replacing the traditional 305-day lactation milk yield (305MY) evaluations (Muir et al., 2007; Dzomba et al., 2010; Bignardi et al., 2011; Cobuci et al., 2011).
Random regression models (RRM) are used to fit a linear model to obtain random regression coefficients and from them the estimation of genetic parameters and the prediction of breeding values (Jamrozik and Schaeffer, 1997). Some advantages of RRM include more accuracy for accounting environmental factors that affect cows at different stages of the lactation curve and increase of the accuracy in genetic evaluations (Costa et al., 2008; Abdullahpour et al., 2010; Naranchuluum et al., 2011). In addition, RRM permit evaluation and ranking animals (cows or bulls) for each test-day by estimating a breeding value for each test day yield. These sets of breeding values define the genetic lactation curve for each animal as deviation from the average trajectory of the population (or groups of individuals), and may allow the selection of animals whose lactation curves are more persistent (Cobuci et al., 2011).
Several studies have shown that there may be divergences between breeding values estimated by LM and RRM (Lidauer et al., 2003; Melo et al., 2007) as well as between parameters obtained by fitting RRM using different covariance functions (Kim et al., 2009; Çankaya et al., 2014). Legendre polynomials (LP) have been the preferred function to fit RRM, but there is not a consensus in literature about the best order to use (Biassus et al., 2010; Çankaya et al., 2014; Aliloo et al., 2014). Canada, Italy and United Kingdom are already using a fourth or fifth order LP to fit RRM in their national genetic evaluations (Muir et al., 2007). The lack of consensus about the most suitable models enforce the importance of defining the best modeling of the covariance structure of RRM when using test day records for genetic evaluation of dairy cattle populations.
The purpose of this study was to compare genetic parameters and breeding values estimates obtained by fitting a traditional 305-day LM and random regression test day models using LP to predict breeding values for milk yield trait of Holstein cattle in Brazil.
MATERIAL AND METHODS
Data consisted of milk yield collected by the Milk Recording Services of the Brazilian Association of Holstein Breeders (ABCBRH) and its state affiliates between 1990 and 2011. The data were edited to include only records of first lactation cows between 18 and 48 months of age at calving, with full pedigree information and at least six test day records during 6 to 305 days of lactation. The records were removed from original data if 305-d lactation and test day milk yields were out of the range of 3,400 to 11,525 kg and of 9.88 to 43.45 kg, respectively.
The contemporary groups (CG) were defined by cows calving at the same herd-year-season of calving (LM) or the same herd-year-month of calving (RRM). The CG was edited to contain at least four records of cows, progeny of bulls with at least two daughters in two different herds. Four classes of age at calving (18 to 25, 26 to 27, 28 to 29, and 30 to 48 months) and four calving seasons (January through March, April through June, July through September and October through December) were combined to produce 16 age-season classes. Two datasets including the same animals, belonging to 296 herds, consisted of 30,228 lactation records totaling 262,426 test days records from daughters of 2,726 bulls were used in this study. The pedigree file included 59,486 animals.
The 305-day lactation records were analyzed by a single trait animal model (LM) including the fixed effects of herd-year-season of calving and age at calving (linear covariable) and the random additive genetic animal and residual effects in order to estimate genetic parameters and breeding values for 305MY, as follows:
where Yij is the cumulative milk yield at 305 days of animal j on herd-year-season of calving i, HYSi is the fixed effect of herd-year-season i, bn is the linear covariable for 305-day yield as a function of age at calving, xij is the age of cow at calving, in months; aij is the additive genetic effect of animal j on herd-year-season of calving i, eij is the residual effect.
The test day milk yields (TDMY) were analyzed in order to obtain genetic parameters and cumulative EBVs for 305MY using the following model:
Where yijkl is the i-th test day record of cow j made on day in milk t within herd-year-month of test (HYM) subclass l; βmk are kth fixed regression coefficient specific for the mth subclass of calving age-season classes; HYMl = fixed effect herd-year-month of testing; ujk and pejk are the kth random regression coefficients that describe, respectively, the additive genetic effects and the permanent environmental effects on cow j; ∅︀ k(DIMt) are the LP for the test day record of cow j made on day in milk t, in which k is the nth parameter of coefficient of LP of 4th and 5th orders; and eijkl is the random residual. The RRM referring to the fourth and fifth orders LP were designated as RRM4 and RRM5, respectively. Many studies in literature have pointed out these orders as recommended as well as they have already been used in Canada, Italy and United Kingdom for genetic evaluations (Muir et al., 2007).
It was assumed that:
G and P are covariance matrices of the random regression coefficients, R = Iσ2e is a diagonal matrix (residual) and ⊗ is a Kronecker product between matrices.
The LP are defined for the range of −1 to +1, thus the days in milk values were transformed as below (Kirkpatrick et al., 1994),
Where DIMmin and DIMmax are minimum and maximum values for the days in milk (DIM).
For the t-th standardized days in milk (DIM*t), the k-th polynomials is given as follows:
Where k/2 = (k−1)/2 if k is odd and m is an index number needed to determine the k-th polynomial.
Variance components, genetic parameters and EBVs for 305MY from RRM or LM models and the covariance matrices of random regression coefficients were estimated by using REMLF90 software (Misztal et al., 2014) which uses the Method of Restricted Maximum Likelihood (REML).
The EBV of animal i for test day t was calculated by:
Where α̂i is a (ka×1) vector of the estimates of additive genetic random regression coefficients specific to the animal i, and zt is a (ka×1) vector of LP coefficients evaluated at day t. An example for fifth order polynomial was presented as follow:
z′305 for fifth-order LP used under study was as follows:
The 305-day random regression breeding value of animal i was obtained by summing the EBVs from day 6 to 305 days in milk, which was illustrated for example for a fifth order LP as follows:
REMLF90 software (Misztal et al., 2014) was also used to estimate the standard error of prediction (SEP) of EBVs. The SEP was calculated as the square root of the prediction error variance. All reliabilitiy values were derived from standard errors (SE) of the EBVs, as
The models were compared according to the goodness of fit, using the values of residual variance (RV), the Akaike’s information criterion, AIC = −2logL+2 p, and Schwarz’s Bayesian information criterion, BIC = −2logL+p log (λ), where p is the number of parameters in the model. Using REML, λ = n−r(X), n being equal to the number of test day records and r(X) equal to the rank of the systematic effects incidence matrix. The model is chosen based on the lowest values of AIC and BIC. Additionally, a log-likelihood ratio test (LRT) of the likelihood was applied to test the significant differences between models with different orders of LP. The null hypothesis (H0) implied that restricted likelihood functions of the models did not differ when the number of parameters increased. The calculated value of LRT was compared to the chi-square table (x2) with ten degrees of freedom with level of significance set at 5%.
RESULTS
The goodness of fit of RRM showed lower values of estimates of the maximum of the likelihood function (−2LogL), AIC and BIC tests (Table 1) for RRM4 and lower RV for RRM5. The difference in the −2LogL between RRM4 and RRM5 tested by LRT was significant (p<0.05) by the chi-square statistic. Thus the null hypothesis of equality of RRM was rejected.

Number of parameters (p), estimates of the maximum of the likelihood function (−2 Log L), Akaike’s information criterion (AIC), Bayesian information criterion (BIC), residual value (RV), likelihood ratio test (LRT) and chi-square statistics (x2) for random regression models using Legendre polynomials
The heritability for the 305MY estimated by RRM4 and RRM5 were equal 0.23 and 0.24 and slightly higher than 0.21, the value obtained for 305MY by LM (Table 2). Additive genetic variances from RRM4 (402,908.3 kg2) and RRM5 (400,119.7 kg2) were higher than the value from LM (311,000 kg2). The estimates of heritability, additive genetic and permanent environmental variances of test day yields from 6 to 305 days in milk ranged from 0.16 to 0.27, from 3.76 to 6.88 kg2 and from 11.12 to 20.21 kg2, respectively (Figure 1).
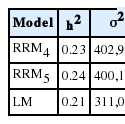
Estimates of additive genetic (σ2a), residual (σ2e) and permanent environmental (σ2pe) variance components and heritability coefficients (h2) for 305-day milk yield (305MY) estimated from LM, RRM4 and RRM5 models
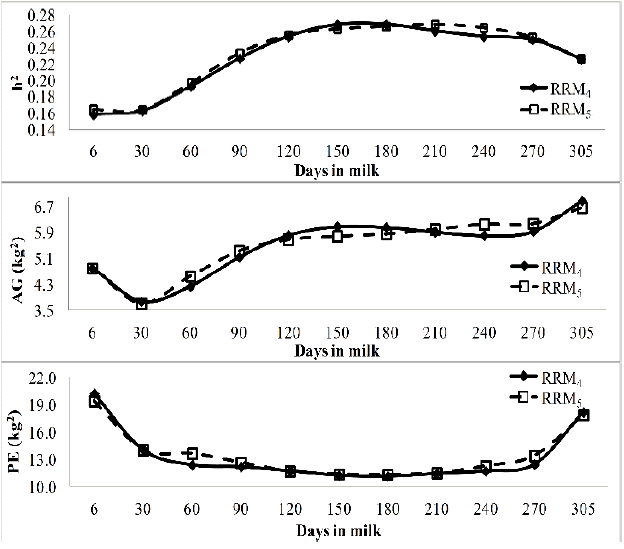
Heritability (h2), additive genetic (AG) and permanent environmental (PE) variances of test day milk yields on days in milk estimated from random regression models fitted by fourth (RRM4) and fifth (RRM5) order Legendre polynomials.
Additive genetic and permanent environmental correlations among test days along days in milk ranged from 0.20 to 0.99 and from 0.07 to 0.99 for RRM4 and RRM5, respectively (Figure 2). High additive genetic correlations were observed between adjacent test day milk yields and were close to 1 mainly during mid-lactation, but decreased with the increasing of distance between test days.
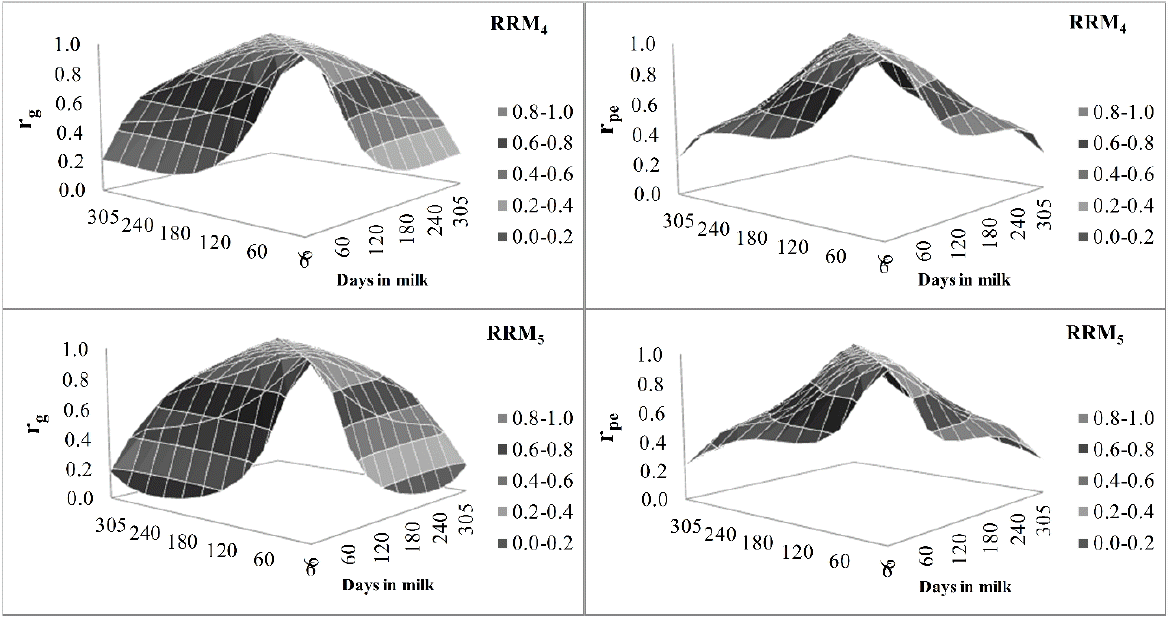
Additive genetic correlation estimates (rg; left) and permanent environmental correlation (rpe; right) between test-day milk yield along days in milk estimated from random regression models fitted by fourth (RRM4) and fifth (RRM5) order Legendre polynomials.
The standard deviations of average 305MY EBVs of bulls from RRM4 and RRM5 models increased from 11% to 31%, when progeny sizes decreased from 200 to 399 to 10 to 24 compared to those from LM (Table 3). For cows, differences between standard deviations of 305MY EBVs from RRM4 and RRM5, and those from LM ranged from 26% to 31%, depending on number of test days.

Standard deviations (kg) of EBVs for 305MY estimated by RRM4 and RRM5 models, and percentage of change (between brackets) with respect to standard deviations by LM model for bulls and cows according to progeny size and number of test days
The rank correlation between EBVs for 305MY from LM and EBVs for 305MY from RRM4 and RRM5 models for bulls increased from 0.86 to 0.95 with the increase in bulls’ progeny size (Table 4). Rank correlations were higher than 0.80 for cows and, in general, increased from 0.83 to 0.87 when the number of test days increased from 6 to 10.

Spearman rank correlation between EBVs for 305MY estimated from LM and EBVs for 305MY from RRM4 and RRM5 models for bulls and cows according to progeny size and number of test days
The rank correlations between EBVs for 305MY from LM and RRM4 and RRM5 were equal to 0.87 and 0.86 for all cows and 0.89 (for both RRM) for all bulls (Table 5). These correlation estimates decreased from 0.89 to 0.69 when proportion of selection of top bulls was 10% and decreased to 0.85 when proportion of selection was 1%. When the proportion of selection decreased from 60% to 10%, the rank correlation decreased from 0.78 to 0.57.

Spearman rank correlation (p<0.0001) between EBVs for 305MY estimated from LM and EBVs for 305MY from RRM4 and RRM5 models for bulls with progeny size higher than 49 and cows selected for 305MY
The rank of EBVs for 305MY for the ten top bulls estimated from RRM models was different for bulls S1, S2, S3, S5, S6, S7, and S10 compared to those from LM but these sires were ranked at the top ten in both models (Table 6). The largest differences in the rank of bulls were observed for bulls S4, S8, and S9, which were ranked as the 16th, 20th, and 19th by LM model. The differences between the rank of top bulls may be better depicted by means of the trajectories of EBVs of test days on days in milk for the five top bulls estimated by RRM4 (Figure 3). EBVs of test days for bull S1 estimated from RRM were higher than those estimated for bull S3 mainly between 6 and 60 and between 150 and 305 days in milk. Although S5 showed a flatter trajectory of EBVs on days in milk with higher EBVs between 6 and 120 days in milk, S4 presented higher test-day EBVs between 120 and 305 days in milk compared to S5.
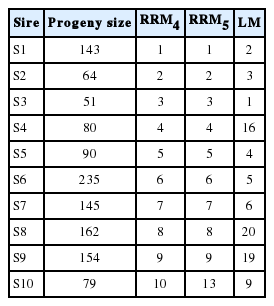
Ranks of EBVs of the ten top bulls with progeny size higher than 49 selected by EBVs for 305MY estimated from RRM4 and RRM5 and respective ranks from LM
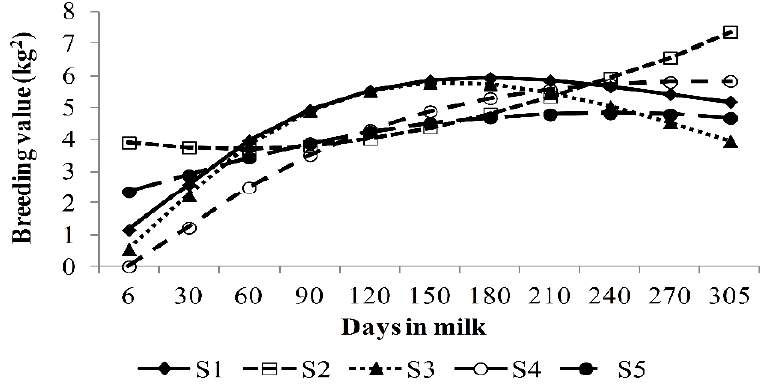
Trajectory of test day breeding values (kg2) on days in milk of five top bulls (S1 to S5) selected on breeding values for 305 day milk yield estimated from lactation model and random regression models fitted by fourth (RRM4) models.
The number of bulls evaluated by RRM4 and RRM5 models was 8% lower than the number of bulls evaluated by LM models in the class 0.30 to 0.39 of reliability of EBVs (Table 7). There was from 9% to 17% more bulls in the classes between 0.40 to 0.49 and 0.70 to 079 when RRM models were compared to LM models. The classes of reliability above 0.80 to 0.89 presented between 58% and 136% more bulls when the number of bulls estimated by RRM models was compared to the number of bulls by LM model.

Number of bulls evaluated by RRM4 and RRM5 models, and percentage of change (between brackets) with respect to the number of bulls by LM according to classes of reliability (r2) of EBVs
The average percentage of gain in reliability of EBVs for 305MY from RRM4 and RRM5 models increased in average from 4% to 17% with the decrease in bulls’ progeny size compared to the average of reliabilities estimated by LM, whose values ranged between 0.41 and 0.89 (Table 8). The gain of reliability in parentheses ranged from 8% to 33% to 1% to 13% with the decrease in progeny size. For cows, the average gain in reliability was between 23% and 24% for every class of test day. Moreover, the gain in reliability of cows of each class ranged from 11% to 49% for cows with 6 test day records to 0% to 102% for cows with 10 records.
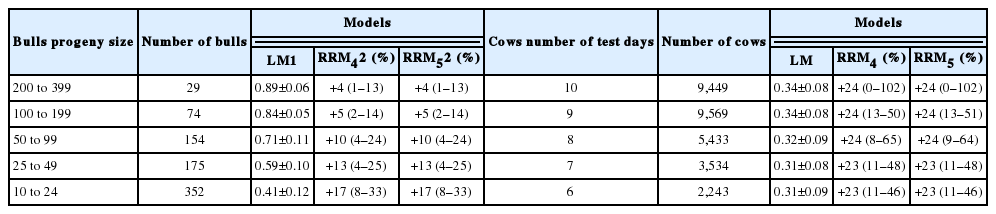
Reliabilities and their standard deviations of EBVs for 305MY estimated from LM and the percentage of gain with range in brackets by RRM4 and RRM5 models for bulls and cows according progeny size and number of test days
DISCUSSION
In a comparison between RRM4 and RRM5 models, AIC, BIC, −2LogL and LRT indicated RRM4 as the best fit of lactation curve (Table 1). In literature, models with higher orders of LP were indicated as the best fit according to AIC, BIC, −2LogL and residual values (Biassus et al., 2010; Aliloo et al., 2014). Although RV was lower for RRM5, increasing the order of polynomials did not affect breeding values and their reliabilities as well as the estimates of genetic parameters in this study.
The heritability estimates for 305MY were equal to 0.23 and 0.24 from RRM4 and RRM5 and slightly higher than 0.21 obtained by the LM model but the all values showed the same magnitude (Table 2). Additive genetic variances for 305MY estimated by RRM4 and RRM5 were about 29% higher than that in LM model. The residual value decreased about 10% when models were fitted by fourth (RRM4) and fifth (RRM5) order LP. Similarly, Biassus et al. (2010) compared models fitted by LP from third to sixth orders, which showed that the differences between RV of models decreased from 14% to 5% when the polynomial orders increased. Çankaya et al. (2014) compared models fitted from second to fourth orders and the differences between RV of models decreased from 24% to 10%. Residual variance values presented by Takma and Akbas (2009) decreased from 30% to 7% when adjusted models from second to sixth orders.
In general, heritabilities for selected test days on days in milk were higher than that estimated from LM model, except in early lactation (6, 30, and 90 days in milk) (Figure 1). Heritability estimates increased from 0.15 in the beginning up to 0.26 in mid lactation (210 days) and then decreased to 0.22 in DIM 305. Kim et al. (2009) reported higher heritability along days in milk from RRM (0.15 to 0.46) than from the LM (0.15) for Holstein cattle in Korea, which is in agreement with the present study. Araújo et al. (2006) for a population of Holstein cattle in Minas Gerais, Brazil used random regression with LP of third, fourth and fifth orders and estimated heritabilities 0.12 to 0.29 with an increasing trajectory during lactation. Costa et al. (2008) using Holstein cattle data in Brazil found heritabilities ranging from 0.27 to 0.42 with higher heritability in mid-lactation and lower at beginning and end of curves. Dorneles et al. (2009) using a RRM of fourth order estimated heritability for Holstein cattle of Rio Grande do Sul State, Brazil, which increased from 0.14 to 0.20.
The trajectory of the additive genetic variance showed a sharp decrease in the beginning of lactation and then increased for the remaining of the lactation (Figure 1). Permanent environmental variances from both RRM showed a typical U shape with higher variances at the extremes of lactation. This trend is similar to those reported by Miglior et al. (2009) in China and by Bignardi et al. (2009), Cobuci et al. (2011) and Pereira et al. (2013) in Brazil. Additionally, the low heritability at the beginning of lactation curve (6 to 60 days) was coincident with the lower additive genetic variance and higher permanent environmental variances at the same period. The higher heritability in mid lactation (90 to 270 days) coincided with the higher additive variances and the lower permanent environmental variances but at 305 days heritability decreased, genetic variance increased and permanent environmental variance increased.
As expected, higher genetic and permanent environmental correlations between adjacent test days (close to 1) and lower ones between distant DIM were observed is this study (Figure 2) and are in agreement with the pattern reported for Holstein cattle in Brazil (Dorneles et al., 2009; Bignardi et al., 2009; Cobuci et al., 2011). The lowest correlations were observed between early lactation (DIM 6) and the other test day milk yields. Except for DIM 6 and 30, in general, permanent environmental correlations were lower than the genetic correlations between DIM (Figure 2).
The standard deviations of EBVs for 305MY from RRM4 and RRM5 were higher than that estimated from LM (Table 3). When bulls’ progeny size decreased from higher classes of progeny size (200 to 299) to lower classes (10 to 24), the distribution of EBVs increased from 11% to 30% higher than that in the LM, which indicate that bulls with less information presented larger changes in distribution of EBVs around the mean promoted by RRM. For cows, the change in the standard deviation of EBVs was around 28% higher in RRM models compared to LM, considering 6, 7, 8, 9, or 10 test days by lactation. Melo et al. (2007), using data from Brazilian Holsteins, found that standard deviations of EBVs from RRM was 22% higher compared to the standard deviations from 305-day LM for cows and the differences were up to 3% for bulls with progeny size higher than 49 and up to 22% for bulls with lower progeny size. Lidauer et al. (2003) reported an increase about 9% for young bulls with at least 20 progenies and about 3% for active bulls with 60 progenies of Finnish dairy cattle. Therefore the increase in the standard deviations of mean values of EBVs suggested that estimates from RRM changed the distribution of values of EBVs of bulls and cows and consequently changed the ranking of top bulls and cows.
In Table 4, the rank correlations of EBVs of bulls for 305MY estimated from LM with ranks of EBVs from RRM4 and RRM5 models increased from 0.86 to 0.96 according to the increase of the progeny size classes, which indicate that the increase in the amount of information approximate the estimation of EBVs of LM and RRM models. On other hand, as the amount of information (progeny size) decreased, the differences in the ranks of EBVs were higher between models, which suggest, in this case, that the re-ranking of bulls was higher for bulls with less progeny size. For cows, there was a substantial difference in the correlations between RRM models and LM in general, but, according to the number of test days, these differences were similar for cows with 6, 7, 8, 9, or 10 test days. Thus these results confirm the assumption that RRM may change the ranking of top animals. These changes in ranking became more evident when a selection of bulls and cows was applied by RRM4 and RRM5 EBVs of cows and EBVs of bulls with progeny size higher than 49 (Table 5). The correlations decreased from 0.87 to 0.57 when 10% of cows were selected by RRM EBVs and increased as the proportion of selection decreased to 40% and 60% of cows. The selection of top bulls by RRM4 and RRM5 EBVs decreased the rank correlation from 0.89 to 0.70 (10% of bulls) and from 0.89 to 0.87 (1% of bulls). In order to illustrate the changes in the rankings of animals, the top ten bulls from the 10% of best bulls are shown (Table 6). Although the rank correlations between 10% of bulls were strong, the position of some bulls in relation to the other bulls may have large changes as observed for bulls S4, S8, and S9. The trajectory of test-day EBVs on days in milk may show important information to explain why the cumulative EBVs for 305MY from RRM models were higher compared to EBVs from LM, which may be observed in the trajectory of the best five bulls selected for EBVs at 305 days in Figure 3. For example, bull S3 was ranked as the first best bull by LM EBVs but it did not present the best initial EBVs compared to EBVs for S1 (6 to 60 days in milk) or the best final EBVs (150 to 305 days in milk), although the EBVs in mid-lactation (60 to 150 days) were equal. Therefore, the bull S1 was better than bull S3 in regard to the trajectories of test day EBVs because RRM models were able to estimate the test day EBVs (and cumulative EBVs for 305MY) with more precision. Consequently, the differences between the two bulls became more evident, which could not have been identified by LM.
The main advantage of RRM in comparison to LM was the reliability of EBVs of bulls and cows (Tables 7 and 8). There were a substantial increase in the number of bulls whose EBVs were classified in the classes of reliability mainly for classes above 0.70 to 0.79 (Table 7). That increase suggested that RRM may promote an important increase in the number of bulls with higher reliability. Moreover, when the classes of progeny size higher than 100 to 199 were considered, the gain in reliability was around 4% and 5%, which showed the superiority of RRM models even when the increasing in the amount of information of bulls’ progeny size were larger (Table 8). However, the gain in reliability was higher for bulls in the classes of progeny size lower than 50 to 99, whose percentage of gain in average was between 10% and 17% and whose gain in reliability in parentheses achieved from 24% to 33% compared to reliability from LM model. In relation to cows, there were no differences in the average percentage of gain in reliability with the increase in the number of test days. It may suggest that cows or bulls with daughters that presented lactations in progress (or a reduced number of test day records) may be evaluated earlier. The early genetic evaluation of animals may decrease the generation intervals, which, in turn, may increase the genetic gain, with a decrease in the costs of milk recording services for the Brazilian Holstein breeding program.
CONCLUSION
Random regression models may better explain the genetic variability of breeding values of Holsteins in Brazil and estimate these breeding values with higher reliability compared to the traditional 305-day lactation animal model. The RRM using a fourth order LP is recommended to be used for genetic evaluations of Brazilian Holstein cattle.
ACKNOWLEDGMENTS
We would like to thank the Associação Brasileira de Criadores de Bovinos da Raça Holandesa (ABCBRH) for providing the valuable data. This research was developed with the support of CENAPAD-SP (Centro Nacional de Processamento de Alto Desempenho em São Paulo), UNICAMP/FINEP project - MCT.
Notes
CONFLICT OF INTEREST
We certify that there is no conflict of interest with any financial organization regarding the material discussed in the manuscript.