Effect of Floor Space Allowance on Pig Productivity across Stages of Growth: A Field-scale Analysis
Article information
Abstract
A total of 152 pig farms were randomly selected from the five provinces in South Korea. During the experiment, the average temperature and relative humidity was 24.7°C and 74% in summer and 2.4°C and 53% in winter, respectively. The correlation between floor space allowance (FSA) and productivity index was analyzed, including non-productive sow days (NPD), number of weaners (NOW), survival rate (SR), appearance rate of A-grade pork (ARA), and days at a slaughter weight of 110 kg (d-SW) at different growth stages. The objectives of the present study were i) to determine the effect of FSA on the pig productivity index and ii) to suggest the minimum FSA for pigs based on scientific baseline data. For the pregnant sow, NPD could be decreased if pregnant sows were raised with a medium level (M) of FSA (3.10 to 3.67 m2/head) while also keeping the pig house clean which improves hygiene, and operating the ventilation system properly. For the farrowing sows, the NOW tended to decrease as the FSA increased. Similarly, a high level of FSA (H) is significantly negative with weaner SR of farrowing sows (p-value = 0.017), indicating this FSA tends to depress SR. Therefore, a FSA of 2.30 to 6.40 m2/head (very low) could be appropriate for weaners because a limited space can provide a sense of security and protection from external interruptions. The opposite trend was observed that an increase in floor space (>1.12 m2/head) leads to increase the SR of growing pigs. For the fattening pigs, H level of FSA was negatively correlated with SR, but M level of FSA was positively correlated with SR, indicating that SR tended to increase with the FSA of 1.10 to 1.27 m2/head. In contrast, ARA of male fattening pigs showed opposite results. H level of FSA (1.27 to 1.47 m2/head) was suggested to increase productivity because ARA was most affected by H level of space allowance with positive correlation (R2 = 0.523). The relationship between the FSA and d-SW of fattening pigs was hard to identify because of the low R2 value. However, the farms that provided a relatively large floor space (1.27 to 1.54 m2/head) during the winter period showed d-SW was significantly and negatively affected by FSA.
INTRODUCTION
A correlation between the floor space requirement and production efficiency (livestock productivity, welfare, disease incidence, etc.) is necessary to explore the optimal floor space allowance (FSA). The Council of the European Union (2001) proposed the floor space requirement of pigs which was generally categorized by weight. For a pig weighing up to 10 kg, for example, a floor space requirement of 0.15 m2/head was suggested. The recommended floor space requirement that was suggested for pigs weighing more than 10 kg and up to 50 kg ranged from 0.2 to 0.4 m2/head. The pig weight ranged from 50 to 85 kg and more than 85 to 110 kg, requiring 0.55 m2 and 0.65 m2, respectively. In addition to the floor space requirement suggested, farmers and policy makers became interested in the relationship between FSA and animal productivity. The FSA has been extensively studied in terms of productivity, including growth performance and animal behavior (Weng et al., 1998; Hyun et al., 1998; Gonyou and Stricklin, 1998; Turner et al., 2000; Jensen et al., 2012). However, the results of the FSA effect on productivity varied. According to the studies regarding pig productivity and performance, the impact of different space allowances ranging from 1.4 m2 to 3.3 m2 on the pregnant sow’s performance was evaluated, resulting in a growth of body weight and depth of backfat as the floor space increased (Salak-Johnson et al., 2007). Other studies reported that the average daily gain (ADG) decreased with decreasing FSA from 0.78 m2/head to 0.52 m2/head (Street and Gonyou, 2008). The relationship of FSA and productivity cannot be clearly concluded yet because pig welfare and economics conflict (Powell and Brumm, 1992; Gonyou et al., 2006). From the perspective of the pigs’ welfare, a relatively large FSA can produce healthier pigs with high immunity because ease of movement and comfort are improved. To reflect this trend, the Ministry of Agriculture, Food and Rural Affairs (MIFAFF) in South Korea organized a subcommittee, which was composed of experts and producers, to enforce the livestock industry’s registration system. The recommended stocking density or FSA (area per animal) for sows and sows in farrow was 1.43 m2/head and 3.96 m2/head, respectively (MIFAFF, 2005). Although the interplay between FSA and pig productivity is important for pig producers and policy makers, it has not been widely studied at the field scale. The objectives of the present study were i) to determine the effect of FSA on pig production efficiency, including productivity and performance based on the field analysis, and ii) to suggest the minimum FSA for pigs based on scientific baseline data.
MATERIALS AND METHODS
Farm survey
The National Agricultural Cooperative Federation (NH) and Seoul National University (SNU) collaborated in designing the survey. The content and questions of the survey were determined based on a pre-survey reflecting practical field conditions. In 2005, a door-to-door survey was conducted to collect information from farmers of pig farms belonging to the regional livestock cooperative federation, and actual measurements were carried out when necessary. The collected raw data were sent to Kyungsung University for statistical analysis and were reconstructed and interpreted from a teleological perspective. A total of 152 pig farms were selected randomly from the five provinces in South Korea: 32 farms in Chungnam, 28 farms in Jeonbuk, 4 farms in Gyongbuk, 36 farms in Gyungnam, and 52 farms in Jeonnam were surveyed during the summer (June to August) and winter seasons (December to March). The average maximum and minimum temperature of the summer season was 29.0°C and 21.5°C, respectively. The average humidity was 74.2%. The average maximum temperature and minimum temperature in the winter season was 7.2°C and −1.8°C, respectively and the mean humidity was 53.2%. The number of farms based on the growth stages of pig is presented in Table 1.
Number of surveyed farms based on different growth stages
Pig productivity index
The pig productivity index was determined by reflecting the opinions of pig producers and experts from the National Agricultural Cooperative Federation (Table 2). The correlation between FSA and the productivity index was analyzed, including non-productive sow days (NPD), number of weaners (NOW), survival rate (SR), appearance rate of A-grade pork (ARA), and days at a slaughter weight of 110 kg (d-SW).

Productivity index of pig with the different growth stages
Statistical analysis
The correlation between four different levels of FSA (very low, VL; low, L; medium, M; high, H) and pig productivity index (the dependent variable) was analyzed using the multiple regression analysis model within IBM SPSS STATISTICS 22. Analysis of variance was conducted at the significance level of 0.05.
RESULTS AND DISCUSSION
Non-productive sow days
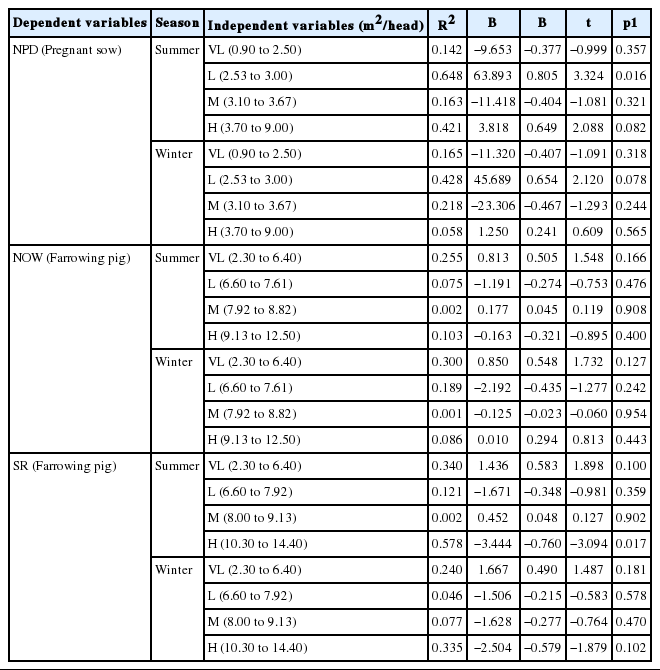
The survey found that the range of FSA for pregnant sows during summer were from 0.90 m2 to 9.00 m2. The average NPD was 41.8 d. The relationship between the FSA and the NPD is shown in Figure 1. The highest coefficient of determination (R2 = 0.648) was obtained with L level of FSA ranged from 2.53 to 3.00 m2/head. Approximately 65% of dependent variable (NPD) could be explained by L level of FSA during the summer season (Table 3). L level of FSA is positively correlated with NPD at high significance. The high level (H level) of FSA ranged from 3.70 to 9.00 m2/head was also expected to have higher NPD. Other variables such as VL and medium level (M level) of FSA were negatively correlated with NPD. Consequently, NPD tended to decrease with M and VL level of FSA. The FSA variables had no significant effect on NPD in winter season. However, the results also showed that L variable tend to have relatively higher NPD than other variables. A wide variation was observed in the entire NPD dataset such as the lowest number of NPD (14 d) allowed in VL range, and the highest number of NPD (60 d) was also observed with the same FSA group. This result probably indicates that other factors, such as feeding, management, and environmental control, could affect the NPD. Therefore, productivity could be increased if pregnant sows were raised with a floor space level of M while also keeping the pig house clean which improves hygiene and operating the ventilation system properly. Because pregnant sows require absolute emotional stability, it is necessary to provide the proper amount of space so that the pregnant sow can feel this sense of stability. This result agrees with those of previous studies on the effect of space allowance on NPD of gilts in a commercial swine production system (Young et al., 2008). The appropriate level of FSA may play a key role in providing improved performance of pregnant sows in terms of the sow’s emotional stability, sense of comfort, and reproductive efficiency. Subsequently it results in more profit and higher income for pig producers (Suwanasopee et al., 2005). In contrast, pregnant sows kept in a large space may have a sense of fear or insecurity, resulting in low productivity. Other than FSA, feeding and management are other important factors that could potentially affect the productivity of pregnant sows. Therefore, it is necessary to quantify the correlation among these factors in further studies.
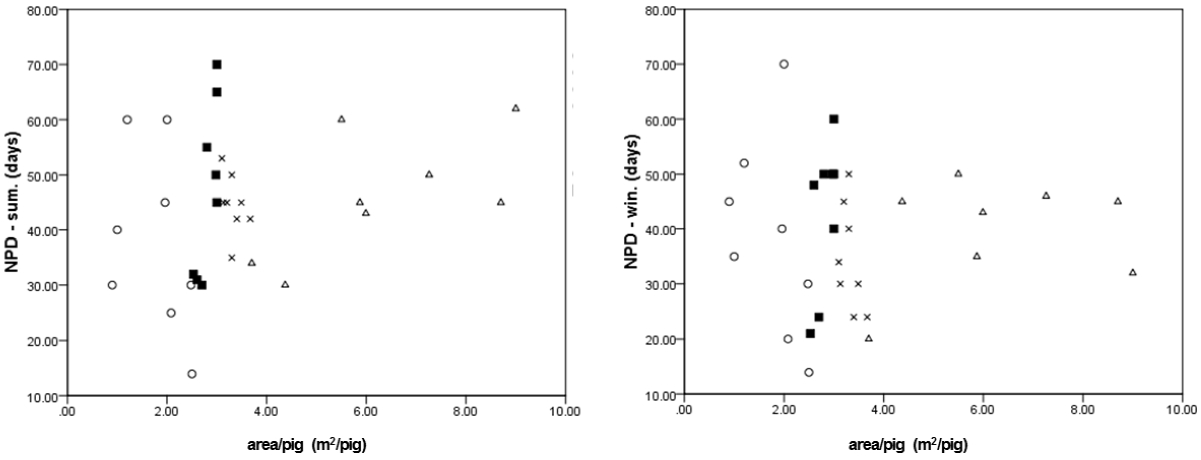
The distribution of non-productive sow days (NPD) for pregnant sows over floor space allowance (FSA) by season: summer and winter (○: very low, ■: low, ×: medium, Δ: high).
The correlation between four different floor space allowances (VL, L, M, H) and pig productivity index
Average number of weaners
The relationship between the FSA and the NOW of farrowing sows is shown in Figure 2. Although the value of the coefficient of determination was low, the NOW tended to decrease as the FSA increased. The tendency in the present study agreed with the results found by Salak-Johnson et al. (2007). This trend can be understood by observing the characteristics of the pig. When the pig gives birth, the space to raise piglets should be limited to provide a sense of security and protection from external interruptions. A large space can create anxiety in farrowing sows. The FSA that is currently used in South Korea seems excessively large. Therefore, a FSA of 2.30 to 6.40 m2/head (VL) would be appropriate to have high weaner production. The average NOW was 20.6 weaners per year during the winter season, which was 0.3 higher than that during the summer. A pregnancy disorder caused by the intense heat of sun during the summer season could play a key role in the decrease of weaner production. More fundamental causes should be studied using an in-depth analysis with accumulated data.
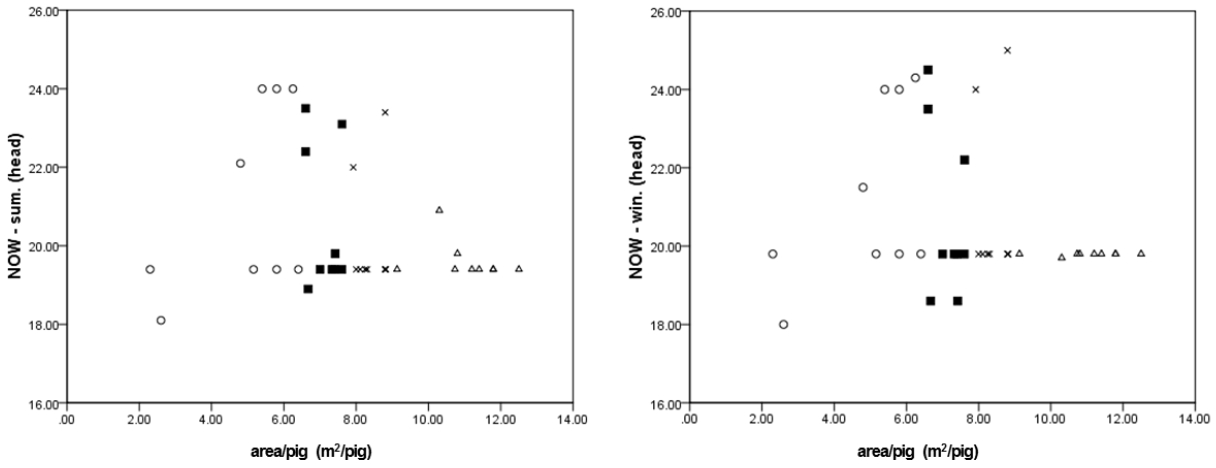
The distribution of number of weaners per farrowing sow (NOW) over floor space allowance (FSA) by season: summer and winter (○: very low, ■: low, ×: medium, Δ: high).
Survival rate
The relationship between the FSA and weaner SR of farrowing sows is shown in Figure 3. During the summer season, the regression analysis showed that the highest coefficient of determination was approximately 58% (R2 = 0.578) with H level of FSA ranged from 10.30 to 14.40 m2/head (Table 3). H level of FSA was negatively correlated with SR at significant level, indicated that those FSAs tend to depress SR. Although the value of R2 was low, the SR tended to increase as the FSA decreased. Again, limited space can give the pig a sense of stability during the initial weaning period. A larger space, however, will be required as the weaners gain weight and become active. The impact of seasonal differences on the weaner SR of farrowing sows was not statistically significant. Therefore, a FSA of 2.30 to 6.40 m2/head (VL) could be suggested to maintain an appropriate environmental condition for weaners of farrowing pig.
The distribution of survival rate (SR) of farrowing sow’s weaner over floor space allowance (FSA) by season: summer and winter (○: very low, ■: low, ×: medium, Δ: high).
The relationship between the FSA and SR of growing pigs is shown in Figure 4. According to the overall data from the summer season, the SR of growing pigs tended to increase. It indicates that an increase in floor space led to increased pig productivity. The SR of growing pigs with the VL, L, and M level of FSA (<1.12 m2/head) showed a large deviation, ranging from 86% to 99%. The influence of farmers’ meticulous feed management on SR may be large, such that the drawbacks of high stocking density can be compensated for, resulting in a high SR with smaller FSA. For the farms that provided a relatively large floor space (1.12 to 1.90 m2/head), the SR was stable (greater than 95%). The SR depends somewhat on the FSA. A regression analysis, however, showed that the SR was not significantly affected by the FSA during the summer period. During the winter season, as was observed in the summer, a H level of variation in SR with change in FSA. The average SR of growing pigs during the winter season was 94.5%, which was 0.9% lower than the summer season result. A severe daily temperature difference in winter may have a vital influence on lowering the SR due to respiratory disease.
The distribution of weaner, growing, and fattening pig’s survival rate (SR) over floor space allowance (FSA) by season: summer and winter (●: weaner, □: growing pigs, ×: fattening pigs).
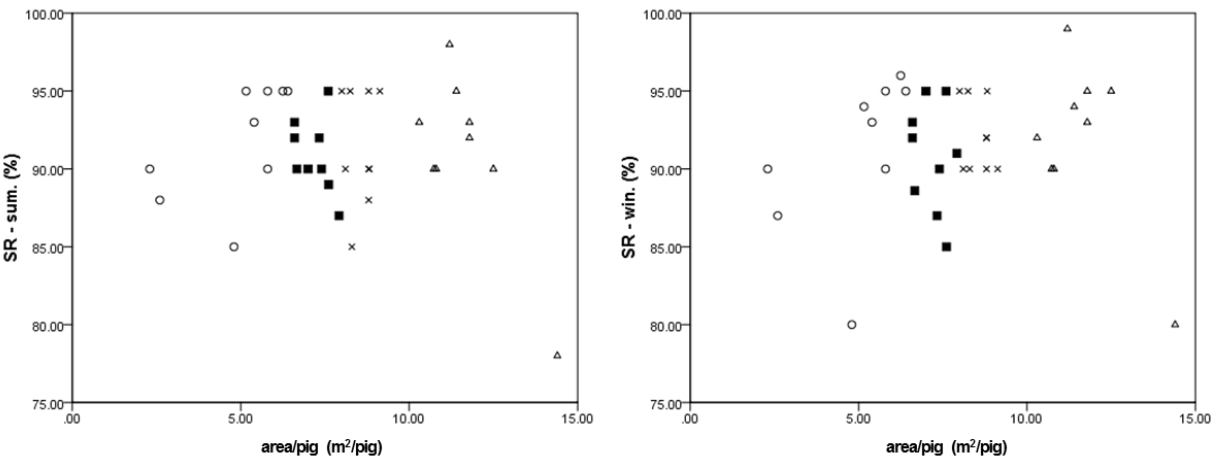
The highest coefficient of determination (R2 = 0.676) was obtained with H level of FSA (1.30 to 2.80 m2/head). The negative correlation with SR was observed so those FSA tend to have lower SR of fattening pigs (Table 3). M level of FSA, however, was positively correlated with SR, indicated SR tended to increase with the FSA of 1.10 to 1.27 m2/head. The SR was also significantly and positively affected by the M level of FSA (R2 = 0.651) during the winter period. The lowest SR (90%) was obtained in the range of 0.90 to 1.10 m2/head, and the highest SR (99%) was also observed in the same FSA level. Similar results were also obtained in the winter season especially with VL level. It is likely that variable feed management caused the high variation in the SR of fattening pigs. The average SR during the winter season was 92.7%, which is 1.9% lower than during the summer season. It is natural to expect decrease in SR during the winter period compared with that during the summer, due to the large daily temperature difference.
The relationship between the FSA and weaner SR is shown in Figure 4. A tendency for the weaner SR to increase was observed. A regression analysis, however, showed that the weaner SR was not significantly affected by the FSA during the both summer and winter period. A very low value of R2 was obtained which represented a high level of variation in SR with change in the FSA (data not shown). The weaner SR with smaller floor spaces (0.10 to 0.56 m2/head) showed a large deviation, ranging from 80 to 99%. This deviation can be explained by examining other management factors, such as the meticulous weaner management of farmers, as a high-quality facility (i.e., ventilation) and cleanliness may play key roles in producing the large variance. For the farms that provided a relatively large floor space (0.57 to 2.75 m2/head), the SR was stable (greater than 90%). The results in winter season were similar to summer. It seems that the impact of FSA on weaner SR was somewhat little, and larger spaces are difficult to accommodate economically. Therefore, a FSA of 0.57 m2/head with high-intensity feed management could satisfy such an economic situation for weaner pigs.
Appearance rate of A-grade pork
The yield grade of pork was investigated. The average ARA for the male fattening pig was 53.7% during the summer season. The relationship between ARA and FSA is shown in Figure 5. H level of FSA (1.27 to 1.47 m2/head) was suggested to increase productivity because ARA was most affected by H space allowance with positive correlation (R2 = 0.523). Previous studies, however, showed that there was no correlation between FSA and meat quality. According to Gentry et al. (2002), an uncrowded FSA (9.45 m2/head) with increased exercise had no effect on meat quality improvement. Morrison et al. (2007) also reported that the large group housing system (1.7 m2/head) was not evident for pork quality compare to conventional confinement pig system. The average ARA for male fattening pigs was 53.5% during the winter season, but the impact of the seasonal difference on the ARA was not statistically significant. Interestingly, the highest coefficient of determination (R2 = 0.974) was observed with M level of FSA (1.10 to 1.18 m2/head) in winter season and it had negative effect on ARA. The M level of FSA could be the critical factor at which decrease of ARA begins.
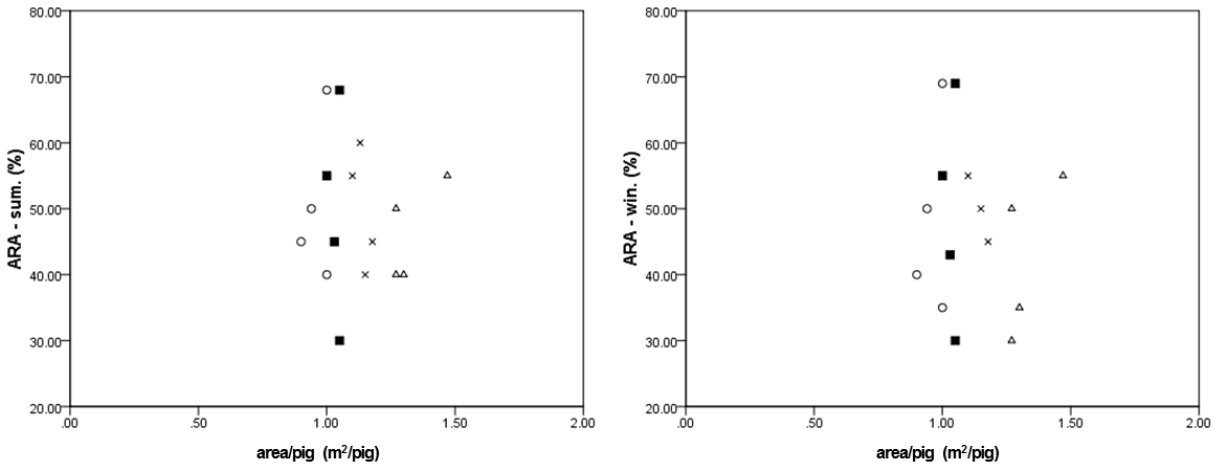
The distribution of A grade pork appearance rate of male fattening pigs (ARA) over floor space allowance (FSA) by season: summer and winter (○: very low, ■: low, ×: medium, Δ: high).
Average days of slaughter weight at 110 kg
The relationship between the FSA and the d-SW during the summer and winter seasons is shown in Figure 6. The regression analysis showed that the values of R2 during the summer season were low. It is difficult to identify a clear relationship between the FSA and d-SW of fattening pigs. However, the farms that provided a relatively large floor space (1.27 to 1.54 m2/head) during the winter season showed d-SW was significantly and negatively affected by FSA (Table 3). A relatively large floor space can provide healthier pigs with high immunity because they are easier to move and more comforted when resting are improved. Hyun et al. (1998) reported that a lower ADG with lower floor space was obtained due to an increase in the abnormal behavior and aggression level. Because pigs do not have sweat glands, the higher heat load for pigs, especially during the summer, could be the main factor that decreases the ADG compared with the large FSA. Another possible factor affecting ADG may be feeder space (Jensen et al., 2012). Consequently, the market day of pigs at the slaughter weight of 110 kg should be shortened with the large FSA.

The distribution of days of slaughter weight at 110 kg for the fattening pigs (d-SW) over floor space allowance (FSA) by season: summer and winter (○: very low, ■: low, ×: medium, Δ: high).
CONCLUSION
A door-to-door survey and actual measurements were conducted to collect information from the farmers at 152 pig farms. The correlation between the FSA and pig productivity index was analyzed, including the NPD, NOW, SR, ARA, and d-SW. The minimum FSA of NPD (3.10 to 3.67 m2/head), NOW (2.30 to 6.40 m2/head), ARA (1.27 to 1.47 m2/head), and d-SW (1.27 to 1.54 m2/head) could be suggested. For SR, a FSA of 2.30 to 6.40, 1.12 to 1.90, and 1.10 to 1.27 m2/head could be appropriate minimum space requirement for weaner of farrowing sow, growing pigs, and fattening pigs to maintain high productivity, respectively. However, an in-depth analysis based on big data and long-term study data may be necessary to more accurately determine the floor space requirements in terms of pig’s growth stage, welfare, and productivity.

The correlation between four different floor space allowances (VL, L, M, H) and pig productivity index
ACKNOWLEDGMENTS
The authors acknowledge the Korea Institute of Planning and Evaluation for Technology in Food, Agriculture, Forestry, and Fisheries (IPET) from the Ministry of Agriculture, Food, and Rural Affairs (MAFRA) through project no. 312036-03-2-HD030, and in part by the Korea Institute of Energy Technology Evaluation and Planning (KETEP) from the Ministry of Trade, Industry & Energy (no. 2012-3020090040) and by the Korea Environmental Industry & Technology Institute (KEITI) through project no. 2013001470005 funder’s to support this work.
Notes
CONFLICT OF INTEREST
We certify that there is no conflict of interest with any financial organization regarding the material discussed in the manuscript.