Identification of Histone Deacetylase 2 as a Functional Gene for Skeletal Muscle Development in Chickens
Article information
Abstract
A previous genome-wide association study (GWAS) exposed histone deacetylase 2 (HDAC2) as a possible candidate gene for breast muscle weight in chickens. The present research has examined the possible role of HDAC2 in skeletal muscle development in chickens. Gene expression was measured by quantitative polymerase chain reaction in breast and thigh muscles during both embryonic (four ages) and post-hatch (five ages) development and in cultures of primary myoblasts during both proliferation and differentiation. The expression of HDAC2 increased significantly across embryonic days (ED) in breast (ED 14, 16, 18, and 21) and thigh (ED 14 and 18, and ED 14 and 21) muscles suggesting that it possibly plays a role in myoblast hyperplasia in both breast and thigh muscles. Transcript abundance of HDAC2 identified significantly higher in fast growing muscle than slow growing in chickens at d 90 of age. Expression of HDAC2 during myoblast proliferation in vitro declined between 24 h and 48 h when expression of the marker gene paired box 7 (PAX7) increased and cell numbers increased throughout 72 h of culture. During induced differentiation of myoblasts to myotubes, the abundance of HDAC2 and the marker gene myogenic differentiation 1 (MYOD1), both increased significantly. Taken together, it is suggested that HDAC2 is most likely involved in a suppressive fashion in myoblast proliferation and may play a positive role in myoblast differentiation. The present results confirm the suggestion that HDAC2 is a functional gene for pre-hatch and post-hatch (fast growing muscle) development of chicken skeletal muscle.
INTRODUCTION
Muscle growth follows a distinct two-stage process, hyperplasia and hypertrophy, which is similar in mammals and poultry (Rehfeldt et al., 2011). Hyperplasia describes the increase in myoblast cell number. During the embryonic period of muscle development, myoblasts are proliferating, then differentiating into multinucleated myotubes, and finally forming muscle fibers. After the pre-hatch formation of muscle fibers, fiber number is almost fixed by the time of hatch (Velleman, 2007).
The poultry industry has largely selected animals based on phenotypic growth rate and muscling. By using this approach, it has likely favored selection based on muscle hypertrophy rather than on hyperplasia, which might result in a situation that could be detrimental to muscle health and subsequently meat quality. As increasing evidence suggests that influences on prenatal development of skeletal muscle can result in long-term effects on postnatal growth and physiological function in farm animals, there is a need to expose genes which function prenatally in muscle development. Several candidate genes influencing breast or thigh muscle weights were identified from our previous genome-wide association study (GWAS) on chickens (Liu et al., 2013).
The possible association of the histone deacetylase 2 (HDAC2) gene with skeletal muscle development in chickens was the focus of the present study. HDAC2 is a class-I enzyme (typically localizes to the cell nucleus) belonging to HDAC enzyme family which deacetylates histone tails and non-histone proteins changing chromatin structure (Montgomery et al., 2007). The structure of chromatin is an important factor for DNA-related processes in eukaryotes (Lin et al., 2008) by regulating many important cellular processes including transcription (Brunmeir et al., 2009) and control of cell growth, differentiation, and development of skeletal muscle (McKinsey et al., 2001). HDAC2 is expressed in many tissues and plays a crucial role in cellular differentiation and proliferation (Segré and Chiocca, 2011). There has been, however, no functional or mechanistic investigation of this gene in the development of chicken skeletal muscle.
In vitro, skeletal myogenesis follows a defined pattern of temporal gene expression (Bentzinger et al., 2012). Four myogenic regulatory factors (MRFs), products of myogenic factor 5 (MYF5), myogenic differentiation (MYOD), myogenin (MYOG), and myogenic regulatory factor 4 (MRF4) genes, are sequentially expressed during myogenesis where MYOD is required for inducing differentiation and formation of muscle fibers (Rehfeldt et al., 2011). In addition to these MRFs, two myogenic inducers, paired box 3 (PAX3) and 7 (PAX7), play a vital role in skeletal muscle development (Lamey et al., 2004); PAX7 serves as a marker of muscle precursor cells during myogenesis (Halevy et al., 2004).
In the present study, the role of the HDAC2 gene in muscle development of chickens was examined by measuring the relative expression of HDAC2 in breast and thigh muscles at embryonic and post-hatch stages. The relative expression profiles of HDAC2 were also examined during primary myoblast proliferation and differentiation.
MATERIALS AND METHODS
Ethics statement
All experimental procedures with Beijing-You chicks and embryos were performed according to the Guidelines for Experimental Animals established by the Ministry of Science and Technology (Beijing, China). All experimental protocols were approved by the Science Research Department (in charge of animal welfare issues) of the Institute of Animal Sciences, CAAS (Beijing, China). The chicks and incubating eggs were obtained from the experimental farm of the Institute of Animal Sciences (IAS), Chinese Academy of Agricultural Sciences (CAAS), Beijing, China.
Tissue sample collection
Embryonic breast and thigh tissue samples were collected from six randomly chosen embryos on embryonic day (ED) 14, 16, 18, and 21. Similar samples were collected at d 1, 7, 14, 21, and 28 after hatching including deboned muscles from breast (right side) and thigh (left side) for weight, in addition, lowest and highest growth of breast muscles samples were collected from 90 d old chickens. All samples were snap frozen in liquid nitrogen and held at −80°C, except deboned muscles.
Preparation and culture of chicken primary myoblasts
The pectoralis muscles were collected from ED 12 embryos into phosphate-buffered saline (PBS). The muscle pieces were washed twice after removing visible connective tissue and blood vessels. The pieces were then minced and digested for 30 min at 37°C with 2 volumes of PBS containing 0.1% collagenase I (Gibco, Carlsbad, CA, USA), 1.5% bovine serum albumin and 100 millimolar (mM) N-2-hydroxyethylpiperazine-N-2-ethane sulfonic acid. The supernatant after centrifuging (7 min, room temperature, 1,000×g) was discarded. Digestion was repeated a second time with 2 volumes of PBS containing 0.25% trypsin and 0.04% ethylenediaminetetraacetic acid for 15 min at 37°C. Cells were then liberated by repeated pipetting after adding an additional 2 volumes of Dulbecco’s modified eagle medium/nutrient mixture F-12 (DMEM/F-12) (HyClone, Waltham, MA, USA) with 15% fetal bovine serum (FBS) (HyClone, USA) to quench enzyme action. The muscle digests were sieved sequentially over screens of 149, 74, 37, and 23 μm porosity and myoblasts were collected by centrifugation, as above. Erythrocytes were eliminated by lysis for 8 min then myoblasts were recovered and washed again with PBS and centrifugation, then suspended in medium DMEM/F-12 containing 15% FBS and 1% Penicillin-Streptomycin (HyClone, USA). Cells were seeded at about 1.5×10⁶/well in 6-well plates and 104/well in 96-well plates and incubated at 37°C under 5% CO2 in air. Culture medium was replaced daily for 60 h then, when cells were at about 80% confluency, FBS was replaced with 2% horse serum (Gibco, USA) to induce myoblast differentiation.
Myoblast proliferation
The number of live myoblasts was measured at 24 h, 48 h, and 72 h of the initial cell culture. Medium was removed from each well (8 wells in a 96-well plate) and replaced with 100 μL fresh medium containing 10% (v/v) cell counting kit 8 (CCK-8) (Dojindo, Kumamoto, Japan) reagents. The tetrazolium salt of this reagent was reduced by dehydrogenase activities of live cells to produce a yellow formazan dye in the culture media that can be quantified (after 3 h) by measuring absorbance at 450 nanometer (nm).
Characterization of myotubes
Differentiating myoblasts were washed with PBS and fixed in 4% paraformaldehyde solution for 10 min at 24 h, 72 h and 144 h of differentiation to visualize myotubes and nuclei. Cells were then stained with Giemsa (Amresco, Solon, OH, USA) for 10 min. Total cell nuclei and nuclei within myotubes (≥3 nuclei) were counted manually from five randomly chosen microscopic fields. The fusion index was calculated as the number of nuclei in myotubes divided by the total number of nuclei counted and average number of nuclei per myotube was the number of nuclei in myotubes divided by number of myotubes.
Quantitative real-time polymerase chain reaction
Total RNA was extracted from the tissues and myoblasts using TRIzol Reagent (Invitrogen, Carlsbad, CA, USA) and RNApreppurekits (Tiangen, Beijing, China), respectively. RNA was isolated from six replicated breast and thigh muscle samples from each of the previously noted times of embryonic development and post-hatching. RNA was also collected from triplicate wells of chicken primary myoblast cultures at 24 h, 48 h, and 72 h of proliferation, and at 24 h, 72 h, and 144 h of differentiation. cDNA was generated from 2 μg of total RNA in a final volume of 20 μL following kit instructions (Tiangen, China). Quantitative polymerase chain reaction (qPCR) was performed in triplicate using the instructions of SuperRealPreMix Plus kit (Tiangen, China) with 1 μL cDNA template, 0.6 μL gene specific primers, 10 μL 2×buffer, 0.4 μL 50×ROX Reference DyeGreen Master Mix, in a final volume of 20 μL, and a 7500 Real Time PCR System (Applied Biosystems, Foster City, CA, USA). Initial denaturing was at 95°C for 15 minutes, and was followed by 40 cycles of 95°C for 10 seconds, 55°C for 31 seconds, and 72°C for 32 seconds. Primers were designed (Premier Primer 5) on the basis of GenBank chicken sequences (Table 1).
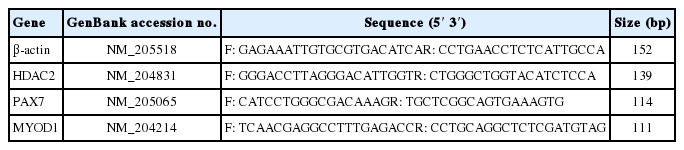
Primers used and expected amplicon sizes
Data processing and analyses
Data were processed using software provided with the instrument and Microsoft Excel (Microsoft Corp., Redmond, WA, USA). Relative gene expression was calculated by the 2−ΔΔCT method, using β-actin as an internal standard with the confirmation of qPCR efficiency (Livak and Schmittgen, 2001). Therefore the ΔCT (CT, target gene−CT, beta actin) was calculated for each cDNA dilution over a 100-fold range and the data were fit through least-squares linear regression analysis. Differences between developmental stages for breast and thigh muscles, and fusion index, nuclei number and transcript abundance from cells in different periods were assessed by separate one-way analysis of variances according to the following model and Table 2 with Tukey’s honestly significant difference post-hoc tests to compare means.
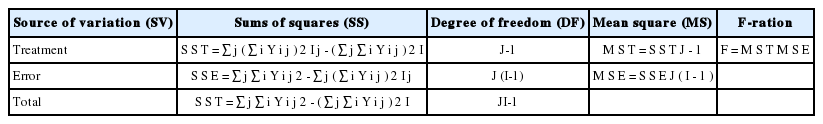
The analysis of variance table for one way case with equal replication
Where,
 is the effect of j-th treatment in i-th level, μ is the general mean,
 represents the effect of j-th treatment and ℰij means random error due to i-th level of the j-th treatments.
The expression between low and high growth muscles from the breast of chicken was calculated by the following model of independent sample t-test.
Where, X̄, si2 and ni are the mean, variance and size of the samples in groups (i = 1 and 2), respectively.
RESULTS
Relative expression profiles of HDAC2 in the embryonic and post-hatch stages
In breast muscle of chickens, the transcript abundance of HDAC2 increased significantly across embryonic periods (ED 14, 16, 18, and 21) and there were differences between all sampling stages (ED 14 to 16, ED 16 to 18, and ED 18 to 21) (Figure 1). The progressive increase between adjacent sampling stages in thigh muscle was not significant but the differences of ED between 14 and 18, and 14 and 21 were significant (Figure 1). Because myoblast hyperplasia continues across these embryonic stages and finishes at the time of hatch, a well defined process in chickens, these results suggest that HDAC2 possibly plays a role in myoblast hyperplasia in breast and thigh muscles.
Transcript abundance of histone deacetylase 2 (HDAC2) in breast and thigh muscles of embryonic chickens. Data are means (n = 6)+standard error of the mean, except when error bars are smaller than symbols. Means on the same line with different letters (a, b, c, or d) differ significantly (p<0.05).
For the post-hatch periods, HDAC2 was markedly decreased from d 7 to d 14 and then kept stable to d 28 (Figure 2A). The gene expression in thigh muscle decreased from d 1 to d 14, then kept stable to d 28 (Figure 2B). The most rapid growth of both breast and thigh muscles occurred between d 14 and d 21, when expression of HDAC2 was relatively low; this period of muscle growth is mainly due to hypertrophy of existing fibers to which there may be little contribution from HDAC2. Significant differential expression (p<0.05) observed between the muscles of lowest and highest growth of chickens at growing stage (Figure 2C).
Transcript abundance of histone deacetylase 2 (HDAC2) in post-hatch chicken muscles along with muscle weights. Transcript abundance and weight of breast muscle from one side (A); Transcript abundance and weight of thigh muscle from one side (B); Relative expression of low and high growth of chicken muscles (C). Data are means (n = 6)+SEM (breast and thigh muscles) or (n = 12)+SEM (slow and fast growing muscles) for transcript abundance and muscle weight (n = 4)+SEM, except when error bars are smaller than symbols. Means on the same line or bar with different letters (a, b or c; x, y, or z; p or q) differ significantly (p<0.05). SEM, standard error of the mean.
Expression of HDAC2 during myoblast proliferation in vitro
The relative expression of the HDAC2 gene and marker gene PAX7 was determined by qPCR in chicken primary myoblasts. Reciprocal changes were demonstrated here in the abundances of HDAC2 to both cell numbers and those of PAX7 (Figure 3). There was a decrease in HDAC2 transcripts and an increase in PAX7 between 24 and 48 h while the number of myoblasts steadily increased until 72 h. The changes are consistent with a possible negative regulatory role of HDAC2on myoblast proliferation.
Changes in relative transcript abundance of HDAC2 and PAX7 genes at 24 h, 48 h, and 72 h of myoblast culture along with numbers of cells. The relative expression of genes was measured in myoblasts at different times of proliferation (n = 3). Optical density (OD) of reduced CCK-8 reagent (n = 8) was determined at the same sampling times. Results are expressed as the mean fold-change in abundance OD450 as the calibrator. Each value is the mean+SEM for the 3 or 8 wells sampled. Means on the same line with different letters (a or b; x, y, or z) differ significantly (p<0.05). HDAC2, histone deacetylase 2; PAX7, paired box 7; SEM, standard error of the mean.
Myoblast differentiation and HDAC2 expression in vitro
The progressive changing of primary myoblasts (Figure 4A) into differentiated, multinucleated myotubes corresponded closely with changes in the cell fusion index (Figure 4B) and average number of nuclei per myotube (Figure 4C). The fusing of myoblasts having single nuclei into the multinucleated myotubes over time was reflected in the comparatively long linear arrays of nuclei (Figure 4A). Increases in the relative abundance of HDAC2 and MYOD1, most obvious from 24 to 72 h then followed by apparent decreases were very similar (Figure 4D). These results are consistent with a positive regulatory role of HDAC2on myoblast differentiation, especially during the first 72 h. When combined with the changes in HDAC2 expression obtained in vivo, it is suggested that HDAC2 likely influences myoblasts by reducing their proliferation and increasing differentiation.
Primary chicken myoblast differentiation at 24 h, 72 h, and 144 h. Myoblast differentiation and fusion into multinucleated myotubes over the time of culture in differentiated medium. Staining (Giemsa stain) of cells revealed the accumulation of single cell nuclei (myoblasts) into single lines (myotubes) with time (A); fusion index (%) of myotubes shows the progressive extent of cell fusion (B); average nuclei number per myotube (n = 5) (C), and changes in relative transcript abundance of HDAC2 and MYOD1 genes (D). Results are the mean fold-change in gene expression (+SEM, n = 3 wells) normalized to values at 24 h. On a within-transcript basis, bars labeled with different letters (a, b, or c; x or y) are statistically different (p<0.05). HDAC2, histone deacetylase 2; MYOD1, myogenic differentiation 1; SEM, standard error of the mean.
DISCUSSION
With the aim of exploring a new gene with a possible important function in pre-hatch muscle development, the association of HDAC2 with skeletal muscle development in chickens was the present focus. There was continuous increase in HDAC2 expression in embryonic muscles indicating that this gene may play a role in the hyperplastic phase of skeletal muscle growth. Up-regulation of HDAC2 was identified previously in human urothelial tissues (Niegisch et al., 2013), and in cardiomyocytes of rat hearts (Nural-Guvener et al., 2014). Moresi et al. (2012) reported that HDAC2 was associated with skeletal muscle homeostasis and autophagy flux in mice. In another study, deletion of both cardiac-specific HDAC1 and HDAC2 genes in mice resulted up-regulation encoding skeletal muscle-specific contractile proteins (Montgomery et al., 2007). The study demonstrated that HDAC2 gene expressed significantly greater in fast growing birds than slow growing which indicating this gene might be associated with muscle growth. No clear evidence, however, showed that HDAC2 functioned in skeletal muscle development and its underlying mechanisms.
In the present study, the observed pattern of down-regulation of HDAC2 during myoblast proliferation suggested that this gene might play a possible negative regulatory role on myoblast proliferation and function in the hyperplastic phase of development of chicken skeletal muscle. This is not consistent with previous reports in cardiomyocytes which claimed that the absence of HDAC2 causes myocyte hyper-proliferation in embryonic development and proliferation of cardiomyocytes in mice (Montgomery et al., 2007; Zhu, 2010) and HDAC2, HOP homeobox (HOPX), and GATA binding protein 4 (GATA4) coordinately regulates cardiac myocyte proliferation during embryonic development (Trivedi et al., 2010). Inhibition of class I HDAC reduced proliferation of newborn pulmonary arterial smooth muscle cells in sheep (Yang et al., 2013) and mice, including cell cycle arrest in G1 phase and migration (Galletti et al., 2014).
The up-regulation of HDAC2 during myoblast differentiation in the current study suggests its having a positive role during hyperplasia when muscle development consists mainly of the formation of multinucleated myotubes to then form muscle fibers. The potential role of HDAC2 was identified in the differentiation process of rat PC12 cells (Bai et al., 2005), neuronal cells in the cerebellar cortex of mice (Yoo et al., 2013) and also embryonic nervous system gained in zebra fish (Brunmeir et al., 2009). Turgeon et al. (2013) showed that HDAC2 regulates intestinal epithelial cell differentiation in mice but its inactivation impairs epidermal regulator p63-dependent differentiation (LeBoeuf et al., 2010). HDAC2 activates the transcriptional program of myelination and induces Schwann cell differentiation (Jacob et al., 2011) and a similar role in oligodendrocyte differentiation in mice was shown (Ye et al., 2009). Histone deacetylase controlled, notch-mediated smooth muscle differentiation occurs in human vascular cells (Tang et al., 2012), and class I HDAC regulated mammalian epithelial differentiation and intestinal (Tou et al., 2004). The myogenic marker gene MYOD1 showed a similar pattern of expression with HDAC2 here, during the differentiation of myoblasts to myotubes. The expression of MYOD1 during differentiation of pre-hatch chicken myoblasts (Halevy et al., 2004) and in fetal mice (Nguyen et al., 2010) detected previously. The gene HDAC2 and its encoded enzyme is an important regulator of gene expression (Parbin et al., 2014) and eukaryotic transcription (Taunton et al., 1996). The present findings are consistent with HDAC2 being involved in both the proliferative and early differentiation stages of skeletal myogenesis in chickens. Further study, particularly of histone deacetylation of other genes involved in myogenesis, are indicated to expand knowledge of the relevant molecular mechanisms.
CONCLUSION
The quantification of HDAC2 expression in the present study confirms its association with skeletal muscle development in chickens, especially during the embryonic and also in growing periods. The in vitro study of HDAC2 in chicken primary myoblasts suggests possible negative and positive regulatory roles during cell proliferation and differentiation, respectively. These two aspects of skeletal muscle development interact to determine the extent of the myoblast population at hatching, and presumably the potential for subsequent muscle growth. Accordingly, HDAC2 can be identified as a novel candidate functional gene worthy of additional study for its potential value in molecular-assisted breeding of poultry.
ACKNOWLEDGMENTS
The authors would like to acknowledge Dr. W. Bruce Currie (Emeritus Professor, Cornell University, USA) for his assistance in preparing the manuscript. The research was supported by grants: the National Natural Science Foundation of China (31201797); the Agricultural Science and Technology Innovation Program (ASTIP-IAS04); the earmarked fund for modern agro-industry technology research system (CARS-42).
Notes
CONFLICT OF INTEREST
We certify that there is no conflict of interest with any financial organization regarding the material discussed in the manuscript.