SNP Discovery from Transcriptome of Cashmere Goat Skin
Article information
Abstract
The goat Capra hircus is one of several economically important livestock in China. Advances in molecular genetics have led to the identification of several single nucleotide variation markers associated with genes affecting economic traits. Validation of single nucleotide variations in a whole-transcriptome sequencing is critical for understanding the information of molecular genetics. In this paper, we aim to develop a large amount of convinced single nucleotide polymorphisms (SNPs) for Cashmere goat through transcriptome sequencing. In this study, the transcriptomes of Cashmere goat skin at four stages were measured using RNA-sequencing and 90% to 92% unique-mapped-reads were obtained from total-mapped-reads. A total of 56,231 putative SNPs distributed among 10,057 genes were identified. The average minor allele frequency of total SNPs was 18%. GO and KEGG pathway analysis were conducted to analyze the genes containing SNPs. Our follow up biological validation revealed that 64% of SNPs were true SNPs. Our results show that RNA-sequencing is a fast and efficient method for identification of a large number of SNPs. This work provides significant genetic resources for further research on Cashmere goats, especially for the high density linkage map construction and genome-wide association studies.
INTRODUCTION
The domestic goat (Capra hircus) is widely reared throughout the world and serves as an important source of meat, milk, fiber and pelts. Inner Mongolia white Cashmere goat (Capra hircus) is an important economic breeding animal in China. Cashmere is the important economic trait in Cashmere goat, and the quantity and quality of cashmere are associated mainly with the traits of skin follicle. The skin follicle is a unique, highly regenerative neuroectodermal-mesodermal interaction system, containing a large number of stem cells (Krause and Foitzik, 2006). The hair follicle cycles throughout the entire life of mammals to produce new hair through stages of growth (anagen), regression (catagen) and quiescence (telogen) (Stenn and Paus, 2001).
In recent years, genetic information based on molecular markers has increasingly been used in goat breeding improvement programs. Knowledge of molecular mechanisms underlying desired traits can guide selective breeding, but the available genetic markers in the public database for this species are limited.
Single nucleotide polymorphism (SNP) markers can be documented to link genotypes to functional phenotypes of interest (Liao and Lee, 2010). Several studies have shown SNPs have potential as molecular markers for cashmere fiber quality (Lan et al., 2009; Zhou et al., 2011; Wang et al., 2012), milk traits (Li et al., 2010; Hou et al., 2013; Zhao et al., 2013; Hou et al., 2014), litter size (Chu et al., 2011) and growth traits (Cai et al., 2014) in goats. Traditionally, SNP discovery is achieved through comparing sequences of candidate genes or other genomic regions from a number of representative lines or individuals. However, this approach is time consuming and costly (Shu et al., 2011). Due to the rapidly growing number of genome sequencing projects, transcriptome sequencing (RNA-seq) has become a major method to comprehensively identify SNPs from transcribed regions for non-model organisms (Barbazuk et al., 2007; Garvin et al., 2010; Helyar et al., 2012; Yu et al., 2014). Through transcriptome sequencing, functional genes could be sequenced at high coverage, which is conducive to full-scale SNP discovery in coding genes. In this study, we performed a SNP discovery analysis in the skin transcriptomes of Cashmere goats at four stages and characterized these SNPs. We also validated the predicted SNPs. These SNPs are expected to provide useful resources especially for population genetics, genome-wide association studies and molecular breeding of Cashmere goats.
MATERIALS AND METHODS
Tissue samples
The goats were housed under the same environment with free access to feed and water at the Aerbasi White Cashmere Goat Breeding Farm (Inner Mongolia, China). The skin samples were collected from the lateral body of four two-years-old goats at four distinct hair cycle stages. March, June, September, and December represent telogen, early anagen, cashmere fast-growing period, and catagen, respectively. A total of sixteen samples were collected and stored in liquid nitrogen.
RNA isolation and detection
Total RNA was extracted using the Trizol method and treated with RQ1DNase (Promega, Madison, WI, USA) to remove DNA. The quality and quantity of the purified RNA were determined by measuring the absorbance at 260 nm/280 nm (A260/A280) using smartspec plus (BioRad, Hercules, CA, USA). RNA integrity was further verified by 1.5% Agarose gel electrophoresis, and then further sequencing was conducted with pooled RNA samples from each stage.
cDNA library construction and high-throughput sequencing
Construction of cDNA library was independently prepared using 10 μg of total RNA extracted from samples at each of the four stages. Polyadenylated mRNAs were purified and concentrated with oligo (dT)-conjugated magnetic beads (Invitrogen, Carlsbad, CA, USA) before being used for directional RNA-seq library preparation. Purified mRNAs were iron fragmented at 95°C followed by end repair and 5′ adaptor ligation. Reverse transcription was performed with Reverse transcriptase primer harboring 3′ adaptor sequence and randomized hexamer. The cDNAs were purified and amplified and PCR products corresponding to 200 to 500 bps were purified, quantified and stored at −80°C until used for sequencing. For Illumina sequencing, the cDNA libraries were prepared following the manufacturer’s instructions and applied to Hiseq 2000 system (Gene Denovo Co, Guangzhou, China) for 100 nt paired-end sequencing by Majorbio Inc (Shanghai, China).
Reads mapping and SNP detection
The genome sequence of Capra hircus breed Yunnan black goat and the gene annotation were downloaded from Goat Genome Database (GGD) (http://caprinae.kiz.ac.cn/). Sequence reads without Ns passed the quality filter and the adapter sequences from read ends were removed. The remaining reads were aligned to the genome using TopHat2 (http://ccb.jhu.edu/software/tophat/index.shtml) allowing at most one mismatch. SNPs were detected using mpileup in SAMtools (http://samtools.sourceforge.net/, free software) (tools for alignments in the SAM format), SAMtools can identify single base substitutions as well as small insertions and deletions; however, only SNPs were considered in the current analysis. A detected SNP was kept only if the read depth was more than 10 and the quality score was over 20. Gene expression was calculated measuring the read per kilobases per million mapped reads (RPKM) values, which were normalized by total reads.
Collecting SNP statistics
SNP frequency was calculated by dividing 1 kb of reference by number of SNPs (Num_per_killobase). SNP information such as SNP distribution among genes, SNP distribution across genomic regions, SNP depth and Minor allele frequency (MAF) were extracted from the result file of SAMtools. Functional effects of SNPs (e.g., intergenic, 5′UTR, 3′UTR, CODING) were carried out using SnpEff (Cingolani et al., 2012).
Functional annotation of detected SNPs
Genes containing SNPs were annotated by Blast2GO (https://www.blast2go.com/) with Gene Ontology (GO) terms under the categories of biological processes, molecular functions, and cellular components at level 2 (Götz et al., 2008). Annotated information was imported into BGI WEGO program (http://wego.genomics.org.cn/cgi-bin/wego/index.pl) in WEGO native format. KEGG pathway analyses were conducted using the online KEGG Automatic Annotation Server (http://www.genome.jp/kegg/).
SNP validation
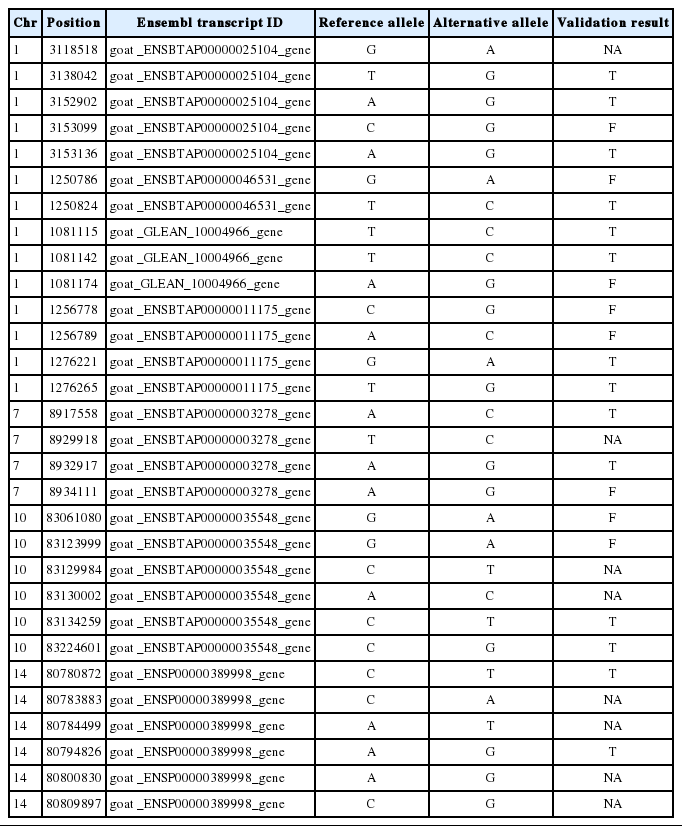
To validate the accuracy of detected SNPs, we randomly selected 30 SNPs for SNP validation by Sanger sequencing using DNA as templates. Primers were designed to amplify the flanking sequence of selected SNPs using Primer 5 (Premier biosoft, Palo Alto, CA, USA) with a fragment length of 200 to 500 bp. Primers were synthesized by Sango Biotech (Shanghai, China) and are listed in Table S2. Thirty individuals were used for construction of the DNA pool, which were sequenced by Taihegene Biotechnology Co., Ltd. (Beijing, China).
RESULTS
Transcriptome sequencing
RNA sequencing obtained a total of 19 G data, each stage average 4.7 G data. The sequencing results demonstrated that 77% to 82% reads with high quality of 97 nucleotides (nt) were mapped to the reference goat genome and 91% to 93% unique-mapped-reads were obtained from total reads at the four stages. QC results in each sample are listed in Table 1 and tell us that the probability that the corresponding base call is incorrect is less than 0.001. Quality score across all bases of March skin sample is shown in Figure 1.
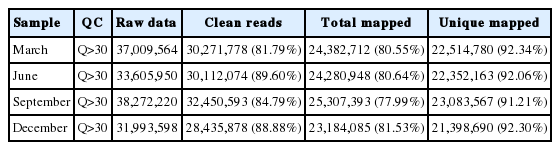
Quality control results and the high-quality clean reads of each sample
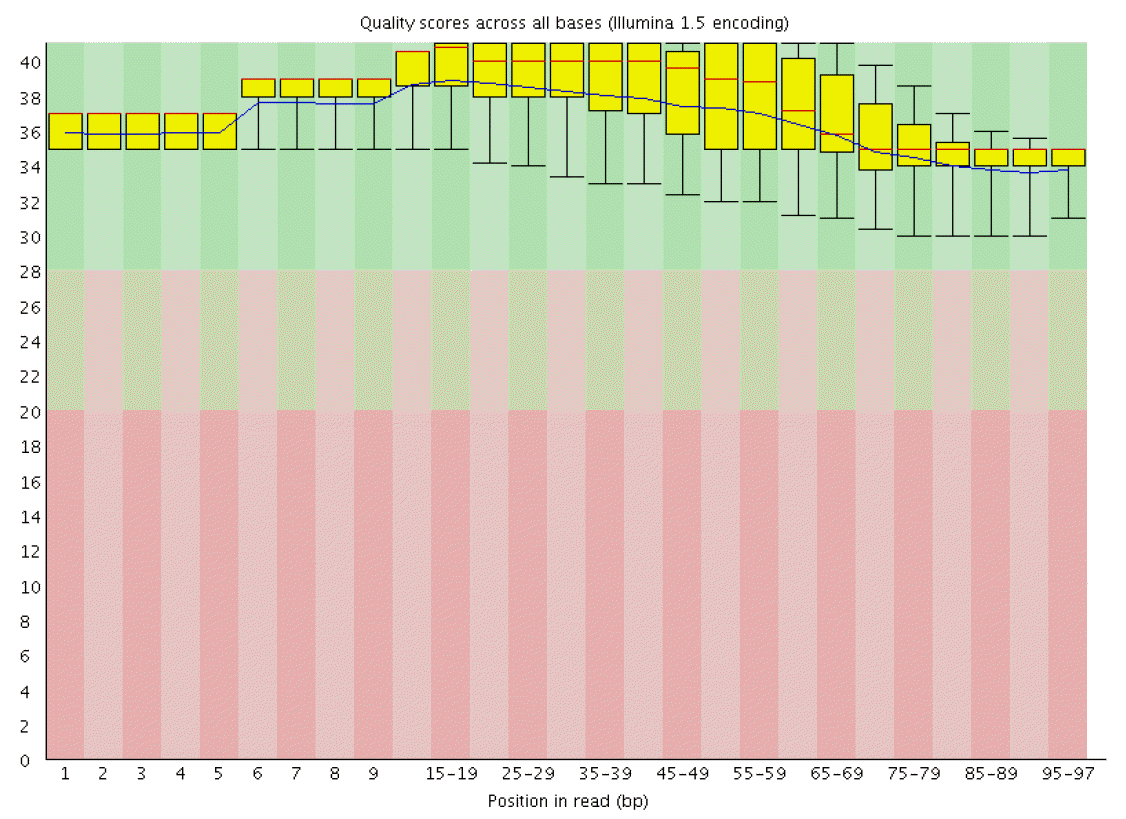
Quality score across all bases of March skin sample.
SNP statistics
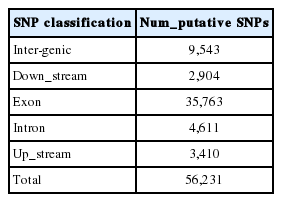
Using the reference goat genome, we identified a total of 56,231 putative SNPs for the four stages. The detailed SNP information is provided in Table S1. Among the 56,231 putative SNPs, 63.6% were found in coding sequence (CDS) regions, 28.2% in intergenic regions, and 8.2% in introns (Figure 2). As shown in Table 2, of the 56,231 putative SNPs, 35,763 SNPs (63.6%) were identified in exons, which were highly represented, while 4,611 SNPs (8.2%) were identified in the introns, which were lowly represented.
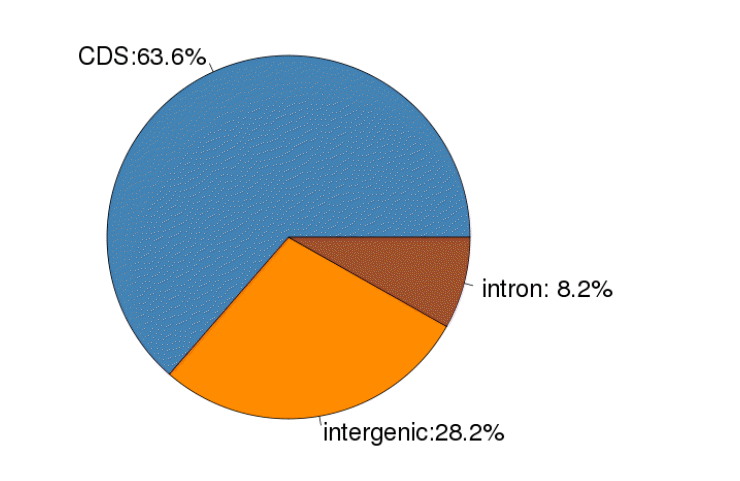
Single nucleotide polymorphism occurrence over coding sequence, intron, and intergenic genomic regions.
Classification of putative SNPs
A total of 20201 expressed genes (RPKM>0) were detected and 18,433 were annotated among them. We also analyzed the occurrence statistics of SNP in annotated genes. A total of 10,057 genes containing SNPs were identified. On the average, there are 5.59 SNPs per gene. Among these genes, genes with 1 SNP were more common and those with less than 10 SNPs accounted for 93.6% of all SNP containing and expressed genes. The number of genes with 11 to 15 SNPs per gene is 445 and there were 20 genes harboring more than 30 SNPs per gene. The histogram of the number of SNPs per gene is shown in Figure 3. In order to investigate the mutation rate among genes, the SNP frequency within genes was calculated. The top twenty annotated genes with the highest SNP frequency are listed in Table 3.
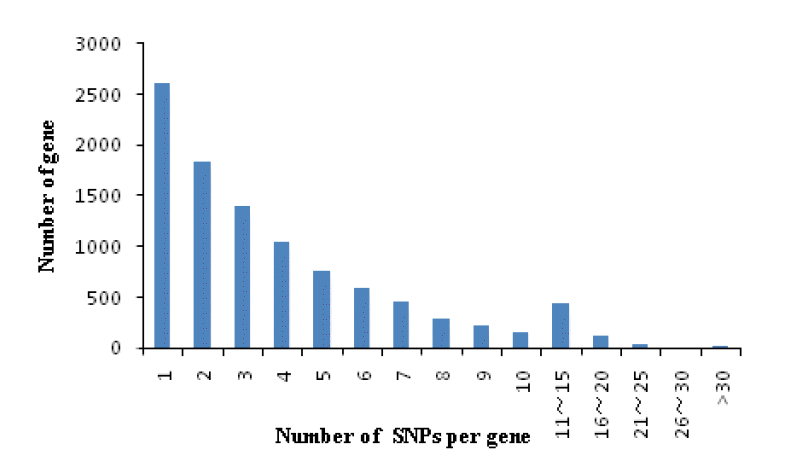
Single nucleotide polymorphism (SNP) distribution among genes. The horizontal axis represents number of SNPs per gene.
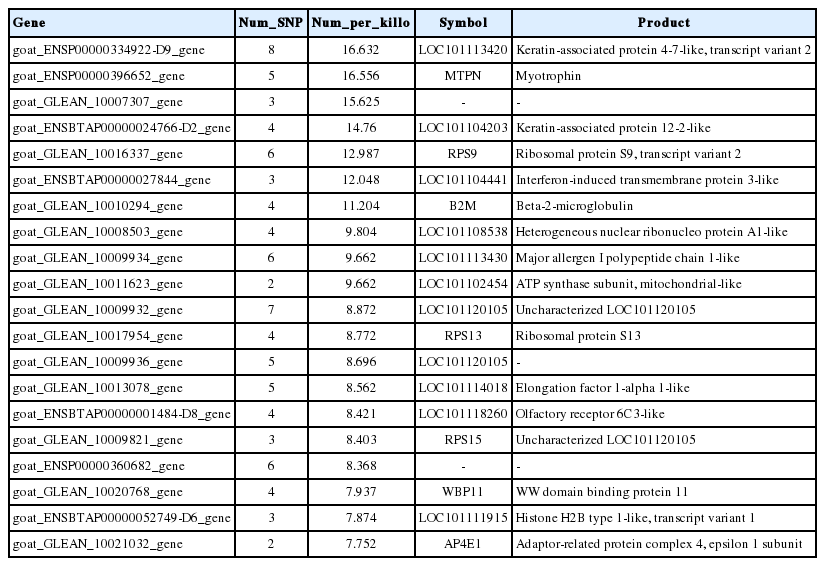
The top twenty annotated genes with the highest SNP frequency
The read depth for each SNP was calculated based on the sequence data. The majority of SNPs (57.2%) have a read depth between 10 and 50, while 20% SNPs have read depths ranging from 51 to 100 (Figure 4).

Statistics of single nucleotide polymorphism (SNP) read depth in Cashmere goat skin transcriptome. The horizontal axis represents the read depth of SNPs. The vertical axis represents the number of SNPs with the corresponding read depth.
MAF was the frequency of the less common allele of a polymorphic locus in a given population. The average MAF was 18% in putative SNPs identified from the skin transcriptomes of Cashmere goats (Figure 5). As only SNPs with MAF more than 0.05 are regarded as true SNPs. SNPs with more than 0.05 MAF accounts for the 79.9% and the average MAF of the considered true SNPs was 22%.
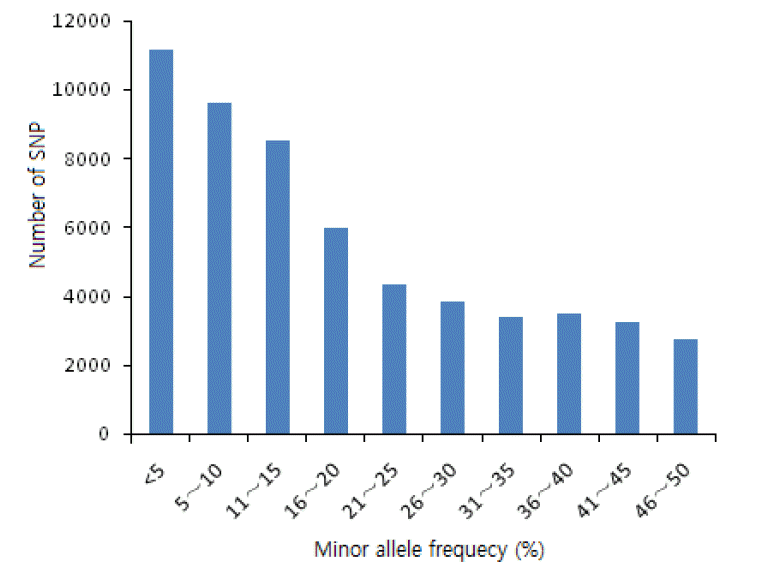
Statistics of minor allele frequency (MAF) of discovered single nucleotide polymorphisms (SNPs) in Cashmere goat skin transcriptome. The horizontal axis represents the SNP MAF in percentage, while the vertical axis represents the number of SNPs with given MAF. The average MAF is 0.18.
Functional annotation of SNP
After the GO annotation, 9,392 expressed genes containing SNPs were assigned with one or more GO terms. The plotted GO annotations of these annotated genes are shown in Figure 6. For the cellular component, the major categories were cell and cell part. For molecular function, genes involved in the binding and catalytic activity are highly represented. Under the GO category of biological process, cellular process was the most represented GO term, followed by metabolic process and biological regulation. The GO categories of expressed genes containing SNPs were in the same proportion to the GO categories of all expressed gene.
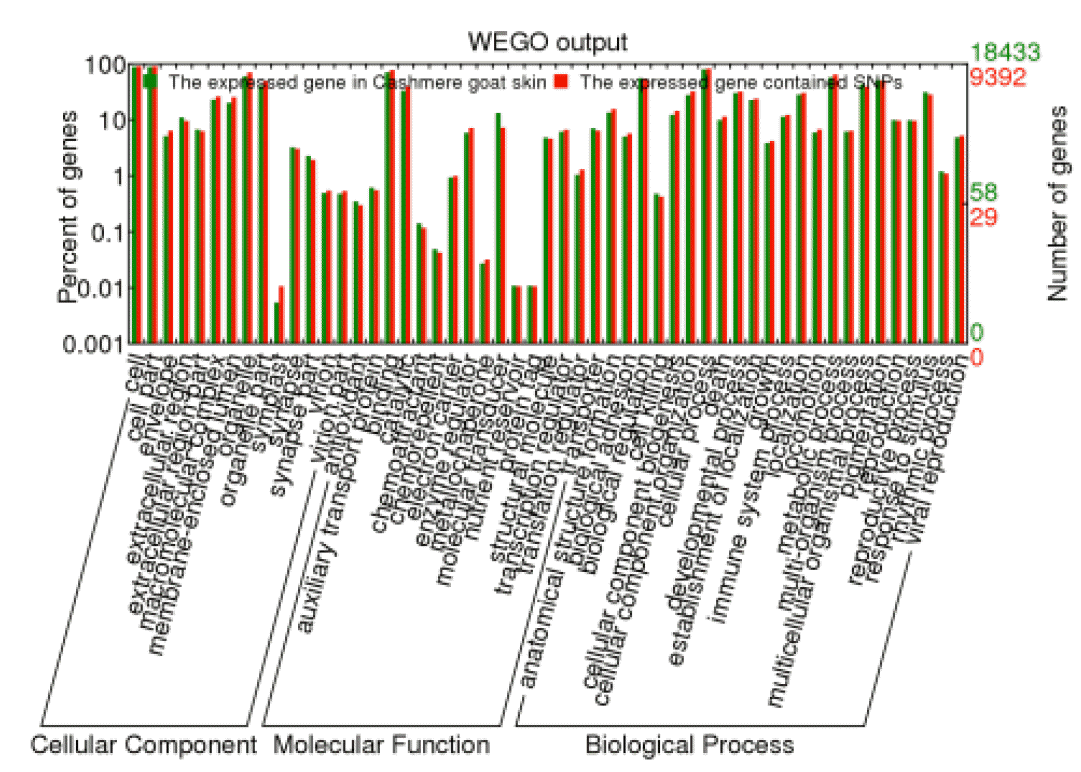
Gene ontology of all annotated genes in Cashmere goat skin transcriptome and the expressed single nucleotide polymorphism-containing genes.
KEGG pathway analysis categorizes gene functions by biochemical pathways. A total of 2381 expressed genes were assigned with one or more KEGG annotation and were assigned to 304 KEGG pathways. Of these KEGG pathways, metabolic pathways including carbon fixation, nitrogen metabolism, lipid metabolism contains the most annotated genes. Forty genes were classified into the Wnt signaling pathway. TGF-beta signaling pathway contains 27 annotated genes and 36 genes were classified into the NF-kB signaling pathway. The top 10 KEGG pathway classification of the top 200 highly expressed gene contained SNP (Figure 7).
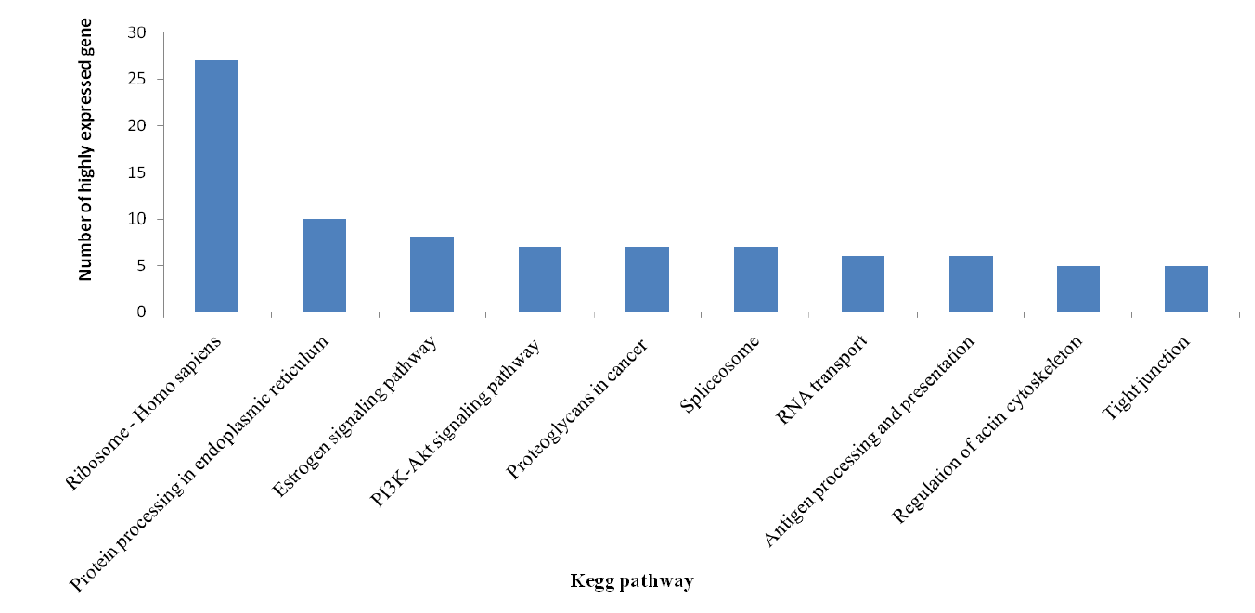
The top 10 KEGG pathway classification of the top 200 highly expressed gene contained single nucleotide polymorphism.
DISCUSSION
The transcriptome consists of all RNA transcripts, coding or non-coding, expressed within a given cell or tissue. Most functional genes at the corresponding developmental stage could be involved in the transcriptome. RNA sequencing allows for the deep and efficient probing of transcriptome. It provides a resource for gene-associated SNP discovery (Yu et al., 2014), analysis of RNA-protein interactions (Sultan et al., 2008), transcriptome characterization (Cloonan et al., 2008) and analysis of alternative splicing (Sultan et al., 2008). In this study, we conducted RNA-seq analysis with Cashmere goat skin at four developmental stages to develop a large number of putative gene-related SNPs for Cashmere goat. The results show that 56,231 putative SNPs were identified in the transcriptomic regions of Cashmere goat skin. Because of poor genome annotation, potential sources of the SNP uncovered in the intergenic regions (28.2%) were difficult to determine, and still this work is an important step towards developing SNP markers for this species.
The most confident SNP are in the genes with highest expression in the target tissue, so naturally there will be more SNP found in those pathways as compared to genes with low to moderate expression and the pathways of the highly expressed gene may play an important role in activities of the target tissue. The top 10 KEGG pathways of the highly expressed gene were plotted in Figure 6 and this provides a clue to the later related work.
Read depth is a key parameter affecting the prediction accuracy of SNPs (Li et al., 2013) and could lead to a prohibitive sequencing cost at the required depth. Since the goat genome annotation of genes is fairly rudimentary the biology of transcription and transcript processing can introduce variation not present in the genome or lead to mis-mapping of reads. We used paired-end reads to increase the base coverage within expressed genes in a sample and as a result improved SNP detection sensitivity.
MAF is an important factor for identifying SNP loci. As reported previously, it is considered an estimation of true allele frequency (Van Tassell et al., 2008). SNPs with MAF ranging from 0.05 to 0.5 accounted for 79.9% of the total SNPs.
The results of the functional annotation indicated that the detected SNP-containing genes in Cashmere goat skin are involved in wingless-related integratio (Wnt), tumor necrosis factors (TNF), and transforming growth factor beta (TGF-β) signaling pathways. Previous to this report, Wnt, nuclear factor kappa-light-chain-enhancer of activated B cells (NF-kB) and TGF-beta signaling pathway have been the subjects of extensive investigation for several decades. All of these have been reported to be likely involved in follicle development and epidermal-dermal interactions in the mammalian skin (Saitoh et al., 1998; Monreal et al., 1999; Schmidt-Ullrich and Paus, 2005; Ouji et al., 2006). Several genetic studies have suggested that the hair follicle transition is associated with the event involving the activation of Wnt/beta-catenin/Lef-1 signaling (Plasari et al., 2010). In the current study, SNP-containing genes in Cashmere goat skin are involved in Wnt signaling, these data give us a clue that SNP-containing genes in Cashmere goat skin might play a role in the process of hair follicle transition. In addition, Jiang et al. (2014) discovered that some genes which differentially expressed at early anagen of cashmere growth cycle were mainly involved in TGF-beta receptor signaling pathway and may play key roles in cashmere follicles initiation and development, and therefore these SNPs from Cashmere goat Skin transcriptome may provide important insights into the functional properties of skin regulative genes. It will be important to extend the studies described in this paper to determine whether the SNP-containing genes play any role in follicle development and, if so, to further characterize their role in epidermal-dermal interactions.
IMPLICATIONS
In conclusion, 56,231 putative SNPs were identified by the transcriptome sequencing of the Cashmere goat skin. A large proportion of randomly selected SNPs were verified using the Sanger sequencing, suggesting the high validation rate. This work serves as a basis towards developing SNP markers and provides valuable resources for functional properties of genes containing SNPs in the Cashmere goat.
Supplementary Data
ACKNOWLEDGMENTS
The reported work was supported by the National Natural Science Foundation of China (No. 31260539,31201773,31272421), Excellent Young Scientist Foundation of Inner Mongolia Agricultural University of China (No.2014XYQ-1), Research and Development Planning of National High Technology (No.2013AA100506), China Agriculture Research System (No.CARS-40-05) and Grants-in Project Special Fund for Agro-scientific Research in the Public Interest (No.201303059).
Notes
CONFLICT OF INTEREST
We certify that there is no conflict of interest with any financial organization regarding the material discussed in the manuscript.