Relationships between Descriptive Sensory Attributes and Physicochemical Analysis of Broiler and Taiwan Native Chicken Breast Meat
Article information
Abstract
Unique organoleptic characteristics such as rich flavors and chewy texture contribute to the higher popularity of native chicken in many Asian areas, while the commercial broilers are well-accepted due to their fast-growing and higher yields of meat. Sensory attributes of foods are often used to evaluate food eating quality and serve as references during the selection of foods. In this study, a three-phase descriptive sensory study was conducted to evaluate the sensory attributes of commercial broiler (BR) and Taiwan native chicken (TNC) breast meat, and investigate correlations between these sensory attributes and instrumental measurements. The results showed that for the first bite (phase 1), TNC meat had significantly higher moisture release, hardness, springiness, and cohesiveness than BR meat. After chewing for 10 to 12 bites (phase 2), TNC meat presented significantly higher chewdown hardness and meat particle size, whereas BR meat had significantly higher cohesiveness of mass. After swallowing (phase 3), TNC meat had higher chewiness and oily mouthcoat and lower residual loose particles than BR meat. TNC meat also provided more intense chicken flavors. This study clearly demonstrates that descriptive sensory analysis provides more detailed and more objectively information about the sensory attributes of meats from various chicken breeds. Additionally, sensory textural attributes vary between BR and TNC meat, and are highly correlated to the shear force value and collagen content which influence meat eating qualities greatly. The poultry industry and scientists should be able to recognize the sensory characteristics of different chicken meats more clearly. Accordingly, based on the meat’s unique sensory and physicochemical characteristics, future work might address how meat from various breeds could best satisfy consumer needs using various cooking methods.
INTRODUCTION
Sensory attributes, such as appearance, odor, flavor, taste, and texture of foods detectable by human senses, are often used to evaluate food quality. These characteristics may also serve as references during the selection of foods (Lyon and Lyon, 2001). Descriptive sensory analysis is an analytical sensory evaluation method that involves the discrimination and description of sensory components of products by a trained panel (Murray et al., 2001). Descriptive sensory panelists are screened and trained to evaluate specific characteristics based on the results of a discrimination and description analysis (Lyon and Lyon, 2001; Murray et al., 2001). Trained panelists should be capable of identifying and quantifying the specific attributes, and providing information regarding the instrumental and sensory measurements of foods (Lyon and Lyon, 2001).
Chicken meat has relatively low fat and cholesterol contents; it is recognized as a healthier food option compared to red meat (Jaturasitha et al., 2008). Poultry offers several advantages over red meat that account for an increasing trend in chicken consumption; it is cheaper, cuts are easier to handle, and the meat is associated with fewer religious restrictions (Liu et al., 2012). The global production of broiler (BR) meat increased from 73.1 million tons in 2008 to 83.1 million tons in 2012 (USDA, 2012). In many Asian countries, including China, Taiwan, and Korea, the per capita chicken meat consumption showed dramatic increases during recent decades, which was followed by steady growth thereafter (Liu et al., 2012). In the chicken industry, breeding companies have developed fast-growing BR strains to produce chicken meat for global consumption (Jaturasitha et al., 2008); BR grown under an intensive rearing regime are harvested at 5 to 6 wk with live weights of approximately 1.5 kg, to provide high yields of meat (Huang et al., 2007). Native chickens are reared in response to specific requests (Wattanachant et al., 2005). In Taiwan, slow-growing Taiwan native chicken (TNC) have rearing times of approximately 15 to16 wk, and achieve live weights of 2 to 2.5 kg (Huang et al., 2007; Cheng et al., 2008). A Taiwan governmental survey found that TNC accounts for more than half of the chicken meat consumption in Taiwan (COA, 2011). The unique organoleptic characteristics of native chicken are preferred in Chinese or Korean cuisine for the rich flavors and superior texture that they impart (Huang et al., 2007; Jayasena et al., 2013). As comparing the quality traits of meat from Korean native chicken and BR, Jayasena et al. (2013) commented that it helps consumers to recognize the meat available for their preferred traditional cuisines more clearly. Similarly, Jaturasitha et al. (2008) reported that Thai consumers prefer the unique chewy texture and taste of native chicken, and this preference had resulted in the rapidly growing popularity of native chicken in Thailand. This illustrates how consumer preference might be a major factor in the differences in market share for various types of chicken meat in Asian countries, in contrast with the West, where BR account for almost all chicken consumption (Cheng et al., 2008).
When evaluating the sensory attributes of products, people, whether consumers or sensory panelists, respond based on their perceptions. However, some characteristics, such as color and texture, can also be quantitatively measured using instruments. Instead of measuring sensory characteristics directly, instruments measure the physicochemical properties of samples that provide stimuli to human senses. By using sensory analysis, producers can identify and respond to consumer preferences more efficiently, thus increasing their competitiveness and segmenting their specific market (Sow and Grongnet, 2010). Correlations between instrumental measurements and sensory characteristics of poultry meat have been reported. Lyon and Lyon (1997) evaluated the sensorial descriptive texture profiles of cooked chicken breast as related to the tenderness which determined and expressed using shear force values. Cavitt et al. (2004) commented that shear force value and sarcomere length determined instrumentally could be applied to predict the descriptive sensory hardness of broiler breast meat. Liu et al. (2004) found that shear force values of broiler breast meat were highly correlated with some sensory textural attributes such as cohesiveness, hardness, particle size, bolus size, and chewiness. Understanding and interpreting the relationship between the results of human evaluation and instrumental measurements for specific sensory characteristics of foods is critical. However, basic information about the descriptive sensory quality attributes of BR and native chicken, and the relationship between human- and instrument-based methods is poorly documented. The objectives of this study were (a) to compare the descriptive sensory attributes of TNC and commercial BR breast meat at marketing ages, and (b) to interpret the relationship between descriptive sensory attributes and physicochemical analysis of chicken breast meat.
MATERIALS AND METHODS
Sample collection and preparation
In this study, 60 female TNC and 60 broilers (BR) at conventional marketing ages of 16-wk and 5-wk old, respectively, were obtained from commercial farms. All experimental chickens were raised under the conventional conditions, including suggested commercial diets and feeding schedule management, and were then slaughtered at a veterinary-inspected abattoir under conventional conditions when they reached the targeted ages (i.e. 16-wk old TNC and 5-wk old BR). After chilling at 4°C for 24 h, carcasses were dissected manually. The right breast of each specimen was minced for proximate composition and collagen content analysis, and pH measurement; the left breast was inserted with an input digital thermometer (RIXEN-T60 type-K, Taichung, Taiwan) and individually placed in a polyethylene bag and cooked in an 85°C water bath until the internal temperature of the meat reached 80°C according to the methods of Lyon and Lyon (1997). After tempering at room temperature for approximately 10 min, cooked samples were evaluated for shear force value and descriptive sensory analysis.
Physicochemical analysis
Proximate composition and pH value
Proximate analysis was performed to determine moisture, crude fat and crude protein contents according to the AOAC (1995) methods. The pH values of samples were determined by homogenizing muscle samples with distilled water in a 1:5 ratio (wt/vol) and measured using a pH meter (PHM210 Standard pH Meter, Tacussel, France) (Wattanachant et al., 2004).
Total collagen and soluble collagen contents
Total collagen and soluble collagen contents were determined according to the methods of Wattanachant et al. (2004) with some modifications. For the total collagen content, finely ground muscle (500 mg) was hydrolyzed with HCl (6 M, 25 mL) at 110°C for 24 h. The hydrolysate was filtered through Whatman number 2 filter paper, neutralized with NaOH (10 M and 3 M), and diluted with distilled water to a final volume of 100 mL. The absorbance of samples at 560 nm and hydroxyproline standards were determined using a spectrophotometer (Hitachi U-2900, Toyko, Japan). Hydroxyproline standards and hydroxyproline content in hydrolysate were extrapolated from the standard curve and converted to collagen content using the formula:
For determination of soluble collagen content, muscle samples (2 g) were homogenized with 25% Ringer’s solution (8 mL), comprising NaCl (32.8 mmol/L), KCl (1.5 mmol/L) and CaCl2 (0.5 mmol/L). The homogenates were heated at 77°C for 70 min, and then centrifuged (2,300×g) at 4°C for 30 min. After extraction twice, the supernatants were combined. The sediment and supernatant were determined separately; each was hydrolyzed using 6 M HCl at 110°C for 24 h. The total collagen content was determined as the sum of collagen content in the sediment plus that in the supernatant, and the amount of heat-soluble collagen was expressed as a percentage of the total collagen content.
Cooking loss, color, and shear force value
After cooking the chicken meat samples as described, samples were weighed to determine the cooking loss as:
The color of cooked meat was determined according to the method of Wattanachant et al. (2005) in three locations of each sample using a colorimeter (NR-3000, Nippon Denshoku Ind. Co., Ltd., Osaka, Japan) and reported as the L* (lightness), a* (redness), and b* (yellowness) values. The shear force value was determined according to the method of Wattanachant et al. (2004) with modifications. Cooked samples were cut into pieces of approximately 2.0×1.0×0.5 cm, and shear analysis was performed (Model Compac-100, Sun Scientific Co., Tokyo, Japan). The crosshead speed was set to 240 mm/min and a 10-kg load cell was used. A shear analysis was applied perpendicularly to the muscle fiber axis, and measured with 40 replicates per breed. The peak of the shear force value profile was recorded as the shear force value.
Sensory evaluation
Sample preparation
After cooking as described above, external connective tissue was trimmed and 2.0-cm-wide strips were removed from the breast by cutting next to a template aligned parallel to the muscle fibers, and then cut into cubes of approximately 2.0×2.0×2.0 cm. Each panelist received 5 cubes which were placed in capped 4 once Styrofoam cups labeled with 3-digit blinding codes (Sow and Grongnet, 2010).
Sensory panel and descriptive sensory evaluation
A descriptive sensory evaluation was conducted using a modification of the Sow and Grongnet (2010) method. In this study, 14 meat science graduate students (8 males, 22 to 25-y old and 6 females, 22 to 30-y old) who were previously screened were selected to participate in a training course comprising 12 group discussions. Each session lasted 3 h, and focused on the sensory characteristics of chicken meat. The training panelists learned to identify the sensory attributes required for describing the appearance, flavor and texture of chicken meat. References and scales were also developed during the training sessions. Definitions of each sensory characteristic are provided in Table 1 (Cavitt et al., 2004; Zhuang and Savage, 2011). The descriptive sensory analysis consisted of evaluation of meat attributes for each of three phases: the first bite (phase 1), after chewing for 10 to 12 bites (phase 2) and after swallowing (phase 3). The panelists evaluated the intensity of attributes and marked their responses on a 7-point scale, where 1 = low and 7 = high for texture and flavor attributes. For the appearance of cooked samples, meat color (1 = light, 7 = dark) and fiber texture (1 = fine, 7 = coarse) were determined at the samples’ cut surfaces. Panelists were provided with unsalted crackers and water for mouth-cleansing between samples (Zhuang and Savage, 2011).

Sensory attributes and definitions used by the descriptive analysis panel to evaluate test samples
Statistical analysis
The experiment was replicated for 3 times and the data were analyzed by the analysis of variance and the linear model in the Statistical Analysis System’s Procedures (Version 9.1, SAS Institute Inc., Cary, NC, USA). The paired t-test was applied to analyze the significant differences between the mean averages for chicken breeds. Pearson correlation coefficients were evaluated using the Proc Corr procedure to determine relationships between sensory attributes and instrumental analysis.
RESULTS AND DISCUSSION
Table 2 shows that raw BR meat had a higher pH value than TNC meat (p<0.001), whereas no significant difference in moisture content was observed (75.54% vs 74.73%). Chuaynukool et al. (2007) reported that BR breast meat had significantly higher moisture content (76.62%) and pH value (6.23) compared to Thai native chicken samples (74.39% and pH 5.93, respectively). Jaturasitha et al. (2002) proposed that the lower pH levels observed in native chicken meat resulted from the effects of more aggressive behavior in native chicken. They indicated that the greater stresses experienced by native chicken caused more glycogens to be metabolized, consequently affected postmortem glycolysis, lead to lactic acid accumulation, and thus resulted in lower pH values in meat. After cooking, BR meat had significantly higher cooking losses than TNC meat (25.55% vs 16.04%, p<0.001), in agreement with Jaturasitha et al. (2002), and Chuaynukool et al. (2007) who reported that native chicken meat had higher water holding capacity and experienced fewer losses during cooking than BR meat. Jaturasitha et al. (2002) found that during cooking, denaturation and melting of the endomysium as well as denaturation of the myofibril led to the loss of water holding capacity in BR meat protein, and thus, moisture in BR meat was easily released after cooking. Increased cooking losses reduced juiciness, and resulted in a less palatable meat.
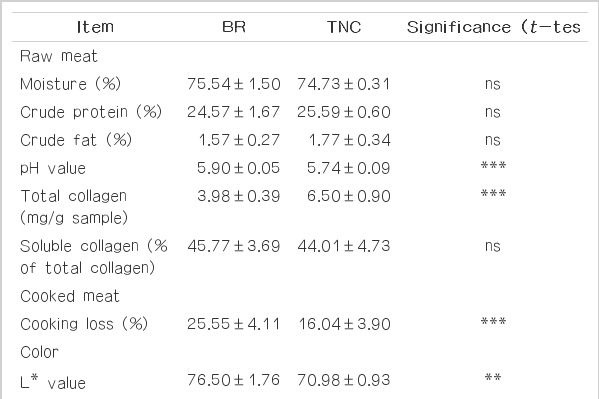
Instrumental analyses of broiler (BR) and Taiwan native chicken (TNC) breast meat
Generally, there are two types of sensory evaluation methods. Consumer affective method employs a larger number of panelists to measure how consumers feel or react to a product. Information obtained using this method is typically used to measure the acceptance, preferences, and likes or dislikes of products (Lyon and Lyon, 2001). For example, Bou et al. (2004) recruited panelists to evaluate the meat from chickens fed with different levels of dietary supplements. In their study, they applied a 9-point scale (1 = very bad; 9 = very good) to evaluate the acceptability of samples. In addition to acceptability, Cheng et al. (2008) applied a 7-point hedonic scale to compare the likeness in sensory characteristics including aroma, flavor, firmness, tenderness, and juiciness of conventional versus free-ranged chickens. The result obtained in those studies basically is mainly acceptance or preference of samples or not. Contrarily, descriptive sensory analysis is an analytical method which can provide more detailed information, such as the intensity of specific sensory characteristics. Some descriptors of sensory attributes in chicken meat were defined and applied to train panelists to evaluate samples (Dyubele et al. 2010; Sow and Grongnet, 2010). Moreover, some food examples might be provided as references during training and evaluation in order to increase the accuracy of judgment.
Texture, defined as “a sensory and functional manifestation of the structural, mechanical and surface properties of foods detected through the senses of vision, hearing, touch and kinesthetics” by Szczesniak (2002), comprises complicated characteristics that can be sensed and evaluated though human senses. Cavitt et al. (2004) and Zhuang and Savage (2011) evaluated descriptive texture characteristics of chicken meats at multi-stages. Similarly, in the current study, we conducted a three-phase, including the first bite (phase 1), after chewing for 10 to 12 bites (phase 2) and after swallowing (phase 3) descriptive evaluation to assess the sensory attributes of BR and TNC breast meat. In this study, moisture release, defined as “the amount of wetness felt in the mouth after the first bite” is a comprehensive sensation that arises from the total fluids released into the mouth. Table 3 shows that during phase 1, TNC meat had significantly higher moisture release compared with BR meat (3.33 vs 2.73, p<0.01). In addition to high water retention resulting from reduced cooking losses, a higher crude fat content probably partially contributed to the greater perceived moisture release in native chicken meat. High negative correlations (r = −0.70 to −0.81) were observed between moisture release by panelists and cooking loss measurement values (Tables 4 and 5). Native chicken meat produced significantly higher hardness during phase 1 (3.48 vs 2.28, p<0.001), and chewdown hardness (4.00 vs 2.92, p<0.001) in phase 2 (Table 3). Many studies have shown that the meat of slow-growing or older breeds, such as the native chicken evaluated in the current study, was less tender when compared with the meat from fast-growing BR (Fanatico et al., 2007). Table 2 illustrates that TNC meat had a significantly higher total collagen content (6.50 mg/g sample) than BR meat (3.98 mg/g sample). Wattanachant et al. (2004; 2005) and Chuaynukool et al. (2007) reported that meat of Thai native chicken at the marketing age of 16 wk contained higher total collagen than those of 38 d commercial BR. Similarly, higher total collagen in meat of Taiwan country chicken (16-wk old) than those in BR (8-wk old) was also reported (Lee and Lin, 1993). Chuaynukool et al. (2007) explained that breed and/or age of bird at slaughter might result in different collagen content in chicken meat. Elevated collagen levels and highly cross-linked collagen were found in the muscle tissue of native chicken, compared to the levels in BR, and might explain the toughness of native chicken meat (Jaturasitha et al., 2002). When evaluating meat tenderness by using instrumental methods, we observed that TNC meat had significantly higher shear force value than BR meat (2.40 vs 1.89 kg/cm2, p<0.001). High correlations were observed between the collagen content and descriptive sensory hardness (r = 0.77 to 0.91). Chuaynukool et al. (2007) reported significantly higher shear force value for Thai native chicken meat compared to BR chicken meat. We found that descriptive sensory hardness exhibited a high correlation with shear force value (r = 0.91), and chewdown hardness was highly correlated with shear force value (r = 0.82 to 0.85). These findings are in good agreement with a report by Cavitt et al. (2004). When evaluating the influence of deboning time on the texture profiles of cooked chicken breast, Lyon and Lyon (1997) reported that instrumental measurements of shear values were highly correlated with descriptive chewdown hardness. Numerical data obtained from the instrumental measurements could be used to supplement sensory results. For example, a relationship between the instrumental and sensory tenderness acceptability in chicken breast was observed by Schilling et al. (2003). They observed that consumers considered samples with shear force value of less than 3.1 kg/cm2 to be tender, and highly acceptable. Moreover, the authors demonstrated that increases in the shear force value resulted in unacceptable meat toughness.
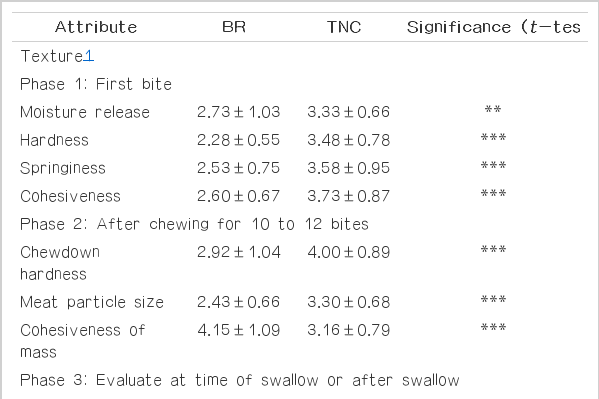
Descriptive sensory attributes of cooked broiler (BR) and Taiwan native chicken (TNC) breast meat
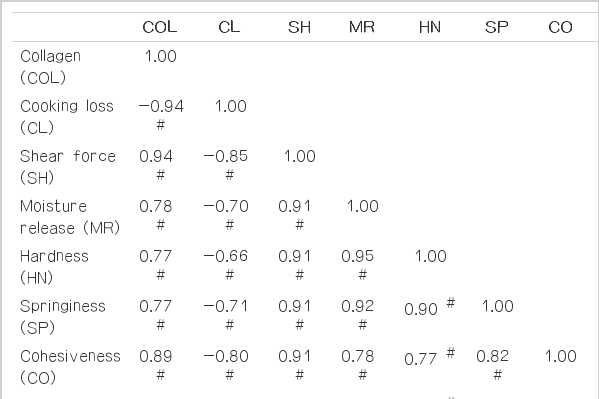
Pearson correlations between descriptive sensory attributes and instrumental analysis in broiler breast meat
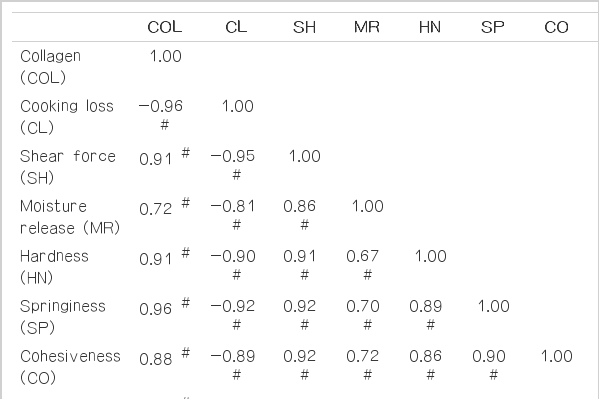
Pearson correlations between descriptive sensory attributes and instrumental analysis in Taiwan native chicken breast meat
In this study, a significant correlation (r = 0.91 to 0.94) between the collagen content and shear force value was observed, which agrees with previous studies. A study conducted by Liu et al. (1996) showed that chicken meat toughness, which was determined using shear force value measurements, significantly correlated with collagen content (r2 = 0.94) and perimysium thickness (r2 = 0.95). Wattanachant et al. (2005) reported that the muscle of 16 wk Thai native chicken, which had a thick perimysium and high collagen content, exhibited higher shear force value than the muscle of the 38 d commercial BR; they explained that the genetic backgrounds of different breeds determine perimysium thickness and collagen content, producing the observed differences in the textural properties of the meat. The native chicken meat used in the current study exhibited higher springiness and cohesiveness than the BR meat (3.58 vs 2.53 and 3.73 vs 2.60, respectively; p<0.001). We observed high correlations between the collagen content and springiness (r = 0.77 to 0.96), and between the collagen content and cohesiveness (r = 0.88 to 0.89). In this study, after chewing for 10 to 12 bites (phase 2), TNC meat had significantly larger meat particle sizes (3.30 vs 2.43, p<0.001) and lower cohesiveness of mass (3.16 vs 4.15, p<0.001) than BR meat. Wattanachant et al. (2005) explained that younger BR meat contained less cross-linked collagen but had more soluble collagen than native chicken meat. During heat denaturation, insoluble cross-linked collagen shrank and effectively compressed heat-denatured myofibrils, and eventually resulting in moisture loss, decreases in fiber diameter and a tougher texture; Wattanachant et al. (2005) observed that native chicken provides larger meat particle sizes, likely because the tougher and coarser texture of this meat confers resistance to disruption by teeth. By contrast, the higher moisture content, softer textures and smaller particle sizes assist bolus-formation, and contribute to the higher cohesiveness of mass in BR meat. During mastication, food in the mouth is broken into small particles until ready to be swallowed, through a combination of compressive-shearing and tensile forces, wetting and lubricating with saliva, and forming into a bolus (Szczesniak, 2002). Different foods require different chewing strategies; Jalabert-Malbos et al. (2007) observed that the particle size distribution of boluses varied with food type. Compared with softer and higher moisture content food types such as egg white, which is swallowed rapidly, harder foods, such as chicken meat, require more time to disrupt their fibers and a more complete salivation to produce a lubricated bolus that is safer for swallowing. When interacting with some minor attributes, such as saliva, ease of swallow and mouth coating, Lyon and Lyon (1997) indicated particle size, bolus and wetness contributed to the integrated sensory textural perceptions of cooked chicken meat. The authors found that particle size and shape, chew-count, bolus size and ease of swallow were highly correlated to shear force value (r>0.88). In the current study, high correlations between meat particle size and shear force value were observed (r = 0.85 to 0.87). Similarly, certain sensory texture attributes, including cohesiveness, hardness, particle size, bolus size, and chewiness of cooked chicken breast, had high positive correlations with shear force value (Liu et al., 2004).
At phase 3, BR meat exhibited significantly less chewiness (3.15 vs 3.55, p<0.05) and required a smaller number of chews to swallow than TNC meat (27.30 vs 30.88, p<0.05), likely because of the relatively tender texture, smaller particle size and higher cohesiveness of mass in BR meat (Table 3). Higher hardness in the native chicken meat might increase the numbers of masticatory cycles required to disrupt fibers before swallowing (Jalabert-Malbos et al., 2007). We found that chewiness and the number of chews to swallow also followed the similar trends with regard to their correlations to the sensory hardness (r = 0.75 to 0.79 and r = 0.78 to 0.88, respectively) and instrumental shear force value (r = 0.90 and 0.94 to 0.98, respectively). This result is in agreement with Cavitt et al. (2004) who reported a high correlation (r2 = 0.71) between the shear force value of chicken breast and the number of chews to swallow. Additionally, Liu et al. (2004) reported a positive correlation between the shear force value and chewiness of chicken breast. In the current study, the panel reported experiencing a significantly higher oily mouthcoat after swallowing TNC meat compared with BR meat (3.93 vs 2.75, p<0.001), likely caused by its higher fat content (1.77% vs 1.57%). After swallowing, BR samples left more residual loose particles in the teeth and mouth than TNC samples (3.59 vs 3.01, p<0.01), likely because of the lower moisture release and oily mouthcoat of BR meat. We observed a high negative correlation (r = −0.79) between the residual loose particle and meat particle size for BR samples. During the mastication process, the smaller particle sizes (more surface areas) of the BR sample required more saliva for lubrication. However, the reduced moisture release of BR meat, combined with the limited amounts of saliva produced during mastication, might be insufficient for particle agglomeration to form a bolus before swallowing, and thus, residual loose particles remained after swallowing (Szczesniak, 2002).
In this study, TNC meat produced significantly more chickeny (4.86 vs 2.21, p<0.001) and brothy flavors (4.02 vs 3.33, p<0.01) than BR meat, likely because more flavoring compounds deposit in the meat during a longer life span; shorter lived BR typically exhibit less intense flavors (Fanatico et al., 2007). In Taiwan, BR are typically sold at the ages of 5 to 6 wk, whereas native chickens are sold at the ages of 15 to 16 wk in response to consumer demand for unique sensory characteristics, especially texture and flavor attributes (Huang et al., 2007). Native chickens are preferred for their unique organoleptic characteristics, particularly when they are used in certain cuisines (Huang et al., 2007). Food flavors result from comprehensive chemical reactions involving numerous compounds, including proteins, lipids, carbohydrates, and their chemical interactions (Dyubele et al., 2010). Numerous factors, including methods of processing, cooking, storage, and exposure of meat to chemicals, influence poultry meat flavors (Zhuang and Savage, 2011). Additionally, the release of volatile fatty acids during cooking can influence the aromas and flavors of meat (Dyubele et al., 2010). Wattanachant et al. (2004) reported that Thai native chicken muscles contained higher levels of glutamic acid than BR muscles. Rikimaru and Takahashi (2010) reported that the inosine 5′-monophosphate levels in 22-wk old Japanese native chickens (Hinai-jidori) was significantly higher than that of 8-wk old BR. Fanatico et al. (2007) described how the French poultry market is segmented, according to the ages of birds at slaughter, into the Appellation D’Origine Controlee, Label Rouge, organic, Certification de Conformite and conventional sectors; this may be because slow-growing chickens provide more intense flavors compared with fast-growing breeds. Chartrin et al. (2006) described how increased fat levels in meat had a positive influence on the cooked meat flavor. In the current study, the higher fat levels of TNC compared to BR samples (1.77% vs 1.57%) might have contributed to more intense cooked flavors in TNC meat.
Meat color is influenced by animal species, age, diet, type of muscle fiber, and the exercise that animals undertake (Lyon and Lyon, 2001). In the current study, TNC meat had significantly darker cooked meat color than BR meat (3.19 vs 2.75, p<0.01). Significantly lower L* value (p<0.01) and higher a* and b* values (p<0.05) attributed to the darker colors in TNC meat when compared to BR meat (Table 2). We noted high correlations between the descriptive sensory evaluation results and L* value (r = −0.70 to −0.88), a* value (0.81 to 0.85), and b* value (0.82 to 0.94). The results support the consistence between the subjectively sensory evaluation and objectively instrument measurement. Sow and Grongnet (2010) observed that cooked village chicken meat had significantly higher yellowness and lower whiteness in appearance than BR meat. After evaluating breast meat from chickens that were slaughtered at marketing age (12 and 6 wk for the Thai native chicken and BR, respectively), Jaturasitha et al. (2002) reported significantly lower L* values for Thai native chicken meat compared with that of BR. The authors proposed that this difference in color was probably due to the influence of breeds as well as the result of increasing muscle myoglobin as the animals mature. Variation in meat color is also partially related to muscle fiber composition. According to the biochemical and functional properties, muscle fibers are commonly classified into three groups including Type I (red fibers, slow twitch oxidative), Type IIA (intermediate fibers, fast twitch oxidative), and Type IIB (white fibers, fast twitch glycolytic) (Jaturasitha et al., 2002). Comparatively lower content of type IIB fiber in Thai native chicken breast (82.2% to 95.0% in Jaturasitha et al., 2008) as compared to 99.5% for BR breast meat (von Lengerken et al., 2002) might also attribute the color difference in meat between breeds.
In the current study, the TNC meat had a significantly coarser texture than BR meat (3.93 vs 2.30, p<0.001). Wattanachant et al. (2005) explained that after cooking, the wavy sheet structures of perimysium in BR meat were denatured and formed a soft and compact texture. Both denaturation and melting of the endomysium, and denaturing of myofibrils resulted in fiber swelling. However, TNC meat which contained thicker perimysium and highly cross-linked collagen only changed slightly during cooking. The wavy sheets structures of perimysium and the sheaths of endomysium were maintained, and became only slightly disordered. Differences in the microstructures and cross-linked collagen content that exist between breeds might account for the varied textural appearance of meat. In this study, we noted high correlations between fiber texture appearance and total collagen content (r = 0.79 to 0.94), shear force value (r = 0.86 to 0.88), hardness (r = 0.79 to 0.87), chewdown hardness (r = 0.83 to 0.94), meat particle size (r = 0.74 to 0.91), and numbers of chews to swallow (r = 0.87 to 0.90).
IMPLICATIONS
The results obtained in this study clearly demonstrated that significant differences existed between the sensory attributes of TNC and commercial BR meat, particularly for the texture and flavor characteristics. There were significant differences between the instrumental analyzes of collagen content, cooking loss, and shear force value for the meat of different breeds. Moreover, we observed high correlations between descriptive sensory attributes and instrumental analyzes of chicken meat. Our findings provide useful information for producers to efficiently identify and respond to consumer preferences, and thus increase their competitive superiority and segmentation within their specific market. Future work might address how meat from different breeds is used to manufacture food products to satisfy consumer requirements, based on its unique sensory characteristics.