Effect of Different Dietary n-6 to n-3 Fatty Acid Ratios on the Performance and Fatty Acid Composition in Muscles of Broiler Chickens
Article information
Abstract
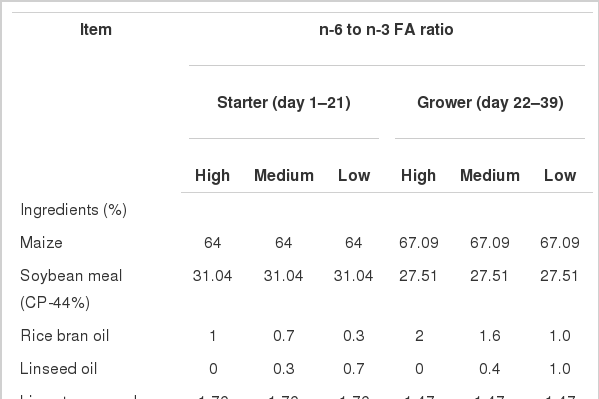
The objective of this study was to investigate the different dietary ratios of n-6 to n-3 (n-6/n-3) fatty acid (FA) on performance and n-6/n-3 FA in muscles of broiler chickens. A total of 300 one-day-old Cobb chicks were randomly assigned to 3 treatments of 10 replicates in each (10 birds/replicate). Birds were fed on a corn-soybean meal-based diet containing 1% oil during starter (day 1 to 21) and 2% oil during finisher (day 22 to 39) phases, respectively. Treatments of high, medium and low dietary n-6/n-3 FA were formulated by replacing rice bran oil with linseed oil to achieve n-6/n-3 FA close to >20:1, 10:1 and 5:1, respectively. Average daily gain, average daily feed intake, and feed conversion ratio were similar (p>0.05) among the treatments. Serum glucose, cholesterol and triglycerides concentrations were not affected (p>0.05) by dietary treatments. In breast, concentration of C18:3n-3 was significantly greater (p = 0.001) for medium and low vs high n-6/n-3 FA, while concentrations of C20:5n-3, C22:6n-3, total n-3 FA, and n-6/n-3 FA were significantly higher for low vs medium, and medium vs high dietary n-6/n-3 FA. In contrast, concentrations of C18:2 and mono-unsaturated FA (MUFA) were lower for low vs high dietary n-6/n-3 FA. In thigh muscles, concentrations of C20:5n-3 were higher (p<0.05) for medium and low vs high dietary n-6/n-3 FA, and concentrations of C18:3n-3, C22:6, and n-3 FA were greater (p<0.05) for medium vs high, low vs medium dietary n-6/n-3 FA. However, concentrations of C18:1, MUFA, n-6/n-3 were lower (p<0.05) for low and medium vs high dietary n-6/n-3 FA. In conclusion, lowering the dietary n-6/n-3 FA did not affect the performance of chickens, but enhanced beneficial long-chain n-3 FA and decreased n-6/n-3 FA in chicken breast and thigh, which could be advantageous for obtaining healthy chicken products.
INTRODUCTION
The enrichment of animal products with biologically active functional compounds has been an increasing interest in recent years because of growing awareness among the consumers about the relationship of diet and health. The greatest effort in animal feed research has been directed towards enhancing the beneficial n-3 fatty acid (FA) concentrations of animal products to produce healthy foods (Palmquist, 2009). The FAs known to be essential for humans are the n-3 polyunsaturated FAs (PUFAs)-α-linolenic acid (C18:3 n-3) and n-6 linoleic acid (C18:2 n-6) (Simopoulos, 2000). The long chain n-3 PUFAs, especially eicosapentaenoic acid (EPA; C20:5n-3) and docosahexaenoic acid (DHA; C22:6n-3) is endogenously synthesized from α-linolenic acid precursor, but in limited amounts (Simopoulos, 2000). These n-3 FAs are associated with a number of physiological and health beneficial effects, including prevention of arteriosclerosis and lowered incidence of cardiovascular diseases (Simopoulos, 2000). However, intake of PUFAs, especially n-3 FAs is less than recommendation (Palmquist, 2009).
Dietary unsaturated C18:3n-6 and C18:3n-3 FAs are desaturated and elongated to their C20 or C22 PUFAs mediated by microsomal Δ5- and Δ6-desaturases and chain-elongation enzymes (Sprecher, 2000; Palmquist, 2009). The first step in the pathway involves Δ6-desaturation, which is shared by C18:3n-6 and C18:3n-3. Despite higher affinity of Δ6-desaturase for C18:3n-3 than for C18:3n-6, the typically greater concentrations of C18:3n-6 in cellular pools result in greater conversion of the latter to longer chain n-6 PUFA. Because Δ6-desaturation is the rate-limiting step in the pathway, high dietary intakes of n-6 PUFA have been proposed to be a main limiting factor in the conversion of C18:3n-3 to EPA and DHA. Thus, it has been suggested that optimization of the ratios of n-6 to n-3 (n-6/n-3) FA, while ensuring adequate amount of n-3 FA may be beneficial for human health (Simopoulos, 2002; Wijendran and Hayes, 2004; Palmquist, 2009).
Research spanning over the past two decades has directed towards enhancing the n-3 FAs concentrations in foods by modifying animal diets and feeding practices so that consumption of traditional foods can fulfill the human requirements (Simopoulos, 2000; Palmquist, 2009). There are numerous studies showing that concentrations of n-3 and n-6 PUFAs, especially beneficial EPA and DHA, in chicken muscles increased due to dietary enrichment with oils rich in C18:3n-6 and C18:3n-3 FAs (Lopez-Ferrer et al., 2001; Newman et al., 2002; Kitessa and Young, 2009). There are limited data how the different n-6/n-3 ratios in diets formulated by replacing rice bran oil with linseed oil affect performance and n-6/n-3 FA ratios in chicken muscles. Therefore, this study was conducted to investigate the effect of different n-6/n-3 FA in the diets of broiler chicken on the performance and n-6/n-3 FA in chicken meat.
MATERIALS AND METHODS
Bird management and dietary treatment
A total of 300 one-day-old Cobb 400 unsexed chicks were randomly assigned to 30 pens with 10 chicks in each pen, and pens were equally allotted to 3 treatments (n = 10). The trial lasted 39 days. All the birds were fed on a basal corn-soybean meal based diet containing 1% oil during starter (1 to 21 days) and 2% oil during finisher (22 to 39 days) phase (Table 1). The diets were formulated by adding rice bran oil and linseed oil to obtain 3 treatments of high, medium and low dietary n-6/n-3 FA. The n-6/n-3 FA for high treatment was >20:1, whereas for medium and low dietary n-6/n-3 FA, the rice bran oil was partly replaced with linseed oil to achieve n-6/n-3 FA close to 10:1 and 5:1, respectively. The birds were raised on deep litter comprising of saw dust and paddy husk. The birds were vaccinated against Newcastle disease (on day 7 and 18) and infectious bursal disease (on day 12). Experimental diets and water were offered ad libitum throughout the study. Individual live weight, pen-wise feed intake and feed conversion ratio (FCR, feed intake/weight gain) were determined on day 21 and 39.
Blood and muscle sample collection
At the end of experiment (39 days), one bird from each pen (total 10 birds (5 males and 5 females) per treatment) with live weight close to pen average was selected and slaughtered, and thigh and breast samples were collected and stored at −20°C until further processing. Blood samples were collected before slaughter in vacutainer tubes, and serum samples were separated and stored at −20°C until analyses.
Chemical analysis
Feed samples were analysed for dry matter (DM, 930.15), ash (942.05), crude protein (CP, 976.05) and ether extract (954.02) following the methods of AOAC (2000). Calcium concentrations were determined using the method of Talapatra et al. (1940). Concentrations of FA in feeds, breast and thigh tissues were measured by capillary gas chromatograph (GC) on a HP-88, 100 m×0.25 mm×0.20 μm capillary column (Agilent Technologies Inc., Santra Clara, CA, USA) installed on a Varian 450 GC equipped with a flame ionization detector (Varian B.V., Netherlands) as described by O’Fallon et al. (2007). Helium was used as a carrier gas at a flow rate of 2.0/min. Temperature programming was as follow: initial oven temperature was 120°C, held for 1 min, increased at 10°C/min to 175°C which was held for 10 min, then increased to 210°C at a rate of 5°C/min, held for 5 min. Finally temperature was raised at 5°C/min to 230°C. Temperatures for both the injector and the detector were set at 260°C. Identification and quantification of individual FA were performed using a purified standard (Supelco 37 component FAME mix, Trans-11-vaccenic methyl ester, and Octadecadienoic acid conjugated methyl ester; Sigma-Aldrich Chemical Pvt. Ltd., Kolkata, India) and an internal standard (Tridecanoic acid; Sigma-Aldrich Chemical Pvt. Ltd., Kolkata, India). Concentrations of glucose, triglyceride and total cholesterol in serum were determined colorimetrically in a UV-visible spectrophotometer (Systronics 108, Bangkok Thailand) using commercial kits (Span Diagnostic Ltd, Surat, Gujarat, India).
Statistical analysis
The data were analysed by one-way analysis of variance (ANOVA) using SPSS (1997) in a completely randomized design with a model containing treatment as a main effect. The data on FA in muscles were also analysed by two-way ANOVA with model containing treatment, muscle and their interaction. For live weight, feed intake and FCR, pen was used as an experimental unit. For FA composition in muscles and blood parameters, individual bird was considered as an experimental unit. Probability values of p<0.05 were declared. When treatment effect was significant, the differences among the treatment means were detected using Duncan’s test.
RESULTS
Composition of fatty acid in diets
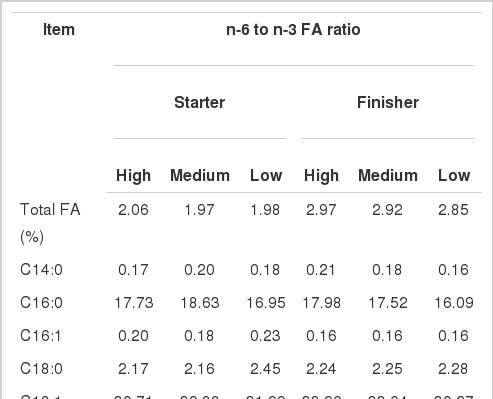
The composition of FA in experimental diets is presented in Table 2. Total FA concentration was similar across the diets. As expected, addition of 0.3% and 0.7% linseed oil in starter diet resulted in 94% and 220% increase in C18:3n-3 in medium and low dietary n-6/n-3 FA compared with high dietary n-6/n-3 FA, respectively. Similarly, adding 0.4% and 1.0% linseed oil in finisher diet resulted in 137% and 347% increase in C18:3n-3 in medium and low dietary n-6/n-3 FA compared with high dietary n-6 to n-3 FA ratio, respectively. These increases in C18:3n-3 concentrations in diets changed the n-6/n-3 FA in both starter and finisher diets. Other FAs were generally not changed among the diets.
Performance and blood parameters
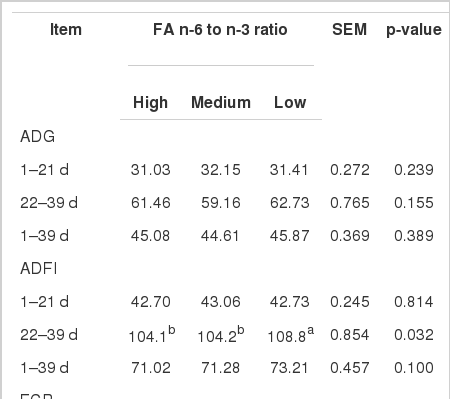
The mortality rate in this experiment was less than 3.0% and was not related to dietary treatments. Data presented in Table 3 shows that average daily gain (ADG), average daily feed intake (ADFI) and FCR were similar (p>0.05) across all treatments except that ADFI was higher (p<0.05) in birds fed on the diet containing low n-6/n3 ratio than the diets with high and medium n-6/n-3 ratio during 22–39 d. Overall, ADFI during 1–39 d was not affected by dietary n-6/n-3 ratio. Serum glucose, cholesterol and triglycerides concentrations were not affected (p>0.05) by dietary treatments.
Concentrations of fatty acid in breast muscles
The effect of dietary n-6 to n-3 FA ratios on FA concentrations in breast muscles is presented in Table 4. Different dietary n-6/n-3 FA had no effect (p>0.10) on C14:0, C16:1, C18:0, C18:1, C20:1, C20:2, C20:3 C20:4 and total saturated FA (SFA) concentrations in the breast muscles. However, concentration of C16:0 tended (p = 0.065) to decrease for low n-6 to n-3 FA ratio, and concentration of C17:1 tended to increase for medium and low n-6/n-3FA in the diets. The concentration of C18:3n-3 was significantly greater (p = 0.001) for medium and low vs high dietary n-6/n-3 FA, while concentrations of C20:5, C22:6 and n-3 FA were significantly higher for low vs. medium and medium vs high dietary n-6/n-3 FA. In contrast, concentrations of C18:2 and mono-unsaturated FA (MUFA) were lower for low vs. high dietary n-6/n-3 FA. The C24:1 was not detected for low dietary n-6/n-3 FA, but was similar for high and medium n-6/n-3 FA.
Concentrations of fatty acid in thigh muscles
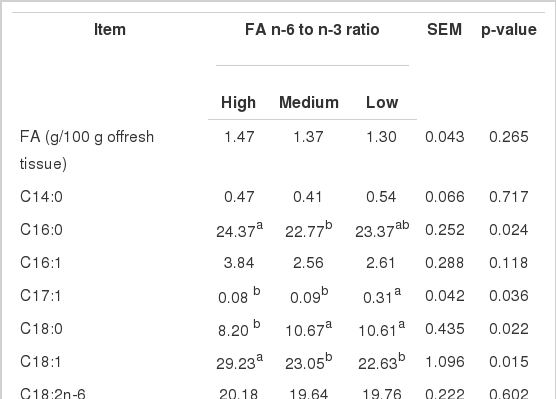
In thigh muscles, different dietary n-6/n-3 FA had no effect (p>0.10) on the concentrations of C16:1, C18:2, C20:2, C20:3, C20:4, and total SFA and n-6 FA (Table 5). Concentration of C16:0 was lower for medium vs low and high dietary n-6 to n-3 FA ratios. The concentration of C17:1 was significantly greater (p<0.05) for low vs high and medium dietary n-6/n-3 FA, concentrations of C18:0 and C20:5 were higher (p<0.05) and concentration of C20:1 tended to be higher (p = 0.08) for medium and low vs high dietary n-6/n-3 FA, and concentrations of C18:3n-3, C22:6, and n-3 FA were greater (p<0.05) for medium vs. high, low vs. medium dietary n-6/n-3 FA. However, concentrations of C18:1, MUFA, n-6/n-3 were lower (p<0.05) for low and medium vs. high dietary n-6/n-3 FA, and concentration of C24:1 was lower for low vs. medium and high dietary n-6/n-3 FA.

Fatty acid (FA) concentrations (g/100 g of total FA) in thigh muscles of broiler chicken fed diets with different n-6 to n-3 FA ratios
The interaction between treatment and muscle was significant only for C20:5n-3. The concentrations of total FA, C17:1, C20:1, C20:2, C20:5n-3, C22:6n-3 and total n-3 FA were significantly (p<0.05) higher in breast muscles than thigh muscles. However, concentrations of C18:2n-6 and n-6/n-3 FA were lower (p<0.05) in breast muscles than in thigh muscles. The concentrations of other FA were similar in thigh and breast muscles.
DISCUSSION
The results of this study revealed that diets with different n-6/n-3 FA did not influence the body weight, ADFI and FCR in broiler chicken during the starter and finisher phases when dietary oil were supplemented at 10 g/kg and 20 g/kg, respectively. The absence of effects on performances of the birds was due to similar dietary CP and metabolizable energy contents, and feed intake among the treatments. Similar findings were reported for chicken fed diets supplemented with fish oil and rapeseed oil (Lopez-Ferrer et al., 1999), rapeseed oil or linseed oil (Nguyen et al., 2003), combination of various vegetable oils, including soybean oil and linseed oil (Kavouridou et al., 2008) and coconut oils and n-3 feed supplements (Marco et al., 2013). However, Newman et al. (2002) and Poorghasemi et al. (2013) noted that chicken fed tallow had low FCR than chicken fed sunflower oil and although ADG was similar for chickens fed fish oil, sunflower oil and tallow.
Blood triglycerides and cholesterol levels were not affected by different FA composition of diets in this study as also reported in other studies with sunflower, linseed and soybean oils (Febel et al., 2008; Jankowski et al., 2012). However, dietary fat especially containing high concentrations of SFA may increase plasma triacylglycerol concentrations (tallow vs fish oil, Newman et al., 2002; chicken fat vs fish oil, Phetteplace and Watkins, 1990; sunflower oil or linseed oil, vs tallow or olive oil, Crespo and Esteve-Garcia, 2002).
Total FA content in chicken was greater in thigh than breast, which is noted in other studies (Cortinas et al., 2004). Concentration of C20:5n-3 was affected by treatment and muscle interaction, which was greater in breast muscles than in thigh muscles for low n-6/n-3 group. Phospholipids are present in a higher proportion in breast muscles than in thigh muscles (Ratnayake et al., 1989), and PUFA is preferentially incorporated into phospholipids (Hulan et al., 1988). Thus, a greater proportion of C20:5n-3 FA has likely been deposited in phospholipids of breast muscles due to higher amount of C18:3 n-3 FA in the diet of low n-6/n-3 group. A higher deposition of long-chain PUFA in breast muscles compared with thigh muscles (Hulan et al., 1988; Lopez-Ferrer et al., 1999a; Crespo and Esteve-Garcıa, 2001) has been reported earlier.
The concentrations of C18:3n-3 increased nearly 2 and 3 fold in the both meats in medium and low n-6/n-3 treatments, respectively due to higher levels of this FA in experimental diets. The present findings agree with the previous studies in chickens fed linseed oil or linseed meal (Lopez-Ferrer et al., 1999; Zuidhof et al., 2009). The deposition of n-3 PUFA in the thigh and breast muscles in the low n-6/n-3 group was 4 times greater than in the high n-6/n-3 group. These results are also consistent with the observation that dietary supplementation with n-3 PUFA increases the content of these FA in poultry meat (Ozpinar et al., 2003; Shen et al., 2005). Nguyen et al. (2003) reported that the deposition of n-3 PUFA in the chicken fed rapeseed oil and linseed oil was 2 and 8 times greater than in chicken fed lard. Decreasing n-6/n-3 FA linearly increased proportion of EPA and DHA in the both breast and thigh meat by nearly 6 to 7 and 4 to 5 folds, respectively for low the n-6/n-3 group. This finding suggests that elongation and desaturation of C18:3n-3 to EPA and DHA was achieved at much higher rates than other reported studies given that concentration of C18:2n-3 FA was only 7%. The contents of EPA and DHA achieved in this study were much higher than concentrations reported previously (Febel et al., 2008; Zelenka et al., 2008). Kartikasari et al. (2012) demonstrated that diets with high C18:3n-3 FA increased the incorporation of EPA and DHA into breast and thigh meat to levels 5 to 7 and 4 to 5 fold relative to birds fed low C18:3n-3 FA, but the diet contained C18:3n-3 FA at higher concentrations (42% vs 7%) in that study. It appeared that n-6/n-3 FA is an important dietary requirement to obtain maximum concentrations of long chain n-3 PUFA in meats for chicken. It was noted that deposition of EPA and DHA was much higher in breast muscle than in the thigh muscle (Zuidhof et al., 2009). The concentrations of C20:4n-6 (arachidonic acid) in meat was not altered in this study owing to the fact that the precursor (C18:2n-6) of this FA was similar in the diets. However, the concentrations of C20:4n-6 FA decreased in the study of Kartikasari et al. (2012). From this study, it appears that n-6/n-3 FA in breast and thigh meat correspond to 80% to 90% and 60% to 70% of dietary n-6/n-3 FA, respectively.
In conclusion, different ratios of dietary n-6/n-3 FA had no effect on the performance of broiler chickens. However, lowering the dietary n-6/n-3 FA ratios decreased n-6/n-3 FA and increased beneficial EPA and DHA by 4 to 7-folds in chicken thigh and breast. This study showed that altering the n-6/n-3 FA ratios in the diets may augment the concentrations of long chain n-3 PUFA and modulate the n-6/n-3 FA ratio in chicken meat resulting in healthy meat products.


