Ingestive Behavior of Heifers Supplemented with Glycerin in Substitution of Corn on Brachiaria brizantha Pasture
Article information
Abstract
The objective was to evaluate the ingestive behavior of crossbred heifers finished on a Brachiaria brizantha cv. Marandu pasture receiving four levels of glycerin in their supplementation. Thirty-six crossbred heifers with average initial weight of 264.83±3.83 kg and 20 months of age were distributed into a completely randomized design with four treatments and nine replications: control (0%), 4.82%, 10.12%, and 15.56% glycerin in the dry matter. The grazing time reduced linearly (p<0.05), whereas the time spent on activities like rumination, idleness, trough and total chewing time were quadratically affected (p<0.05). Bite rate and number of bites/day were quadratically influenced (p<0.05). The number of bites/swallowed cud and the number of bites/minute, however, increased linearly (p<0.05). Although the time spent on each cud and number of chews per cud were not affected (p>0.05). The number of rumination periods reduced linearly (p<0.05), whereas the number of grazing, idle and trough periods, and the times per grazing, idle, rumination and trough periods were quadratically affected (p<0.05). The feed and rumination efficiencies of the dry matter, non-fibrous carbohydrates, pasture dry matter and concentrate were quadratically affected (p>0.05) whereas the feed efficiency of neutral detergent fiber reduced linearly (p<0.05). Addition of glycerin in substitution of corn in supplements for animals managed on pastures does not influenced feed intake, but reduces the grazing time and increases the idle time. The supplementation also improves feed and rumination efficiencies.
INTRODUCTION
The performance of animals managed on pasture is directly related to the quantitative and qualitative availability of forage, which is subjected to variations throughout the year. Thus, strategic supplementation is an alternative to improve productive efficiency through providing the limiting nutrients to achieve the objectives of the production system.
Nutrient intake, digestibility and metabolism are factors that affect animal performance, however feed intake, can be influenced by factors inherent to the feeds such as palatability, texture, visual appearance, and factors linked to the animals, like emotional state, social interaction and apprenticeship (Mertens, 1994). The effect of supplement on intake can be additive, when the supplement intake is aggregated to the current ingestion of the animal; and substitutive, when the supplement intake reduces forage intake without improving animal performance (Barbosa et al., 2001). Additionally, the ingestion of supplement changes the ingestive behavior of grazing ruminants (Marques et al, 2005) and when part of the required nutrients is met by supplement intake, the efficiency in the use of the energy from the diet may improve due to the better conditions for the activity of the ruminal microbiota (Silva et al, 2005). Thus, the grazing time may reduce, the idle and rumination times may increase and the feed intake by the animals may improve. Therefore, the ingestive behavior can be influenced according to the type of ingredient used in the supplement. Additionally, the physical structure and chemical composition can also affect the ingestive behavior, influencing the feeding time.
The use of supplements based on corn as an energy component may result in high costs for production systems, when animals are finished on pasture. Hence, alternative energy sources can be efficient in reducing the production costs provided they do not compromise intake or animal performance. Among the alternative sources of food energy is glycerin, a by-product from the biodiesel industry, which has been used in supplementation systems as a substitute for corn, because it presents similar energy characteristics and also because ruminants are able to use the glycerol present in the glycerin as a gluconeogenic precursor (Chung et al., 2007) for the maintenance of plasma glucose levels.
The chemical composition of glycerin is highly variable, as it changes according to the raw material utilized for biodiesel production (Elam et al., 2008). Because of the glycerol content, the use of glycerin in substitution of corn results in rapid ruminal fermentation (Trabue et al., 2007), which causes alterations in the ingestive behavior. In the literature, effects of the use of glycerin in supplementation as regards the ingestive behavior of pasture-finished cattle are controversial.
The objective of this study was to evaluate the ingestive behavior of crossbred heifers finished on a Brachiaria brizantha cv. Marandu pasture receiving four different levels of glycerin in their supplementation.
MATERIAL AND METHODS
The experiment was conducted from July to December 2010 on Princesa do Mateiro Farm, located in Ribeirão do Largo, BA, Brazil, The experimental period was 135 days, of which the first 14 days were used for animals to adapt to the management and experimental diets. The animals were kept on a pasture-production, rotational grazing system on Brachiaria brizantha cv. Marandugrass in a 14-ha area which was divided into 11 paddocks.
Thirty-six Nellore heifers with average initial weight of 264.83±3.83 kg and 14 months of age were distributed into a completely randomized design with four treatments and nine replications, as follows: G0, control; G5, 4.82%; G10, 10.12%; and G15, 15.56% glycerin in substitution of corn in the ingested dietary dry matter (DM) (Table 1). The supplement was provided once daily (10 00 h) in an uncovered plastic trough. The diets were formulated according to the NRC (2000) to contain equal amounts of protein and energy (Tables 1 and 2), with a roughage-to-concentrate ratio of 63.40:36.6. The glycerin utilized was produced in a soybean biodiesel-extracting company (BIOPAR, Rolândia, PR, Brazil) and contained 81.20% glycerol. The chemical composition of glycerin was determined at Instituto de Tecnologia do Paraná (TECPAR).
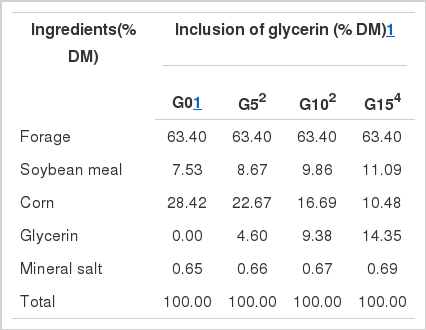
Ingredient composition of the total diet
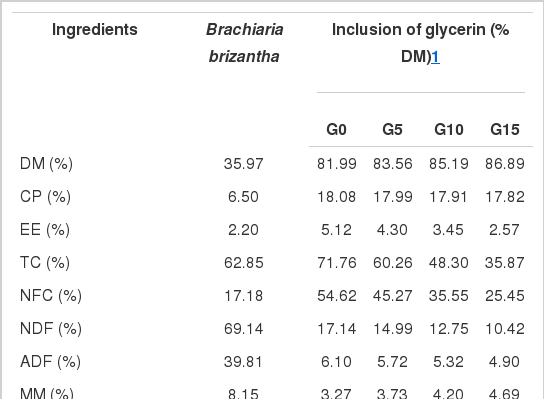
Chemical composition of the Brachiaria brizanta cv. Marandu and of the concentrates (% of DM), total dry matter availability, residual biomass, stocking rate, accumulation rate and forage allowance
The pasture was evaluated every 28 days to estimate the DM availability (Table 2) by removing 12 samples collected from the soil level with a 0.25 m2 frame according to the method described by Wilm et al. (1944). To reduce the influence of biomass variation among paddocks, the heifers remained in each paddock for seven days, and then randomly transferred to another paddock. The daily residual biomass of DM (Table 2) was estimated in the four paddocks according to the double-sampling method (Wilm et al., 1994). Before the cut, the DM of the biomass of the sample was visually estimated. The values of the visually estimated samples cut when the frame was thrown 40 times were utilized, and subsequently the forage biomass was calculated and expressed in kg/ha, by the equation proposed by Gardner (1986).
The DM accumulation in the different experimental periods was calculated by multiplying the daily accumulation rate (DAR) of DM by the number of days in the period. The DAR was estimated by the equation proposed by Campbell (1966): DARJ = (Gi–Fi–1)/n, in which DARJ = daily DM accumulation rate in period j, in kg DM/ha/d; Gi = average final DM in the four empty paddocks at instant i, in kg DM/ha; Fi–1 = average initial DM present in the empty paddocks at instant i-1, in kg DM/ha; n = number of days in period j. The forage allowance was calculated according to the formula:
in which: FA, in kg DM/100 kg body weight (BW) d; RBM, in kg/ha day DM; DAR, in kg DM/ha day; BW, in kg/ha.
The forage samples collected by the double-sampling technique were weighed separately on field, and sub-samples were taken from this material and their structural components leaf blade, stem, and dead material (MM) were separated and their individual dry weight obtained. Samples of forage were pre-dried in a forced air-circulation oven at 55°C to 65°C for 72 h.
To estimate the fecal production, LIPE (isolated, purified and enriched lignin from Eucalyptus grandis, UFMG, Minas Gerais, Brazil) was used as external marker, which was administered daily at the dose of one capsule after the supply of the morning concentrate, for seven days. The first three days were used for adaptation and regulation of the excretion of the marker, and the other four for feces collection. The feces were collected (approximately 300 g) directly from the pasture, right after excretion, taking the necessary precautions to avoid contamination of the samples with the soil. They were stored in plastic bags, labeled and frozen.
The DM, ash, crude protein (CP), and ether extract (EE) contents in the samples of feed, orts samples and feces were analyzed according to Silva and Queiroz (2002). The organic matter content was estimated by subtracting the ash from the DM content. The total carbohydrates (TC) were estimated according to Sniffen et al. (1992), as follows: TC = 100–(%CP+%EE+%ash). The non-fibrous carbohydrates corrected for the residual ash and protein (NFCap) were calculated according to Kearl (1992): NFCap = (100 – %NDFap – %CP – %EE – % ash). The total digestible nutrients (TDN) were calculated according to Weiss (1999), but utilizing the neutral detergent fiber (NDF) and non-fibrous carbohydrates (NFC) corrected for residual ash and protein.
The ingestive behavior was evaluated by means of visual observations during two 24-hour periods, with 5-minute intervals to identify the times spent on the grazing, rumination, idle and trough activities and total chewing time (TCT). Animals in each treatment were visually assessed by one trained observer for two hours and six hours of rest and thus, for each treatment four observers were used. Throughout the day, each observer worked for 6 hours and rested 18 hours. The entire experiment used 16 observers who were positioned strategically so as not to disturb the animals.
The bite rate of the animals on each treatment was estimated as the time spent by the animal to perform 20 bites (Hodgson, 1982). To calculate the bite mass, the total daily intake was divided by the total daily bites (Jamieson and Hodgson, 1979). The results of the observations of bites and swallowing were recorded in six occasions throughout the day, according to Baggio et al. (2009), with three evaluations in the morning and another three in the afternoon. These observations were also used to determine the number of bites per day, which is the product between bite rate and grazing time.
The count of the number of rumination chews and the determination of the time spent on the rumination of each, per animal, were performed with the use of a digital stopwatch. To obtain the average number of chews and the average time, three cuds were observed in three different periods of the day (0900 to 1200 h, 1500 to 1800 h, and 1900 to 2100 h), according to Bürger et al. (2000). To determine the number of daily cuds, the total rumination time was divided by the average time spent on the rumination of each cud, as described previously.
The variables g of DM and NDF/meal were obtained by dividing the average individual intake of each fraction by the number of eating periods per day (in 24 hours). The feed and rumination efficiencies, expressed as g/h DM and g/h NDF, were obtained by dividing the average daily intakes of DM and NDF by the total time spent eating and/or ruminating in 24 hours, respectively. The variables g of DM and NDF/cud were obtained by dividing the average individual intake of each fraction by the number of ruminated cuds per day (in 24 hours).
The results were analyzed by variance analysis and regression equations, using the Analysis System of the System Analysis and Statistical Genetics package (2001).
RESULTS AND DISCUSSION
Substitution of corn for glycerin of medium purity in the supplement did not affect (p>0.05) the intakes of DM from concentrate (concentrate DM), DM from pasture (pasture DM), total DM intake (TDMI), neutral detergent fiber intake (NDFI) or non-fibrous carbohydrates intake (NFCI) during the finishing of heifers (Table 3). The average concentrate DM intake was equal (2.57 kg/d) for all the groups, since it was fixed at 0.85% of the live weight of the animals, for the treatments. Likewise, the average pasture DM intake was similar for all treatments (3.92 kg/d), with no additive or substitutive effect of addition of the glycerin levels on forage intake.
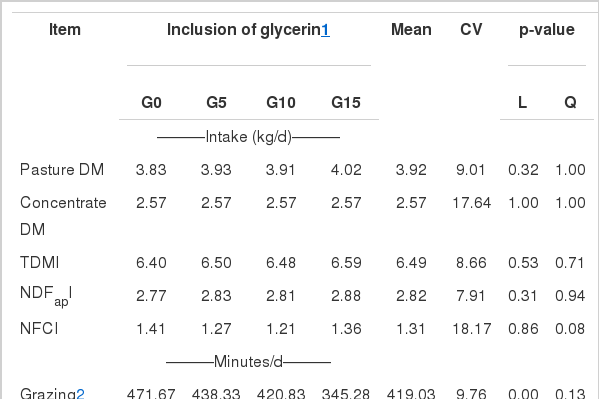
Effect of addition of glycerin levels on nutrient intake and times spent on the grazing, idle, rumination and trough activities by supplemented heifers on a Brachiaria brizantha pasture
The average intake observed for TDM (concentrate DM +pasture DM) was 6.49 kg/d. Such results agree with those observed by Farias et al. (2012), who did not find an effect of substitution of corn for crude glycerin at the levels of 0.0%, 2.8%, 6.1%, and 9.1%, in the total DM, on TDMI (6.2 kg/d) of heifers reared under conditions similar to the present study. On the other hand, adding 0.0%, 2.0%, 4.0%, 8.0%, 12%, and 16% glycerin to a diet for confined heifers, Parsons et al. (2009) observed a decrease in DMI from 2.0% glycerin. According to these authors, the addition of over 5% glycerin to the diet can affect the activity of the rumen microorganisms, interfering with ruminal fermentation. However, in the present study, addition of up to 13.0% glycerin did not show such interference.
The times spent on the grazing, rumination, idle and trough activities and the TCT were affected (p<0.05) by inclusion of glycerin in the diet (Table 3). The grazing time decreased linearly (p<0.05), and addition of 15% glycerin in the total DM reduced the grazing time by 127 minutes in relation to the animals fed supplement without glycerin. Such behavior indicates that the animals that did not receive glycerin in the diet needed more time to ingest the same amount of DM as those fed it, given that no significant differences were found in intake.
The time spent idle was quadratically affected (p<0.05) by the replacement of corn with glycerin (Table 3); with 5.25% of glycerin in the total DM, the animals spent 701.12 min of their time idle. According to Parsons et al. (2009), glycerol is almost totally converted to propionate in the rumen, which is the first to signal the end of the meals by increasing adenosine triphosphate production due to its use for glucose production, which signals satiety (Krehbiel, 2008). Thus, because 91% of the glycerin utilized in this experiment consisted of glycerol, a momentary satiation can be observed, caused by the rapid energy uptake, thereby increasing the idle time by the animals.
Similarly, the rumination time was quadratically affected (p<0.05) by addition of glycerin to the diet (Table 3), and with 7.16% of glycerin the animals spent 246.32 min ruminating, which corresponds to approximately 41 more minutes than those that did not receive glycerin. The variation in rumination time can be attributed to the exclusive nature of each activity performed by an animal, therefore two activites cannot to be performed at the same time. In the present study, the rumination time was inversely proportional to the time the animals remained idle. Another explanation for the variation observed in grazing time is that the formation of cuds is proportional to the grazing time (Bremm et al., 2008). Under similar conditions to those of the present experiment, Farias et al. (2012) did not observe an effect of increasing levels of glycerin on the rumination time of heifers reared on pasture. Silva et al. (2005) also did not observe changes in the rumination time of supplemented grazing heifers.
The time eating at the trough (trough; Table 3) was also quadratically affected (p<0.05): with 8.8% addition of glycerin to the diet, the animals remained approximately 53 minutes at the trough. This result is in line with the observation of Farias et al. (2012), who added 2.8%, 6.1%, and 9.1% glycerin to the diet of supplemented heifers on Brachiaria brizantha pasture. According to these authors, the increase in trough time with up to 6.1% of addition of glycerin to the diet was due to the difficulty shown by the animals to adapt to the glycerin. However, in the present study, it was observed that this adaptation difficulty occurred until glycerin reached 10% of the diet. After a certain level of ingestion, the animals would be used to the sweet taste of glycerin, which promoted rapid ingestion of the concentrate. We must stress that even with reduction of trough time with 15% of glycerin, concentrate intake was not lower. On the other hand, for Elam et al. (2008), addition of glycerin to the concentrate increased the time of permanence at the trough, due to the substitution of the time intended for grazing or rumination with the ingestion of concentrate (Bremm et al., 2005; Bremm et al., 2008).
The TCT (grazing+rumination) was quadratically affected (p<0.05) by addition of glycerin to the diet, and with 4.52% of glycerin, the animals took less time (634 min) to consume the same amount of DM and NDF as those that were not fed glycerin (677 min). The behavioral variable TCT is linked to the grazing (Gary et al., 1970; Stricklin and Kauts-Scnavy, 1984) and rumination times. However, it can be observed that the behavior verified for this variable was determined by the observations made, especially for grazing time (Table 3).
The bite mass is the variable mainly responsible for the variation in the daily forage intake of grazing animals, because it is directly influenced by the sward structure (Hodgson and Jamieson, 1981), whereas the bite rate and grazing time have a secondary role (Forbes, 1988). In this context, in the present study, we observed that substitution of corn with increasing glycerin levels in the supplement of the heifers did not affect (p>0.05) the bite mass (BITM, g DM/bite), since the forage allowance was the same for all the animals (Table 2).
The bite rate (BITR, n of bites/min) was quadratically affected as well (p<0.05), and addition of 10.39% glycerin to the diet caused the heifers to reach a maximum of 49.35 bites per minute (Table 4). Addition of glycerin to the diet at up to 10% of the total DM might have led the animals to become more selective during grazing, causing them to travel longer distances and better choose the forage, seeking the best parts of the plants (Bremm et al., 2008).
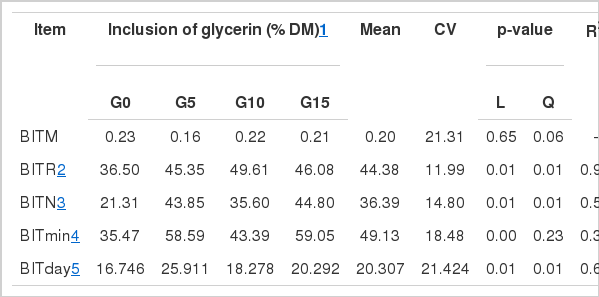
Influence of addition of glycerin levels on the bite traits in supplemented heifers on a Brachiaria brizantha pasture
The variable number of bites/swallowed cud and number of bites/minute (BITM) increased linearly (p<0.05), whereas the number of bites/day showed quadratic behavior (p<0.05) with peak at glycerin inclusion of 8.2%, resulting in 22,440.7 bites/day, respectively (Table 4). Such variations were inversely proportional to the grazing time (Table 3) and to the bite rate (Table 4), which led to compensation in pasture DM intake maintaining the similarity of this variable among the treatments.
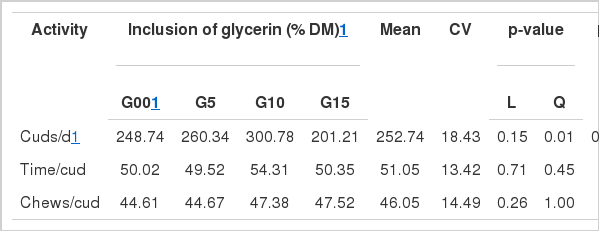
The variable time spent per ruminated cud (time/cud) and number of chews per cud (chews/cud) were not influenced (p>0.05) by the level of inclusion of glycerin in the total diet (Table 5). On the other hand, the number of cuds per day (cuds/d) was quadratically affected (p<0.05), and with 6.8% glycerin the animals increased the number of cuds to 289.1, indicating a greater need to form cuds to be chewed. Once the cud was formed, the average chewing time was similar (p>0.05) among the levels of replacement of corn by glycerin. The average number of chews/cud (46.05) was similar to that observed by Silva et al. (2005), who supplied different levels of supplement to heifers on a Brachiaria decumbens pasture. Farias et al. (2012), on the other hand, observed quadratic effect on the same variable, adding crude glycerin to the diet of supplemented heifers on a Brachiaria brizantha pasture.
Effect of addition of glycerin levels on the rumination characteristics of supplemented heifers on Brachiaria brizantha pastures
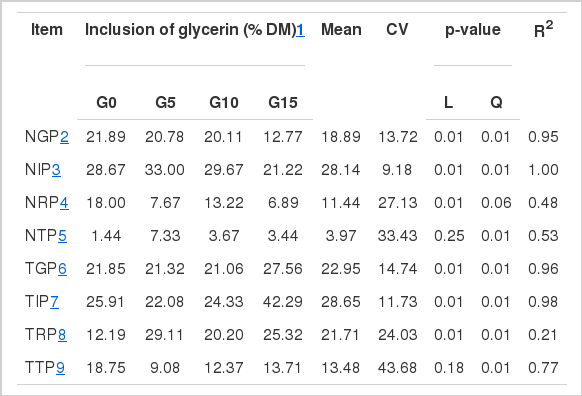
Quadratic effect (p<0.05) was observed on the number of periods of the activities performed by the heifers, with increments of 0.12 grazing periods (NGP), 11.59 idle periods (NIP) and 4.41 periods at the trough (NTP) with addition of 2.97%, 11.59%, and 8.14% glycerin to the diet, respectively. These results indicate that although there was reduction in the total grazing time (Table 3) and a trend towards reduction in NGP with levels of addition above 3% (Table 6), no reduction in pasture DM intake was observed (Table 3), which indicates that the animals utilized other behavioral elements to maintain the DM intake. However, addition of glycerin to the diet linearly reduced the number of rumination periods (NRP), which indicates that glycerin inclusion may affect both the total time (Table 3) and the number of rumination periods (Table 6) in a similar way. However, Farias et al. (2012) reported that both the duration (time) and number of rumination periods are affected by other types of mechanisms and not by the glycerin levels.
Effect of addition of glycerin levels on the number of periods and duration (minutes) per period of the activities performed by supplemented heifers on a Brachiaria brizantha pasture
The influence of the glycerin levels on NGP and NRP might have affected the behavior observed in NIP (Table 6), which was directly proportional to the total idle time (Table 3), demonstrating that the animals spent more time on this activity, which may be related to the metabolism of the glycerol present in the supplement with glycerin (Trabue et al., 2007).
The increase in the number of visits to the trough (NTP = 5.85 times per day) up to the level of 8.1% glycerin may be related to the difficulty of animals to adapt to the glycerin, which made them ingest the concentrate in small quantities, without, however, interfering with the total concentrate intake. Yet, from 10% of inclusion of glycerin, the increase in its palatability or sweet taste and astringency made the animals start to consume the concentrate faster (Ooi et al., 2004).
The time spent per grazing period (TGP) was influenced in a quadratic manner (p<0.05), and 5.3% of glycerin in the DM caused the heifers to spend 20.39 minutes grazing in each period. Thus, we can observe that the interaction between the number of grazing periods and the time spent on this activity might have caused the reduction in the grazing time in min/day (Table 3). Likewise, the time per idle period was quadratically affected (p<0.05) therefore, with addition of 5.27% glycerin the animals spent the least time idle (20.8 min) (Table 6). Like TGP, we can observe that the time spent in each idle period was the main factor influencing the total idle time in min/d (Table 3).
The time per rumination period (TRP) was quadratically affected (p<0.05), with peak at 10.46% glycerin addition with a 26.2 min of rumination in each period. In this case, the linear decrease in NRP was not sufficient to determine the total rumination time of heifers, in min/d (Table 3). Contrastingly, the variation observed in TRP was proportional to the variation observed in the total rumination time, in min/d (Table 3).
The time per trough period was also quadratically affected (p<0.05), decreasing to 10.89 min/period at the level of 8.85% glycerin. Although the animals increased the NTP, there was a reduction in the time they remained there. Thus, we can observe that the trough time (Table 3) was determined by increase in NTP and not by the NGP.
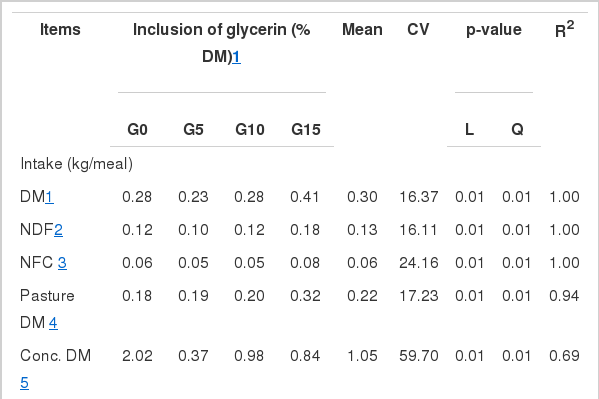
Intakes of NDF, NFC, DM, pasture DM and concentrate DM as kg/meal (Table 7) were quadratically affected (p<0.05), with minimum points of 0.23, 0.10, 0.04, 0.17, and 0.52 kg with 5.22, 5.21, 6.06, 3.93, and 9.75% glycerin, respectively. Similarly, the rumination of NDF and NFC, DM, pasture DM, and concentrate DM as g/cud were quadratically affected (p<0.05), reducing to 22.14, 9.89, 4.38, 13.71, and 9.17 g/cud when glycerin was added at 7.22%, 6.08%, 6.97%, 6.05%, and 6.30% to the diet.
Effect of the levels of glycerin on intake, rumination, and feed and rumination efficiencies in supplemented heifers on a Brachiaria brizantha pasture
The feed efficiency represents the speed of ingestion of nutrients as a function of the time (Santana Jr et al., 2013). In this context, we can observe that the feed efficiencies of DM, NFC, concentrate DM and pasture DM, as kg/h, showed quadratic behavior (p<0.05) (Table 7). The feed efficiencies of DM, NFC, and concentrate DM were lowest (0.77, 0.18, and 3.17) when glycerin was included at 2.55%, 5.23%, and 10.06%, respectively. On the other hand, the feed efficiency of pasture DM was highest (0.51 kg/h) with addition of 4.25% glycerin. The feed efficiency of NDF, however, was positively and linearly affected with addition of the glycerin levels (p<0.05) (Table 7).
The quadratic effect observed in the present study demonstrates that from 2.5% glycerin in the diet, the intake efficiency of heifers improved by approximately 30% in relation to the feed efficiency of the animals that consumed the supplement without glycerin. These results are in line with those obtained by Farias et al. (2012), who, with the addition of up to 3.8% glycerin to the diet of heifers reared on pasture the DM feed efficiency decreased, but then it improved again until 9.1% of addition of glycerin.
The use of low-digestibility feeds is controlled by the rumination efficiency; higher feed intake and better productive performance are promoted by higher amounts of ruminated feed during 8 or 9 hours, typical for rumination (Stricklin and Kautz-Scanavy, 1984). The rumination efficiency of DM, NDF, NFC, and DM from the pasture and concentrate were quadratically influenced, with minimum points of 1.58, 0.69, 0.30, 0.96, and 0.63 kg/h when the glycerin levels added were 6.48%, 6.40%, 7.16%, 6.35%, and 6.70%, respectively.
The effects of use of NDF observed in this study indicate that since glycerin is devoid of NDF in its composition, when it is utilized in the supplementation of animals managed on pasture, it is effective in maintaining the feed and rumination activities, given that no influence as regards DM intake was observed in this study. Thus, we can infer that levels similar to those utilized in this study did not impair forage intake.
CONCLUSION
Addition of glycerin in substitution of corn in supplements for animals managed on pastures does not influence feed intake, but reduces the grazing time and increases the idle time; this indicates that glycerol acts as a gluconeogenic precursor, which increases satiety. Glycerin supplementation also improves the use of DM and neutral detergent fiber from pasture and concentrate through the better feed and rumination efficiencies.