Go to Top Go to Bottom
Park, Kim, Hwang, Lee, Do, Kim, Yang, Kwon, Kim, Kim, Song, Oh, Kim, Cho, Cho, and Lee: Copy Number Deletion Has Little Impact on Gene Expression Levels in Racehorses

Abstract

Copy number variations (CNVs), important genetic factors for study of human diseases, may have as large of an effect on phenotype as do single nucleotide polymorphisms. Indeed, it is widely accepted that CNVs are associated with differential disease susceptibility. However, the relationships between CNVs and gene expression have not been characterized in the horse. In this study, we investigated the effects of copy number deletion in the blood and muscle transcriptomes of Thoroughbred racing horses. We identified a total of 1,246 CNVs of deletion polymorphisms using DNA re-sequencing data from 18 Thoroughbred racing horses. To discover the tendencies between CNV status and gene expression levels, we extracted CNVs of four Thoroughbred racing horses of which RNA sequencing was available. We found that 252 pairs of CNVs and genes were associated in the four horse samples. We did not observe a clear and consistent relationship between the deletion status of CNVs and gene expression levels before and after exercise in blood and muscle. However, we found some pairs of CNVs and associated genes that indicated relationships with gene expression levels: a positive relationship with genes responsible for membrane structure or cytoskeleton and a negative relationship with genes involved in disease. This study will lead to conceptual advances in understanding the relationship between CNVs and global gene expression in the horse.

INTRODUCTION

Three types of genetic variations exist in the genome. The largest type is microscopic structural variation, which can be detected by optical microscopy; these include aneuploidies and variation in chromosome size (Reich et al. 2002). The most common and smallest type is single nucleotide polymorphisms (SNPs) (Sachidanandam et al., 2001), detected at the single nucleotide level. Between microscopic structural variation and SNPs, the mid-size variations are submicroscopic variants, such as deletions, duplications and insertions, which are termed copy number variations (CNVs) (Scherer et al., 2007). Usually, CNVs are defined as DNA segments of >1 kb that show copy number differences in comparison with a reference genome, and they have been proposed to exclude insertion/deletions of <1 kb (‘indels’) (Scherer et al., 2007; Henrichsen et al., 2009a; Alvarez and Akey, 2012), although recent studies have suggested that an indel/CNV cutoff of 50 bp is preferable (Alkan et al., 2011; Mills et al., 2011). These CNVs, so called unbalanced structural variants (SVs) (Mills et al., 2011) are important genetic factors for studying human diseases and may have as large of an effect on phenotype as SNPs (Feuk et al., 2006; Sharp et al., 2006). It has been widely accepted that CNVs are involved in differential disease susceptibility (Hollox et al., 2003; Aldred et al., 2005; Gonzalez et al., 2005; Aitman et al., 2006).
At the genome-wide scale, the functional impact of CNVs has been studied in mouse and rat (Guryev et al., 2008; Henrichsen et al., 2009b; Orozco et al., 2009). In mouse, one study reported that the expression of genes within CNVs show moderate correlations with copy number changes (Henrichsen et al., 2009b), and another study reported that 83% of genes within CNVs were differentially expressed (Orozco et al., 2009). In rat, CNVs show functional relationships with 22 expression quantitative loci (Guryev et al., 2008).
A recent study reported 2,368 CNVs in horse (Doan et al., 2012). However, the relationships between CNVs and gene expression levels in horse have not yet been examined. In the current study, we investigated the effects of copy number deletion in the blood and muscle transcriptomes of Thoroughbred racing horses.

MATERIALS AND METHODS

RNA-seq data before and after exercise

We used RNA-seq data from four horses before and after exercise, as described elsewhere (Park et al., 2012; Kim et al., 2013); the data were submitted to the NCBI Gene Expression Omnibus (GEO) (http://www.ncbi.nlm.nih.gov/geo/) under accession number GSE37870. Briefly, samples of skeletal muscle and blood were taken from Thoroughbred horses before and after exercise. Then, using the Iluumina HiSeq2000, 20 sets of transcriptome data were generated for muscle and blood from four horses both before and after exercise.
The sequences were mapped to a horse reference genome using TopHat (ver.1.4.1) and annotated using the EquCab2 database (http://hgdownload.cse.ucsc.edu/downloads.html-horse) (Supplementary Table 3).
Mapped reads were assembled using Cufflinks (ver.1.3.0) (Trapnell et al., 2010) to estimate the abundance of genes. Fragments per kilobase of exon per million fragments (FPKM) of each sample were calculated to estimate the expression levels of the genes. The FPKM value set for all genes in the muscle and blood tissue samples was normalized using Quantile normalization (Bolstad).

Analysis of horse DNA re-sequencing data

Whole-blood samples were collected from the same four Thoroughbred racing horses used in RNA-seq analysis. Blood (10 mL) was drawn from the carotid artery and treated with heparin to prevent clotting. Manufacturers’ instructions were followed to create a paired library. The 90-bp pair-end reads sequence data were generated using HiSeq 2000 (Illumina, Inc., San Diego, CA, USA). Using Bowtie2 (ver. 2.1.0) (Langmead and Salzberg, 2012) with the default settings, pair-end sequence reads were mapped to the reference horse genome (equCab2). We used the following open-source software packages: Picard Tools (ver. 1.75), SAMtools (ver. 0.1.18) (Li et al., 2009), and the genome analysis toolkit (GATK) (version 2.2.4) (McKenna et al., 2010) for downstream processing and variant calling (Supplementary Figure 6).
The DNA re-sequencing data of 14 Thoroughbred racing stallions were downloaded from the NCBI sequence read archive (SRA) database under accession number SRA053569 described elsewhere (Kim et al., 2013). The pair-end sequence reads data were generated by the Korean Racing Authority, and the sampling, sequencing and mapping procedure were same as described above. The sequencing data of all 18 Thoroughbred racing horses are summarized in Supplementary Table 5.

Copy number variation identification for four Thoroughbred horses

We extracted CNVs of the four Thoroughbred racing horses used in RNA sequencing from the aligned re-sequencing data of the combined eighteen horses. The CNV extraction tool, Genome STRUCTURE In Populations (GenomeSTRiP) (ver. 1.04) (Handsaker et al., 2011) was used to acquire deletion calls of CNVs using the program default options. Each variant was genotyped, and the genotype quality was assessed based on the measurement of genotype likelihoods. To consider highly plausible variants, CNVs that passed the genotype quality threshold for all eighteen samples were selected as CNVs of four Thoroughbred horses involved in RNA sequencing. We then excluded two-allele deletion CNVs of which associated gene had certain expression level.

Copy number variations and gene expression analysis

To analyze the relationship between CNVs and gene expression, CNVs and genes were linked according to their start-end position information from GenomeSTRiP and the EquCab2reference annotation database. The linear regression slope between the gene expressions and the deletion status of CNVs was estimated using the ‘R’ statistics package (Hornik, 2011). The genes that showed consistent tendency in gene expression–CNV slope under all four conditions (blood and skeletal muscle, before and after exercise) were selected to obtain functional information. The equine Ensembl gene IDs were converted to official gene symbols by cross matching with human Ensembl gene IDs and the official gene symbols. The official gene symbols of human homologs of equine genes were used for KEGG pathway annotation and KEGG pathway enrichment analyses using the Database for Annotation, Visualization and Integrated Discovery (DAVID) (Dennis Jr et al., 2003). For the genes that show consistent tendency, the representation of functional groups in blood and skeletal muscle relative to the whole genome was investigated using the Expression Analysis Systematic Explorer (EASE) tool (Hosack et al., 2003) within DAVID, of which the EASE is a modified Fisher’s exact test used to measure enrichment of gene ontology terms (Alterovitz and Ramoni, 2010).

Copy number variation validation

Genomic DNA samples from each horse were assessed by polymerase chain reaction (PCR) to validate the CNV region selected by GenomeSTRiP. Twenty-six CNV regions of an appropriate size (up to 2.5 kb) for PCR, were selected randomly. All primer pairs listed in Supplementary Table 4 were designed to cover extracted CNV regions. The PCR amplification was carried out using a 2× PCR master mix (iNtRON BioTechnology, Seongnam, Gyeonggi, Korea) containing 1 pM of each primer set. Amplification was performed as follows: 1 cycle of 95°C for 5 min; 35 cycles of 95°C for 30 s, annealing at the temperature (Supplementary Table 4) for 20 s, and 72°C for 1 min or 1 min 40 s (for CNV lengths <1 kb or >1 kb, respectively), followed by 1 cycle of 72°C for 10 min. All amplicons were separated on a 1% ethidium bromide stained gel for 20 min.

RESULTS

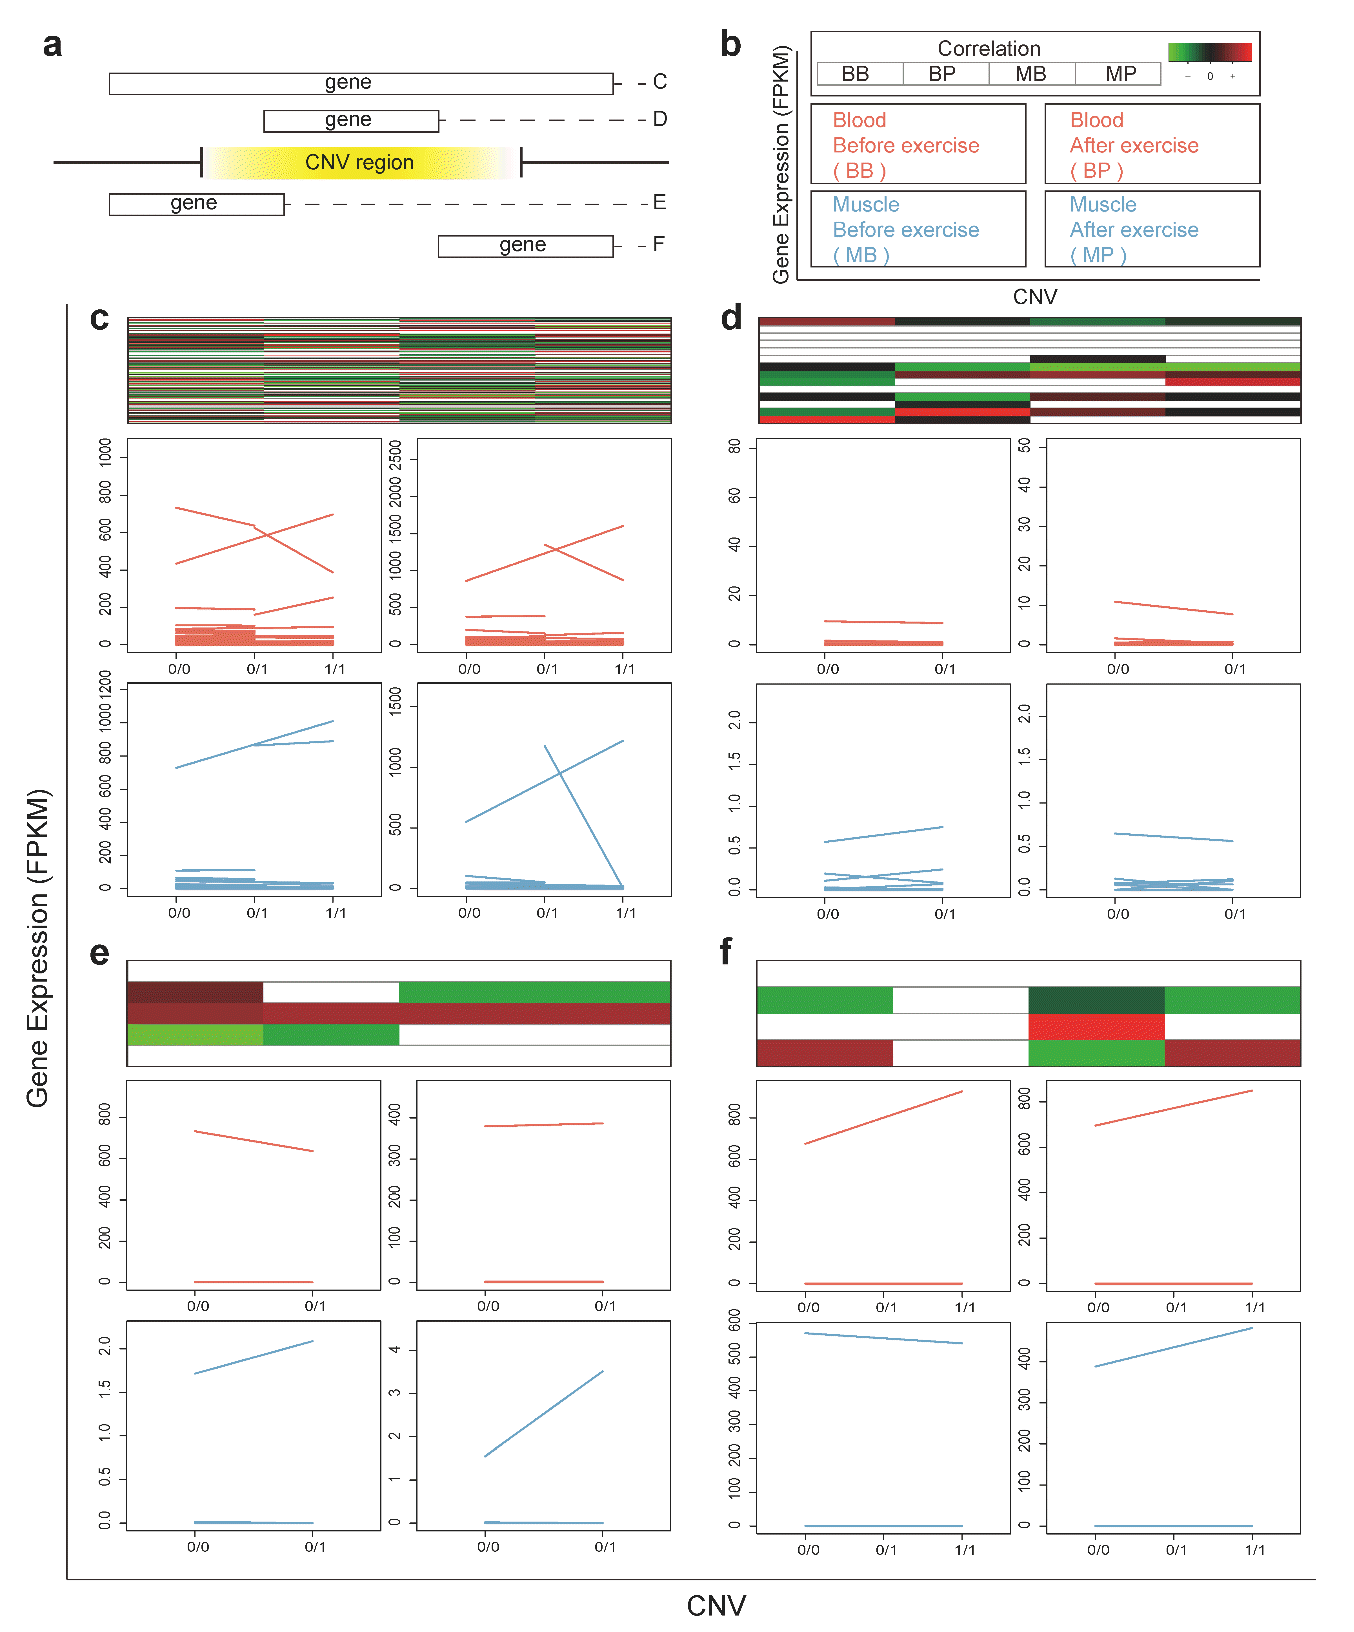
We identified 2,648 possible CNVs from 10,094 CNV candidates using GenomeSTRiP (Handsaker et al., 2011). We retained 1,246 CNVs of deletion calls after applying the genotype quality threshold for further analysis. These plausible CNVs of deletion polymorphisms were linked to the gene expression profiles of four Thoroughbred horses depending on their start-end position. There were four possible position classifications: ‘cover’ indicates that the genes cover CNV regions, ‘inside’ indicates that the genes are located in CNV regions, ‘front’ indicates that the genes span the front part of the CNV regions, and ‘rear’ indicates that the genes span the rear part of the CNV regions (Figure 2a). Genes not expressed in all four conditions (i.e., blood and skeletal muscle, before and after exercise) were removed from the expression profiles of the four Thoroughbred horses. Finally, we obtained a total of 252 pairs of CNVs and associated genes, including 229 pairs in the ‘cover’ group, 14 in the ‘inside’ group, 5 in the ‘front’ group, and 4 in the ‘rear’ group.
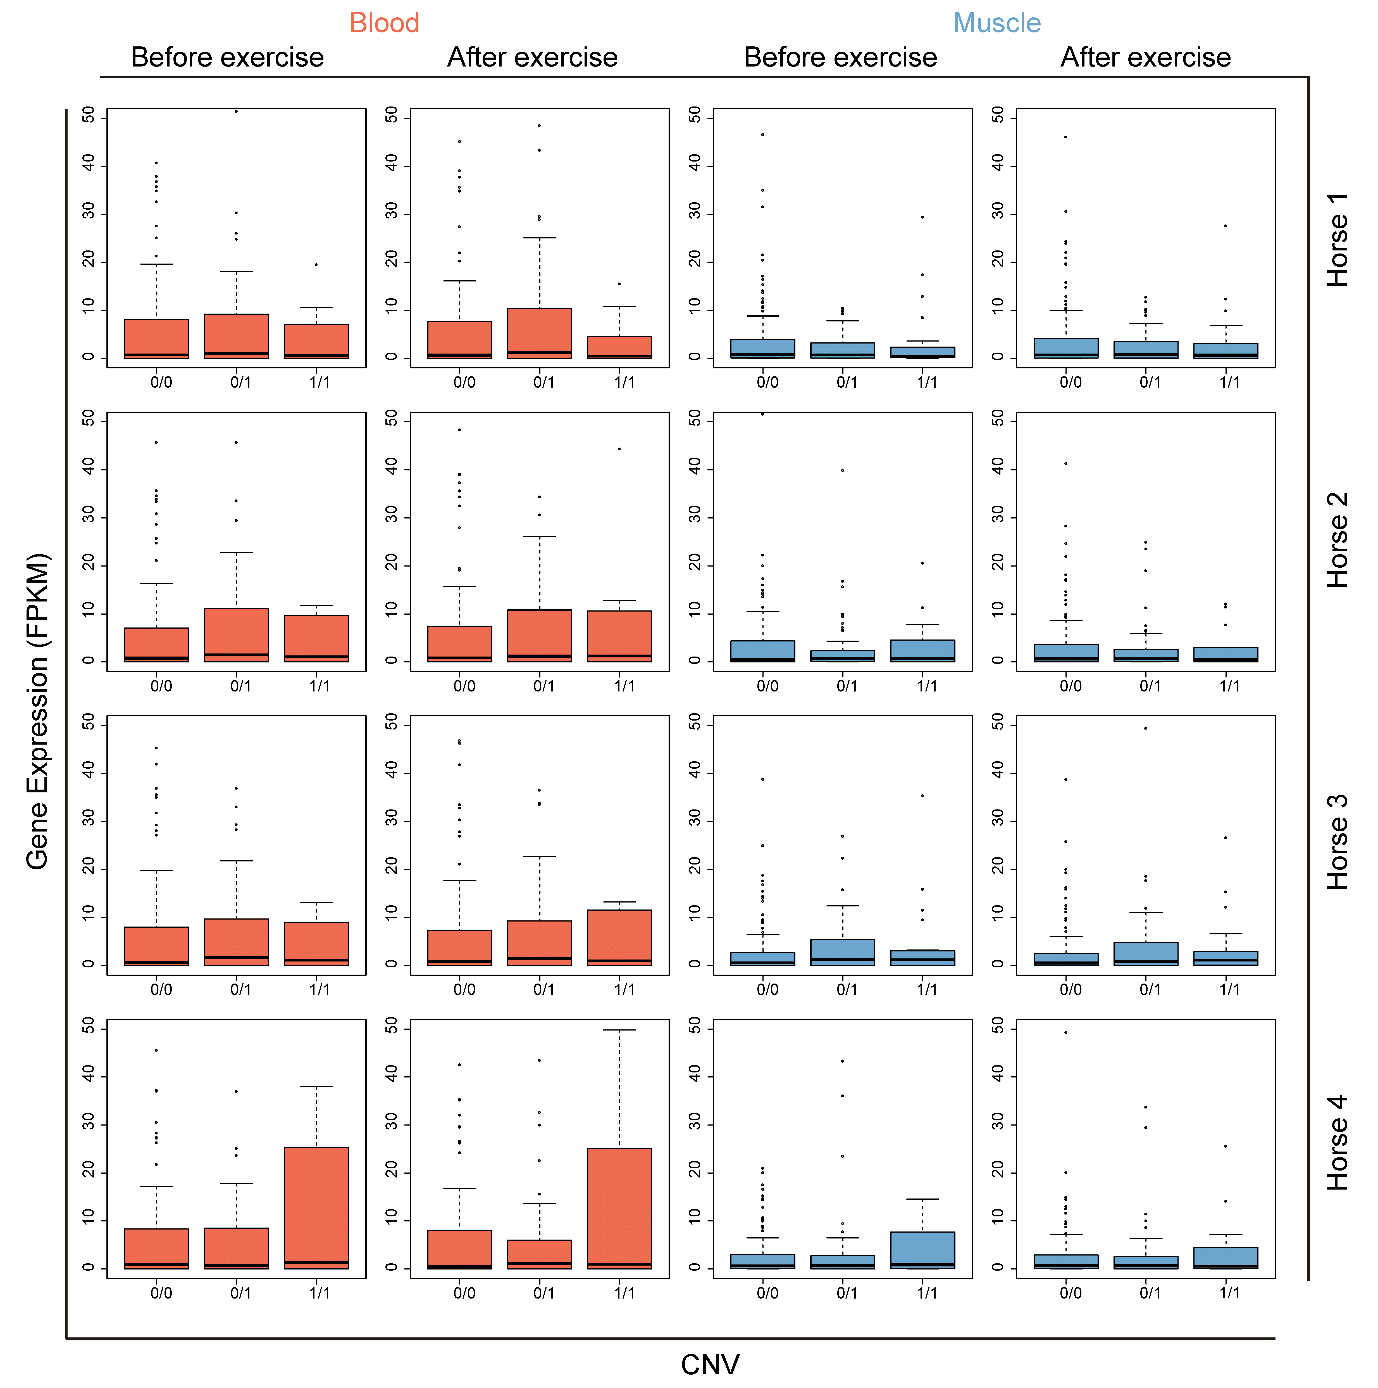
For each pair of CNVs and associated genes in the skeletal Box-and-Whisker plot was used to display the relationship between CNV status and its position-linked gene expression levels. Figure 1 and Supplementary Figure 2 to 4 depict the relationship between CNVs and gene expression in the ‘cover’, ‘inside’, ‘front’ and ‘rear’ groups. The deletion status of CNVs was denoted by 0/0 for no deletion at the population- or individual-based CNV region, 0/1 for one allele deletion at the CNV region, or 1/1 for two allele deletions at the CNV region. From the plots, we observed only a reduced gene expression pattern according to allele deletion in the blood of the ‘inside’ group. For the other groups, we observed no common tendency of positive or negative correlation patterns between the deletion status of CNVs and gene expression levels in blood and muscle before and after exercise.
The linear regression slope was estimated for each pair of CNVs and associated genes to examine the relationship between gene expression level and CNV deletion status individually. Supplementary Figure 1a displays the PAK7 gene expressions of the four horses (sampled in blood before exercise) and their linked CNV region deletion status, showing a pattern of decreased expression with an increasing number of allele deletions. In contrast, Supplementary Figure 1b presents the HLA-DQB1 gene (DQB gene in horse) expression levels of the four horses (sampled in blood before exercise) and their linked CNV region deletion status, showing a pattern of increased expression with an increasing number of allele deletions.
For the entire trend of increased or decreased gene expression level according to CNV deletion status, the linear regression lines in all four conditions are shown in Figure 2(c, d, e, and f) and the linear regression results in Supplementary Table 1. In all position-related groups and sampling conditions, the linear regression results did not show a clear consistent positive or negative relationship between CNV deletion status and gene expression levels in blood and muscle before and after exercise.
In Supplementary Table 1, the number of positive and negative slope groups indicted no significant difference between the numbers of the positive and negative slope groups at each condition using a paired sample t-test (p = 0.692).
For the genes that showed a consistent tendency in the four sampling conditions, human HGNC (Human genome organisation Gene Nomenclature Committee) symbols were annotated using the Ensembl orthologous information, and using the human HGNC symbols, those involved in KEGG pathways were identified (Supplementary Table 2). Among them, 15 genes showed decreased expression patterns when the allele deletion occurred at CNVs in the ‘cover’ group and in all four sampling conditions (cover negative), and 12 genes show increased expression patterns when the allele deletion occurred at CNVs in the ‘cover’ group (cover positive). Only one gene showed decreased expression when the allele deletion occurred at a CNV region in the ‘inside’ group (inside negative). In ‘cover negative’, the KEGG pathway term ‘cell adhesion molecules’—which includes CNTN1 and PTPRM genes was—enriched.
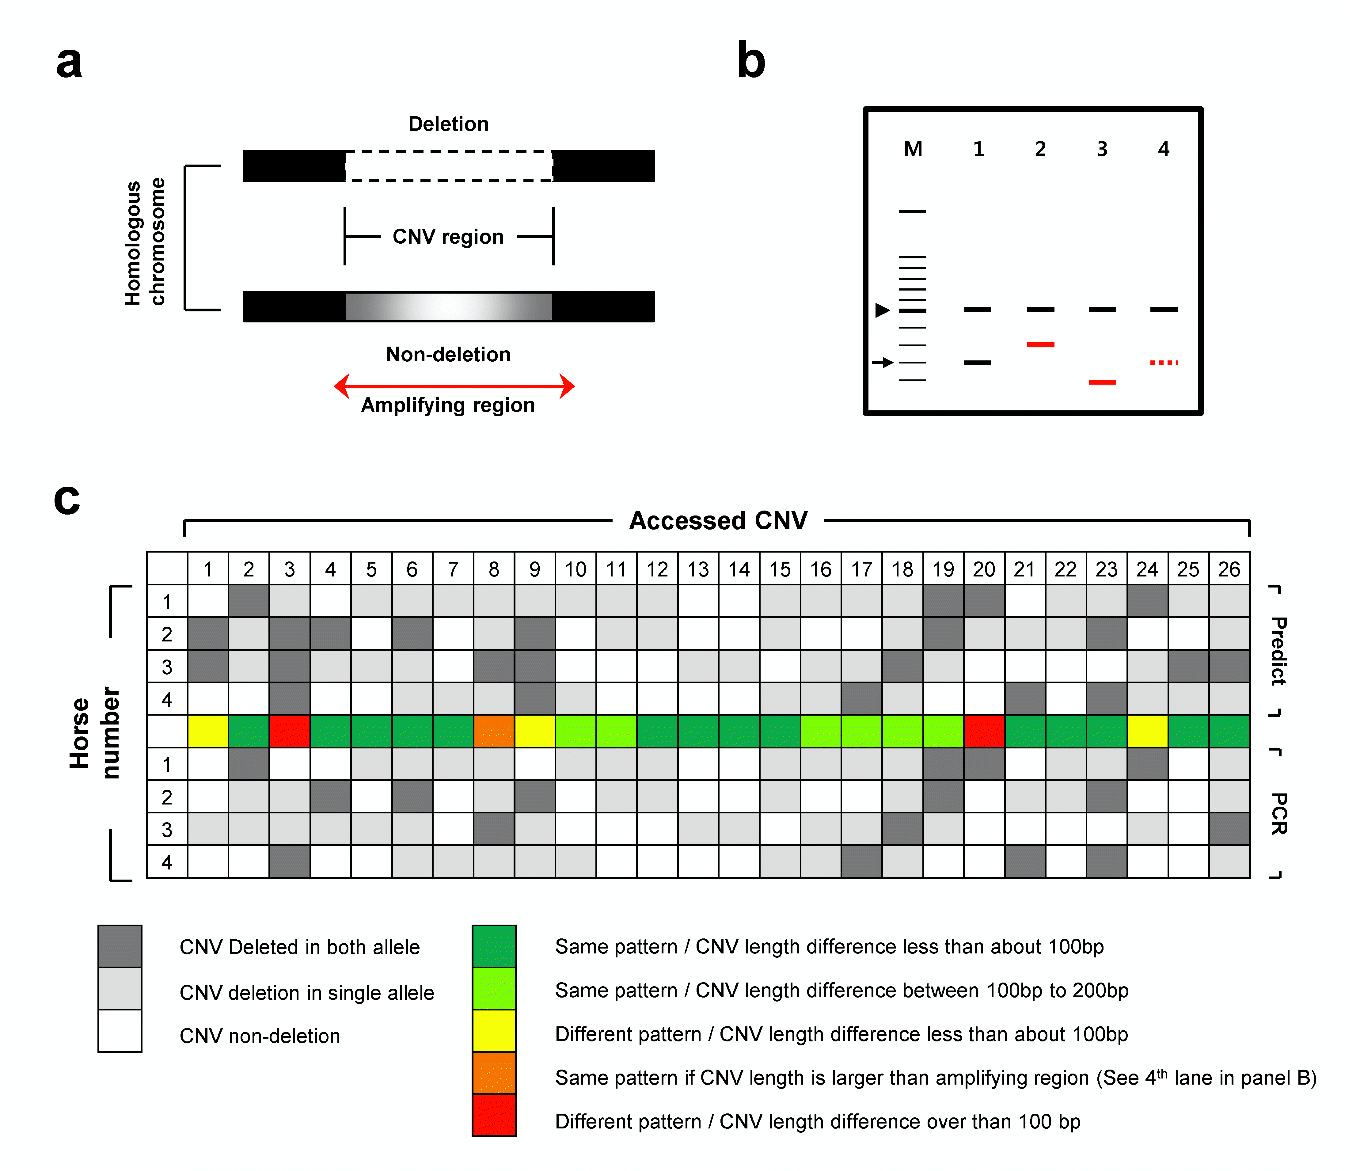
To confirm that the extracted CNV region is genuine, we performed genomic DNA PCR with CNV region-spanning primer sets (Figure 3a and Supplementary Table 4). Among the extracted CNV regions that were of appropriate size for PCR (<2.5 kb), 26 CNV regions were selected randomly and the CNV deletion type and length in each was examined (Supplementary Figure 5). The amplicons in the deleted allele in the CNV region were of three sizes in comparison to the prediction by GenomeSTRiP: i) similar size of amplicon in the deleted allele in the CNV region (Figure 3b, lane 1), ii) 100 to 200 bp difference in the deleted allele (Figure 3b, lanes 2 and 3), and iii) absence of amplicon (Figure 3b, lane 4). The amplicon size differences might be due to the genuine CNV region length being shorter (second case) or longer (third case) than that predicted by GenomeSTRiP. Then, the distribution of CNV-deleted or -non-deleted alleles in each individual by PCR was compared to the expected model. By combining the criteria of ‘deleted amplicon size’ and ‘distribution of CNV in each individual’, we evaluated the extracted CNV region as proper or non-proper according to five classifications (Figure 3c): same pattern and CNV length difference <100 bp (green box) or 100 to 200 bp difference (yellow-green box); different pattern but <100 bp CNV length difference (yellow box); same pattern but the CNV was larger than the amplifying region (orange box, CNV8), or both the CNV distribution and amplicon size did not match those expected (red box). We considered that the PCR result showing the same CNV distribution pattern and <200 bp difference in the amplicon of the deleted allele (green and yellow-green boxes) was the proper CNV region. According to this standard, the validation process indicated that the extracting CNV region had 76.92% accuracy (Figure 3c, 20 proper CNV regions of 26 CNV regions examined).

DISCUSSION

In a recent study, 2,368 CNVs were identified using array-based methods (Doan et al., 2012). In the current study, 1,246 CNVs of deletion calls were identified using DNA re-sequencing data from 18 Thoroughbred racing horses. Because we used a different approach to identify CNVs based on re-sequencing data, there could be a difference by platform. Also, the caveat of this approach with the GenomeSTRiP algorithm is that it detects only CNVs of deletions, excluding detection of CNV duplication calls.
We might expect that transcription start sites are located near the start position of genes. In cases of ‘cover’ (the genes cover CNV regions) and ‘front’ (the genes span the front part of the CNV regions), these CNVs will not affect the transcription start site of the position-linked genes, but will affect the gene contents. Thus, cover and front CNVs are expected to affect only a small portion of position-linked gene expression variation. However, in the cases of ‘inside’ (the genes are located in CNV regions) and ‘rear’ (the genes span the rear part of the CNV regions), these CNVs will affect the transcription start site of the position-linked gene. Thus, inside and rear CNVs are expected to affect gene expression levels significantly. In other words, in the former two cases the expression of genes linked with CNVs may show moderate correlation with copy number changes, whereas in the latter two cases the expression of genes linked with CNVs may exhibit strong correlation with copy number changes. However, in this study, the correlation between the gene expression levels and copy number changes was not marked. Gene expression patterns before and after exercise were analyzed by box plot (Figure 1 and Supplementary Figures 2 to 4) and showed no consistent trend based on copy number changes.
Moreover, a set of individual linear regression lines calculated for single pairs of CNVs and associated genes did not reveal a consistent trend, and the gene expression slope did not show a significant difference in terms of an increasing or decreasing pattern according to copy number changes (Figure 2 and Supplementary Table 1). These results indicate that the CNVs of deletion calls have little relationship with genome-wide expression in the racing horse. This little relationship of the CNVs to gene expression does not agree with a previous study in mouse (Henrichsen et al., 2009b), which reported a moderate correlation between gene copy number and expression. However, our study did not show a significant correlation between gene copy number and expression in the racing horse. This may be due to the CNV identification method, as the copy number was measured in a relative way using a population-based method instead of the individual-based method used in the mouse study. However, in our study, GenomeSTRiP uses both population-level concepts (e.g., average read depth) and the technical features of sequence data of each individual sample such as breakpoint-spanning reads that reflect structural variation (Handsaker et al., 2011; Mills et al., 2011). This unique approach may have contributed to the difference. It is also possible that the difference is due to the gene expression estimate based on RNA sequencing being more sensitive than that of an expression array. Further, the results may differ because the gene copy number and expression data set was only half that of mouse because we only have CNVs of deletion calls, and because our CNV status was clearly presented by allele deletion information. Moreover, we used expression data sets from four horses, whereas the mouse study was based on expression data in only one strain with extreme homozygosity, which may have made identification of common tendency in horse difficult. For example, there is a correlation between gene copy number status and expression if only CNVs of the ‘cover’ group in the skeletal muscle tissue of horse 1 are considered (Figure 1), or CNVs of the ‘inside’ group in blood are considered (Supplementary Figure 2). Also, the simple relationship between CNVs and gene expression could be due to strong tissue-specific transcriptional regulation (Subramanian et al., 2005) and strong individual-specific transcriptional regulation due to differences in individual physical activity and nutritional status (Cobb et al., 2005) or by epigenetic regulation by differential genomic imprinting (Jaenisch and Bird, 2003).
From the linear regression results in Supplementary Table 1, it appears that gene expression levels increased or decreased according to allele deletion at CNV regions by chance. One third of CNV linked genes showed increased expression, and one-third showed increased expression, according to copy number. Such observations are in line with findings that genes can show both increased (Somerville et al., 2005; McCarroll and Altshuler, 2007) or decreased (Lee et al., 2006; Guryev et al., 2008) expression with increasing copy number. These patterns of partial or no correlation observed overall suggest either dosage compensation mechanisms or the incomplete inclusion of regulatory elements in the deletion events (Henrichsen et al., 2009a).
The genes showing consistent tendency in the four sampling conditions (blood, skeletal muscle, before and after exercise) were identified and are listed in Supplementary Table 2. In the ‘cover negative’ group, in which the genes cover the CNV region and show decreased gene expression patterns according to allele deletions at the CNV region, it appears that those genes are involved mainly in membrane structure or cytoskeleton. In the DAVID enrichment test, the KEGG pathway term ‘cell adhesion molecules’ was enriched, which includes CNTN1 and PTPRM genes. DIAPH3 and PAK7 genes (Supplementary Figure 1a) are involved in the ‘regulation of actin cytoskeleton’ term of the KEGG pathway. The ANK1 gene encodes Ankyrins, which are a family of proteins that link membrane proteins to the cytoskeleton (Chorzalska et al., 2010), and the APBB1IP gene functions in signal transduction from Ras activation to cytoskeleton remodeling (Inagaki et al., 2003). These cellular-structure-related genes were not likely under tight transcriptional regulation, which could be due to the buffering effect of those genes on dosage alteration.
In the ‘cover positive’ group, in which the genes cover the CNV region and show increased expression patterns according to allele deletion at the CNV region, there were two disease related KEGG pathway terms including two genes, PARK2 for Parkinson’s disease and HLA-DQB1 (DQB gene in horse) (Supplementary Figure 1b) for immune disease. PARK2 encodes the Parkin protein which plays a role in the cellular machinery that degrades unneeded proteins by ubiquitin tagging (Dawson and Dawson, 2010). PARK2 haploinsufficiency is a risk factor for Parkinson’s disease, and deletions within PARK2 are associated with its development (Pankratz et al., 2011). HLA-DQB1, a gene in the human leukocyte antigen (HLA) region, has an important association with autoimmune disease, and a HLA-DQB1 polymorphism was reported to be associated with susceptibility to systemic lupus erythematosus (Castaño-Rodríguez et al., 2008). A similar pattern was observed in DEFA3, the human α-defensin gene that plays an important role in the innate immune system; DEFA3 expression was not correlated with genomic copy number (Aldred et al., 2005). Higher expression levels may compensate for lower specific activity. Also, dosage mutation by CNVs could trigger the overexpression of specific genes. However, overexpression according to deletions in CNV regions has not been investigated extensively.
In our CNV validation, we found 77% concordance between the GenomeSTRiP and PCR results. Previous validation reports of GenomeSTRiP prediction showed 83% concordance (5,833 of 7,015 CNVs validated by PCR, array data or breakpoint assembly) (Handsaker et al., 2011) and 87% concordance (14 of 16 CNVs validated by quantitative PCR) (Xi et al., 2011). In comparison, the accuracy of CNV prediction by GenomeSTRiP was moderate.
Due to our limited sample size, the CNV set may include a minor fraction of false positive error. Thus, a large sample size is required, which was not possible in this study. Besides, a more complete set of CNVs—including duplication or insertion call sets—is needed for a more accurate assessment of the impact of CNVs on gene expression. However, we believe that our analyses represent a foundation for further studies of CNVs that affect gene expression.
In summary, we did not observe a clear and consistent relationship between the deletion status of CNVs and gene expression levels before and after exercise in blood and muscle. However, we found some pairs of CNVs and associated genes that indicated relationships with gene expression levels: a positive relationship with genes responsible for membrane structure or cytoskeleton and a negative relationship with genes involved in disease. These observations indicate that copy number deletion has little impact on gene expression levels in racehorses. Our study provides new information regarding the relationship between CNVs and global gene expression in horse. It also motivates further work, such as unraveling the molecular basis of the tight gene expression regulation in spite of allele deletion at CNV regions and the evolutionary mechanism involving ancestral and recent CNVs.

Notes

ETHICS STATEMENT

This study was carried out in strict accordance with the recommendations in the Guide for the Care and Use of Laboratory Animals of Pusan National University. All experimental procedures used in this study were approved by the Institutional Animal Care and Use Committee of the Pusan National University (PNU-2013-0417). The owners of the Thoroughbred horses gave permission for their animals to be used in this study.

AUTHOR CONTRIBUTIONS

K.-D. Park, C.-K. Lee, K.-T. Do, H.-S. Kim, Y.-M. Yang, K.-D. Song, J.-D. Oh, H.-K. Lee, and S. Cho helped to draft the manuscript. H. Kim participated in the design of the study, carried out the structural variation analysis, RNA-seq expression analysis and drafted the manuscript. J. Y. Hwang carried out the CNV validation. Y. Kwon participated in re-sequencing data analysis. J. Kim and H. J. Kim participated in drafting the manuscript. H. Kim participated in the design of the study and helped to draft the manuscript. B.-W. Cho generated raw data (RNA-seq and DNA re-sequencing of 4 Thoroughbred horses). All authors read and approved the final manuscript.

CONFLICT OF INTEREST

We certify that there is no conflict of interest with any financial organization regarding the material discussed in the manuscript.

ACKNOWLEDGMENTS

The DNA re-sequencing data of four Thoroughbred horses from this study have been submitted to the NCBI SRA database under accession number SRP017702. This work was supported by the National Research Foundation of Korea Grant funded by the Korean Government (NRF-2013R1A1A2012586).

Figure 1
The skeletal Box and Whisker plots show the relationships between copy number variations (CNVs) and ‘cover’ position linked gene expression in blood and muscle before and after exercise of four Thoroughbred horses. The ‘cover’ means that the genes cover CNV regions. In each box plot, x-axis shows the deletion status of CNVs and y-axis shows the gene expression level (FPKM). The deletion status of CNVs are denoted by 0/0, 0/1, and 1/1. The 0/0 indicates that the individual or population is homozygous for the wild-type, and the 0/1 indicates that the individual or population is heterozygous for the CNV, and the 0/1 indicates that the individual or population is homozygous for the CNV. The sampling conditions in four horses are shown on the top of the figure, which are blood (red rectangles in the box plot) and muscle (blue rectangles in the box plot) before and after exercise. On the right side of the panel individual horse number was shown.
ajas-27-9-1345f1.gif
Figure 2
Plot of linear regression and correlation. Plot of linear regression and correlation of gene expression and deletion status of copy number variations (CNVs) in all four conditions (blood and skeletal muscle, before and after exercise) is shown. The position relationships between CNVs and linked genes are shown in (a). The ‘cover’ indicates that the genes cover CNV regions, ‘inside’ indicates that the genes are located in CNV regions, ‘front’ indicates that the genes span the front part of the CNV regions, and ‘rear’ indicates that the genes span the rear part of the CNV regions. The characters C, D, E, and F on the right side of the position relationships matches (c), (d), (e), and (f). To indicate each sampling condition of (c–f), a simple sampling condition diagram using the same color scheme is shown in (b) (red for blood and blue for muscle).
ajas-27-9-1345f2.gif
Figure 3
Copy number variation (CNV) region validation by genomic polymerase chain reaction (PCR) analysis. (a) Genomic DNA amplification model. To validate the reliability of predicted CNV regions using the CNV extraction tool, we performed PCR amplification using the model represented. The primer pairs were designed to contain the CNV region (empty box in CNV del-model and graded box in CNV in-model), and the amplicon is 150 to 350 bp longer than the CNV region. The CNV region deletion type in each individual was confirmed by comparison of the amplicon size. Diagram is not to scale. (b) Amplicon patterns of CNV-deleted alleles by PCR analysis. The PCR amplicons of individuals with CNV deleted and non-deleted alleles are shown (solid triangle for expected non-deleted and arrow for expected deleted). Compared to the predicted size, the following four categories of CNV-deleted allele amplicon size were identified (lane 1–4, red line): similar to predicted size (lane 1), large (lane 2), or small (lane 3) amplicon size, and absence of amplicon from the CNV deleted allele (lane 4, dashed red line). M indicates size marker. (c) CNV patterns of each individual summarized as a heat map. Randomly selected CNV regions obtained using the extraction tool were assessed by PCR analysis. Dark gray, gray, and white boxes indicate two, one, and non-CNV deletions, respectively. By comparing the CNV allele distribution in each individual and amplicon size in CNV-deleted alleles between the predicted and experimental results, we evaluated the suitability of each extracted CNV region by classifying the PCR results into five categories, as described in the Results section (green box to red box).
ajas-27-9-1345f3.gif

REFERENCES

Aitman TJ, Dong R, Vyse TJ, Norsworthy PJ, Johnson MD, Smith J, Mangion J, Roberton-Lowe C, Marshall AJ, Petretto E, et al. 2006. Copy number polymorphism in Fcgr3 predisposes to glomerulonephritis in rats and humans. Nature 439:851–855.
crossref pmid
Aldred PMR, Hollox EJ, Armour JAL. 2005. Copy number polymorphism and expression level variation of the human α-defensin genes DEFA1 and DEFA3. Hum Mol Genet 14:2045–2052.
crossref pmid
Alkan C, Coe BP, Eichler EE. 2011. Genome structural variation discovery and genotyping. Nat Rev Genet 12:363–376.
crossref pmid pmc
Alterovitz G, Ramoni MF. 2010. Knowledge Based Bioinformatics: From Analysis to Interpretation. John Wiley & Sons, Ltd; Chichester, UK:

Alvarez CE, Akey JM. 2012. Copy number variation in the domestic dog. Mamm Genome 23:144–163.
crossref pmid
Bolstad B. preprocessCore: A collection of pre-processing functions. R package version 1.

Castaño-Rodríguez N, Diaz-Gallo LM, Pineda-Tamayo R, Rojas-Villarraga A, Anaya JM. 2008. Meta-analysis of HLA-DRB1 and HLA-DQB1 polymorphisms in Latin American patients with systemic lupus erythematosus. Autoimmun Rev 7:322–330.
crossref pmid
Chorzalska A, Łach A, Borowik T, Wolny M, Hryniewicz-Jankowska A, Kolondra A, Langner M, Sikorski AF. 2010. The effect of the lipid-binding site of the ankyrin-binding domain of erythroid β-spectrin on the properties of natural membranes and skeletal structures. Cell Mol Biol Lett 15:406–423.
crossref pmid pmc
Cobb JP, Mindrinos MN, Miller-Graziano C, Calvano SE, Baker HV, Xiao W, Laudanski K, Brownstein BH, Elson CM, Hayden DL, et al. 2005. Application of genome-wide expression analysis to human health and disease. Proc Natl Acad Sci USA 102:4801–4806.
crossref pmid pmc
Dawson TM, Dawson VL. 2010. The role of parkin in familial and sporadic Parkinson’s disease. Mov Disord 25:S32–S39.
crossref pmid pmc
Dennis G, Sherman BT, Hosack DA, Yang J, Gao W, Lane HC, Lempicki RA. 2003. DAVID: database for annotation, visualization, and integrated discovery. Genome Biol 4:R60.
crossref pmc
Doan R, Cohen N, Harrington J, Veazy K, Juras R, Cothran G, McCue ME, Skow L, Dindot SV. 2012. Identification of copy number variants in horses. Genome Res 22:899–907.
crossref pmid pmc
Feuk L, Carson AR, Scherer SW. 2006. Structural variation in the human genome. Nat Rev Genet 7:85–97.
crossref pmid
Gonzalez E, Kulkarni H, Bolivar H, Mangano A, Sanchez R, Catano G, Nibbs RJ, Freedman BI, Quinones MP, Bamshad MJ, et al. 2005. The influence of CCL3L1 gene-containing segmental duplications on HIV-1/AIDS susceptibility. Science 307:57141434–1440.
crossref pmid
Guryev V, Saar K, Adamovic T, Verheul M, van Heesch SAAC, Cook S, Pravenec M, Aitman T, Jacob H, Shull JD, Hubner N, Cuppen E. 2008. Distribution and functional impact of DNA copy number variation in the rat. Nat Genet 40:538–545.
crossref pmid
Handsaker RE, Korn JM, Nemesh J, McCarroll SA. 2011. Discovery and genotyping of genome structural polymorphism by sequencing on a population scale. Nat Genet 43:269–276.
crossref pmid pmc
Henrichsen CN, Chaignat E, Reymond A. 2009a. Copy number variants, diseases and gene expression. Hum Mol Genet 18:R1–R8.
crossref pmid
Henrichsen CN, Vinckenbosch N, Zöllner S, Chaignat E, Pradervand S, Schütz F, Ruedi M, Kaessmann H, Reymond A. 2009b. Segmental copy number variation shapes tissue transcriptomes. Nat Genet 41:424–429.
crossref pmid
Hollox EJ, Armour JAL, Barber JCK. 2003. Extensive normal copy number variation of a β-defensin antimicrobial-gene cluster. Am J Hum Genet 73:591–600.
crossref pmid pmc
Hornik K. The R FAQ [Internet]. 3-900051-08-9Available from: http://CRAN.R-project.org/doc/FAQ/R-FAQ.html

Hosack DA, Dennis G, Sherman BT, Lane HC, Lempicki RA. 2003. Identifying biological themes within lists of genes with. EASE Genome Biol 4:R70.
crossref pmid pmc
Inagaki T, Suzuki S, Miyamoto T, Takeda T, Yamashita K, Komatsu A, Yamauchi K, Hashizume K. 2003. The retinoic acid-responsive proline-rich protein is identified in promyeloleukemic HL-60 cells. J Biol Chem 278:51685–51692.
crossref pmid
Jaenisch R, Bird A. 2003. Epigenetic regulation of gene expression: How the genome integrates intrinsic and environmental signals. Nat Genet 33:245–254.
crossref pmid
Kim H, Lee T, Park W, Lee JW, Kim J, Lee B-Y, Ahn H, Moon S, Cho S, Do K-T, et al. 2013. Peeling back the evolutionary layers of molecular mechanisms responsive to exercise-stress in the skeletal muscle of the racing horse. DNA Res 20:287–298.
crossref pmid pmc
Langmead B, Salzberg SL. 2012. Fast gapped-read alignment with Bowtie 2. Nat Methods 9:357–359.
crossref pmid pmc
Lee JA, Madrid RE, Sperle K, Ritterson CM, Hobson GM, Garbern J, Lupski JR, Inoue K. 2006. Spastic paraplegia type 2 associated with axonal neuropathy and apparent PLP1 position effect. Ann Neurol 59:398–403.
crossref pmid
Li H, Handsaker B, Wysoker A, Fennell T, Ruan J, Homer N, Marth G, Abecasis G, Durbin R. 2009. The sequence alignment/map format and SAMtools. Bioinformatics 25:2078–2079.
crossref pmid pmc
McCarroll SA, Altshuler DM. 2007. Copy-number variation and association studies of human disease. Nat Genet 39:S37–S42.
crossref pmid
McKenna A, Hanna M, Banks E, Sivachenko A, Cibulskis K, Kernytsky A, Garimella K, Altshuler D, Gabriel S, Daly M, DePristo MA. 2010. The Genome Analysis Toolkit: a MapReduce framework for analyzing next-generation DNA sequencing data. Genome Res 20:1297–1303.
crossref pmid pmc
Mills RE, Walter K, Stewart C, Handsaker RE, Chen K, Alkan C, Abyzov A, Yoon SC, Ye K, Cheetham RK, et al. 2011. Mapping copy number variation by population-scale genome sequencing. Nature 470:59–65.
crossref pmid pmc
Orozco LD, Cokus SJ, Ghazalpour A, Ingram-Drake L, Wang S, Van Nas A, Che N, Araujo JA, Pellegrini M, Lusis AJ. 2009. Copy number variation influences gene expression and metabolic traits in mice. Hum Mol Genet 18:4118–4129.
crossref pmid pmc
Pankratz N, Dumitriu A, Hetrick KN, Sun M, Latourelle JC, Wilk JB, Halter C, Doheny KF, Gusella JF, Nichols WC, et al. 2011. Copy number variation in familial Parkinson disease. PloS one 6:e20988.
crossref pmid pmc
Park K-D, Park J, Ko J, Kim BC, Kim H-S, Ahn K, Do K-T, Choi H, Kim H-M, Song S, et al. 2012. Whole transcriptome analyses of six thoroughbred horses before and after exercise using RNA-Seq. BMC Genomics 13:473.
crossref pmid pmc
Reich DE, Schaffner SF, Daly MJ, McVean G, Mullikin JC, Higgins JM, Richter DJ, Lander ES, Altshuler D. 2002. Human genome sequence variation and the influence of gene history, mutation and recombination. Nature Genet 32:135–142.
crossref pmid
Sachidanandam R, Weissman D, Schmidt SC, Kakol JM, Stein LD, Marth G, Sherry S, Mullikin JC, Mortimore BJ, Willey DL, et al. 2001. A map of human genome sequence variation containing 1.42 million single nucleotide polymorphisms. Nature 409:928–933.
crossref pmid
Scherer SW, Lee C, Birney E, Altshuler DM, Eichler EE, Carter NP, Hurles ME, Feuk L. 2007. Challenges and standards in integrating surveys of structural variation. Nat Genet 39:S7–S15.
crossref pmid pmc
Sharp AJ, Cheng Z, Eichler EE. 2006. Structural variation of the human genome. Annu Rev Genomics Hum Genet 7:407–442.
crossref pmid
Somerville MJ, Mervis CB, Young EJ, Seo EJ, del Campo M, Bamforth S, Peregrine E, Loo W, Lilley M, Pérez-Jurado LA. 2005. Severe expressive-language delay related to duplication of the Williams–Beuren locus. N Engl J Med 353:1694–1701.
crossref pmid pmc
Subramanian A, Tamayo P, Mootha VK, Mukherjee S, Ebert BL, Gillette MA, Paulovich A, Pomeroy SL, Golub TR, Lander ES, Mesirov JP. 2005. Gene set enrichment analysis: A knowledge-based approach for interpreting genome-wide expression profiles. Proc Natl Acad Sci USA 102:15545–15550.
crossref pmid pmc
Trapnell C, Williams BA, Pertea G, Mortazavi A, Kwan G, Van Baren MJ, Salzberg SL, Wold BJ, Pachter L. 2010. Transcript assembly and quantification by RNA-Seq reveals unannotated transcripts and isoform switching during cell differentiation. Nat Biotechnol 28:511–515.
crossref pmid pmc
Xi R, Hadjipanayis AG, Luquette LJ, Kim T-M, Lee E, Zhang J, Johnson MD, Muzny DM, Wheeler DA, Gibbs RA, et al. 2011. Copy number variation detection in whole-genome sequencing data using the Bayesian information criterion. Proc Natl Acad Sci 108:E1128–E1136.
crossref pmid pmc
TOOLS
METRICS Graph View
  • 5 Crossref
  • 5 Scopus
  • 14,769 View
  • 99 Download
Related articles


Editorial Office
Asian-Australasian Association of Animal Production Societies(AAAP)
Room 708 Sammo Sporex, 23, Sillim-ro 59-gil, Gwanak-gu, Seoul 08776, Korea   
TEL : +82-2-888-6558    FAX : +82-2-888-6559   
E-mail : editor@animbiosci.org               

Copyright © 2024 by Asian-Australasian Association of Animal Production Societies.

Developed in M2PI

Close layer
prev next