Genome-wide Association Study for Warner-Bratzler Shear Force and Sensory Traits in Hanwoo (Korean Cattle)
Article information
Abstract
Significant SNPs associated with Warner-Bratzler (WB) shear force and sensory traits were confirmed for Hanwoo beef (Korean cattle). A Bonferroni-corrected genome-wide significant association (p<1.3×10⁻⁶) was detected with only one single nucleotide polymorphism (SNP) on chromosome 5 for WB shear force. A slightly higher number of SNPs was significantly (p<0.001) associated with WB shear force than with other sensory traits. Further, 50, 25, 29, and 34 SNPs were significantly associated with WB shear force, tenderness, juiciness, and flavor likeness, respectively. The SNPs between p = 0.001 and p = 0.0001 thresholds explained 3% to 9% of the phenotypic variance, while the most significant SNPs accounted for 7% to 12% of the phenotypic variance. In conclusion, because WB shear force and sensory evaluation were moderately affected by a few loci and minimally affected by other loci, further studies are required by using a large sample size and high marker density.
INTRODUCTION
As a consequence of the recent economic growth, the human diet has dramatically changed, with an increasing demand for healthier meat. The eating quality of beef is the result of a combination of factors, including tenderness, juiciness, and flavor likeness (Koohmararaie et al., 2002), which contribute to the consumer’s perception of meat palatability or satisfaction (Jeremiah, 1982). The tenderness is usually considered the most important quality aspect of meat and criterion of acceptability (Love, 1994; Koohmaraie et al., 1994). Also, a positive correlation between Warner-Bratzler (WB) shear force values and the sensory assessment of beef tenderness was investigated (Caine et al., 2003; Destefanis et al., 2008). Beef flavor intensity is an important component of meat palatability, and genetic factors are known to influence these traits (Shahidi and Rubin, 1986). Previous work has focused on flavor desirability and its relation to sensory tenderness and juiciness among 12 muscles from grain-fed beef (Carmack et al., 1995). Meat quality is an important factor in the beef industry because the consumer is willing to pay more for higher quality meat products. In particular, consumers have shown a strong willingness to pay a premium for “tender meat” that combines superior tenderness with leanness (Shackelfold et al., 2001; Shackelford et al., 2005).
Beef quality is evaluated by consumers based on sensory considerations of tenderness, flavor likeness, and juiciness (Cho et al., 2010). Traditional genetic improvement programs have focused on quantitative genetic theories using statistical analyses of phenotypes and pedigree information to determine animals with genetic merit. However, the palatable quality of beef is usually measured post-slaughter, which means it is hard to measure and has low heritability (Marshall, 1999). Thus, classical selection based on records is not a feasible option.
Given these conditions, genome-assisted selection, whereby DNA information linked to quantitative trait loci (QTL) of palatable quality traits are used, has the potential to improve the selection of low heritability sensory traits. Several DNA markers associated with meat quality traits have been identified in the last decade. In cattle, for meat and carcass quality, 2 genes account for moderate genetic effects on meat tenderness, including calpain 1 (CAPN1) and calpastatin (CAST), which have been confirmed in previous studies (Page et al., 2002; Page et al., 2004; Casas et al., 2005; White et al., 2005; Casas et al., 2006; Schenkel et al., 2006).
In order to achieve more targeted meat production in the Hanwoo beef industry, the incorporation of DNA marker information into genetic selection methods, such as marker-assisted selection, to identify animals destined for feedlots or seed stocks could be a useful management tool (Rolf et al., 2010). Identifying causal genes affecting quantitative traits may have the potential to improve the efficiency of animal selection and elucidate the underlying, biological mechanisms of quantitative traits.
Recently, the genome-wide association study (GWAS) has been used to identify the causal genes of important genetic traits in livestock. The GWAS uses sequence variations in the whole genome in combination with phenotypic and pedigree information to perform an association analysis and identify the significant genes or regulatory elements for the selection of particular traits. This technique can be applied to control the evolution of a significant gene associated with palatable beef. Therefore, the aim of this study was to identify the significant single nucleotide polymorphism (SNPs) associated with WB shear force and sensory traits using GWAS methodology and evaluate the performance of these traits for the prediction of a phenotype in Hanwoo (Korean cattle).
MATERIALS AND METHODS
Animals
A total of 288 cattle were genotyped, including 116 cows, 90 bulls, and 82 steers. The samples were obtained from the Hanwoo experimental station in Pyeongchang, Gangwon Province, Korea. The data were comprised of paternal half-sib pedigrees from 62 sires.
Warner-Bratzler shear force
The WB-shear force of cooked steaks was measured according to the method described by Wheeler et al. (2000). At 48 h postmortem, 2.5-cm thick meat steaks weighing ~80 g were put into polyethylene bags. The bags were heated in a water bath at 80°C for 30 min until the internal temperature of the steak reached 70°C. After cooking, the samples were cooled at room temperature for 30 min. Six to eight representative, 1.27-cm diameter cores were removed from each steak parallel to the muscle fiber. Shear force values were determined with a Warner-Bratzler shear force attachment on an Instron Universal Testing machine (Instron Corporation, Canton, MA, USA) with the following operating parameters: load cell, 50 kg and crosshead speed, 200 mm/min. Each core sample was sheared once across the center of the core perpendicular to the muscle fiber. The WB shear force value was the mean of the maximum forces required to shear each set of core samples.
Sensory evaluation
Longssimus dorsi (LD) muscles were obtained at 48 h postmortem, vacuum packaged, and aged at 2°C for 7 d. To prepare beef strips, the meat blocks were cut into 75×20×4 mm slices parallel to the fiber direction, vacuum-packed, and frozen at 20°C until analysis. For sensory evaluation, the beef strips were thawed to approximately 4°C. Individual strips were cooked by placing them on a tin plate equipped with a water jacket (ca. 245°C to 255°C). The strips were turned at the first pooling of liquid on the surface of the sample or at the start of shrinkage. The cooked strips were immediately served to each panelist for evaluation. A total of 7 to 9 trained panelists were used for each session. They scored tenderness, juiciness, and flavor likeness on a 10-point scale from one (very tough; very dry; dislike extremely) to 10 (very tender; very juicy; like extremely). Each sample was tested once independently by each panelist. Scores were averaged over the different panelists for each animal.
Genotype assay
Genomic DNA for genotyping assays was extracted from the blood samples using DNeasy 96 Blood and Tissue Kit (Qiagen, Valencia, CA, USA). DNA quantification was performed using a NanoDrop 1000 (Thermo Fisher Scientific Inc., Wilmington, DE, USA). DNA samples were submitted for genotyping with total DNA (900 ng), 260/280 ratio >1.8, and DNA concentration 20 ng/μL. The genotyping was conducted by the Animal Genome and Bioinformatic Division of National Institute of Animal Science, RDA, Korea using the Bovine 50K BeadChip (Illumine, San Diego, CA, USA; Matukumalli et al., 2009). Stringent filtering criteria were applied to the genotype data. Briefly, SNPs were excluded from the analysis if they failed in >5% of the genotypes, had median GC scores <0.6, GC scores <0.6 in <90% of the samples, deviated in heterozygosity >3 standard deviations from the other SNPs, and were out of Hardy–Weinberg equilibrium for a cut-off p value of 1−3. SNPs with auto-calling rates <80% and a minor allele frequency <0.001 were excluded from later analyses. Unmapped SNPs and SNPs on sex chromosomes were also excluded. Individual genotypes with GC scores <0.6 were treated as missing. A total of 38,291 SNPs were included in the analysis.
Statistical analyses
Phenotype and model definitions
To test the association between the SNP and QTL, a single marker linear mixed model was implemented using ASREML Software. Twenty-six markers were assumed to be in LD with QTL in close proximity, and the effect evaluated was the additive effect (QTL allele substitution effect). The additive effect was fitted as a regression of the phenotype on allele counts (0, 1, and 2). The additive effect of a SNP on each phenotype was calculated by regression analysis, with values in the covariate coded as 0, 1, or 2 copies of the variant allele, and fit to the following mixed model: trait ~ mean+fixed effects +SNPi+animal+error, with the animal and error fitted as random effects. The i-th SNP (SNPi) was fitted as a covariate effect. Fixed effects included the year, season, and sex. The day of slaughter was fitted as a covariate effect. Quantile-quantile (Q-Q) plots were investigated to judge the extent of false positive signals. SNPs were considered as significant for p values below the 5% Bonferroni-corrected type I error threshold for 38,291 independent statistical tests. Allele substitution effects were estimated for each significant marker in a linear regression model implemented in ASREML.
Proportion of SNP variance
The percentage of the phenotypic variance explained by each significant SNP was calculated. The percentage of the phenotypic variance accounted by the i-th SNP was computed according to the following formula:
Where: pi and qi are the allele frequencies for the i-th SNP estimated for Hanwoo, ai is the estimated additive effect of the i-th SNP on the phenotype in question, and
Linkage disequilibrium
Linkage disequilibrium refers to the non-random association of alleles at 2+ loci and is important in fine-scale mapping of QTL (Meuwissen and Goddard, 2000). To determine if any of the SNPs significantly associated with tenderness are in linkage disequilibrium with the SNPs in the CAST gene, we selected the markers flanking a 1-Mb region of the CAST SNPs. A total of 24 markers were used to study linkage disequilibrium. Haplotypes were reconstructed using default parameters in PHASE and visualized by means of Heatmap plots obtained with Haploview.
RESULTS AND DISCUSSION
In this genome-wide association study, 288 cattle were used as a GWAS dataset to identify QTLs for distinct Hanwoo phenotypes of WB-shear force values and sensory traits (tenderness, juiciness, and flavor likeness). The 38,291 SNPs on the autosomes that fulfilled the SNP quality control criteria were used for the association analysis. The GWAS analysis was performed using a linear mixed model approach and a numeric relationship matrix estimated by pedigree between animals. Summary statistics for the data are provided in Table 1. Mean values for tenderness, juiciness, and flavor likeness were slightly higher in the steer group than other 2 sexes, while the WB-shear force values were fairly low in the steer group. A total of 18 significant SNPs associated with WB shear force, tenderness, juiciness, and flavor likeness were identified (Table 2). Hapmap40437-BTA-49726 (Chr5; P = 9.29×10⁻⁷; Position-69686900), ARS-BFGL-NGS-110680 (Chr17; P = 5.71×10⁻⁵; Position-4423257), Hapmap42498-BTA-29406 (Chr4; P = 1.64×10⁻⁵; Position-19444028), and BTB-01204750 (Chr6; P = 1.60×10⁻⁵; Position-13417489) were found to be more significantly associated with WB shear force, tenderness, juiciness, and flavor likeness, respectively. Of the 18 identified SNPs, none had a combined effect on traits analyzed in this study. However, 3 distantly located SNPs on chromosome 7 showed an association with all traits, except meat juiciness. Drinkwater et al. (2005) detected QTL affecting beef tenderness on bovine chromosome 7 near CAST and lysyl oxidase. In this study, with the use of a 50 k SNP chip, significant associations were not detected between the SNPs in the CAST gene and meat tenderness. However, we found a significant SNP (ARS-BFGL-NGS-113774) in the 1-Mb region of the CAST SNPs, but we also observed the absence of the linkage disequilibrium structure (Supplementary Figure S7: See e-version for supplement.).
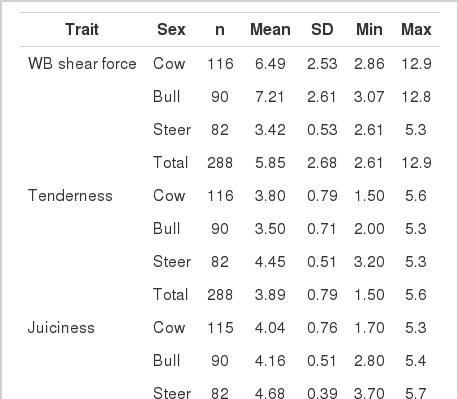
Summary statistics for Warner-Bratzler shear force and sensory evaluation

SNPs showing significant association with Warner-Bratzler shear force and sensory evaluation in 288 Hanwoo animals
However, in a separate study, where we specifically genotyped 3 SNPs in the CAST gene and 4 SNPs in the CAPN1 gene, we identified an association between a mutation and meat tenderness, flavor, and juiciness of Hanwoo meat (Lee et al., 2013). Analyzing the high density (HD) SNP chip can be of importance in this context. Casas (2002) identified QTLs for shear force in 4 half-sib resource populations on chromosomes 4, 5, 15, and 29. Keele et al. (1999) identified a region on bovine chromosome 15 that influences beef longissimus tenderness in steers. While we did identify significant associations on chromosomes 4 and 5, no association was detected on chromosomes 15 and 29. Dunner et al. (2013) identified an association on chromosome 4 (Position: 114895056 Exon 7-S, 114894952 Intron 7) with m-calpain and an association on chromosome 21 (Position: 34318948 Intron1) with juiciness. We identified associations of SNP ARS-BFGL-NGS-80140 on chromosome 4 and ARS-BFGL-NGS-119377 on chromosome 21 in the region close to that identified by Dunner et al. (2013).
In addition, the allele substitution effect for each of the significant SNPs was calculated from linear regression analysis. The most significant SNPs (Hapmap40437-BTA-49726; P = 9.29×10⁻⁷, Hapmap42498-BTA-29406; P = 1.64 ×10⁻⁵, ARS-BFGL-NGS-110680; P = 5.71×10⁻⁵, BTB-01204750; P = 1.60×10⁻⁵) had 0.82,−0.35, 0.28, and 0.17 allele substitution effects for WB shear force, tenderness, juiciness, and flavor likeness, respectively (Table 2).
The Q-Q plot with p<10−3 for WB shear force and sensory evaluation revealed only minimal deviation from the distribution under the null hypothesis (Figure 1; Supplementary Figures S1, S2, and S3: See e-version for supplement.). We calculated the proportion of phenotypic variance explained by the SNPs with a p value of 0.001 (Figure 2; Supplementary Figures S4, S5, and S6: See e-version for supplement.). As shown in Figure 2, each of the SNPs between a threshold of p = 0.001 and p = 0.0001 explained 3% to 9% of the phenotypic variance, which is only a small proportion when compared to the total phenotypic variance. However, the most significant SNPs accounted for 7% to 12% of phenotypic variance, which is a large proportion when compared to the total phenotypic variance.

Association of 38,291 SNPs with the WB shear force. (A) Manhattan plot. (B) Quantile-quantile plot. The red line represents the 95% concentration band under the null hypothesis of no association. The black dot represents the p values of the entire study. SNP, single nucleotide polymorphism; WB, Warner-Bratzler.

The -log p value for the association between SNP and WB shear force (grey) and phenotypic variance (red) that significant SNPs (p<0.001) account for in the single marker regression analysis. SNP, single nucleotide polymorphism; WB, Warner-Bratzler.
A number of SNPs showed slight significant (p<0.001) associations with WB shear force over tenderness, juiciness, or flavor likeness. There were 50, 25, 29, and 34 SNPs with significant associations with WB shear force, tenderness, juiciness, and flavor likeness, respectively. Bolormaa et al. (2011) reported GWAS for meat tenderness measured as peak force to shear (LLPF) to identify 64 significant SNPs (p<0.001) in 940 Australian beef cattle, and there were 5 chromosomes (i.e., 7, 8, 12, 22, and 29) comprising the largest number of significant SNPs at p<0.001. In this study, there were WB shear force (1, 7, 11, 14, 23, and 25), tenderness (7, 23, and 25), juiciness (8, 14, and 21), and flavor likeness (4, 5, and 6) chromosomes with >3 significant SNPs. Despite the differences in breed (i.e., Hanwoo vs Australian beef cattle), 3 traits (LLPF-Australian beef cattle, WB shear force, and tenderness-Hanwoo) measuring meat tenderness were shown to possess the same major chromosome (i.e., BTA7). Moreover, WB shear force and tenderness in Hanwoo had associations with major chromosomes 23, 25, and 7. These may be the most important chromosomes (i.e., BTA7, 23, and 25) associated meat tenderness in Hanwoo.
The previous sensory test results showed that Korean consumers decided the palatability of Hanwoo beef by judging tenderness (55%), juiciness (18%), and flavor likeness (27%) (Cho et al., 2010). Tenderness is considered the most important qualitative characteristic of meat, and the consumer is willing to pay a higher price in the market place for beef as long as it is guaranteed to be tender (Miller et al., 2001). Tenderness can be evaluated by instrumental tests, such as WB-shear force and sensorial panel tests. The correlation coefficient of WB-shear force measurements with tenderness sensory ratings was −0.72 (Destefanis et al., 2008).
In this study, for WB shear force and sensory traits (tenderness, juiciness, and flavor likeness), only one SNP was found to meet the Bonferroni-corrected threshold (p<1.3×10⁻⁶), and the phenotypic variance appeared to be an overestimation in proportion to the significant threshold. These results might be due to the inability of the sample size (n = 288) to successfully map QTL with a small proportion of genetic variation for a complex trait. To achieve an accurate estimation of the SNP effects on traits of interest in GWAS, larger population size and higher density of the markers are required. Pausch et al. (2012) calculated the adequate sample size required to successfully map QTL for a complex trait with very low heritability. He assumed a heritability of 0.08, a linkage disequilibrium between marker SNPs and QTL of r2 = 0.35, and a QTL explanation of 4% of the genetic variation, which would require ~20,000 animals for the successful identification of QTL.
In the dearth of studies considering GWAS on WB shear force and sensory panel traits, this study can act as a primer. The results of this study will be useful in providing fundamental information for genetic improvement in the Hanwoo breed to increase consumer reliability through the implementation of molecular information for palatable quality management. However, because WB shear force and sensory evaluation are affected by a few or many loci with moderate or minimal effects, respectively, across the genome, further study will be needed to examine the WB shear force and sensory traits utilizing a larger population size and HD SNP chip in Hanwoo.
Supplementary Data
ACKNOWLEDGMENTS
This study was supported by awards from the AGENDA project (Grant no. PJ010170) and Molecular Breeding Program of Next Generation BIOGREEN 21 project (Grant no. PJ009954) in the National Institute of Animal Science, Rural Development Administration, Korea.