Go to Top Go to Bottom
Mizanur and Bai: The Optimum Feeding Frequency in Growing Korean Rockfish (Sebastes schlegeli) Rearing at the Temperature of 15°C and 19°C

Abstract

Two feeding trials were conducted to determine the optimum feeding frequency in growing Korean rockfish, (Sebastes schlegeli) reared at the temperatures of 15°C and 19°C. Fish averaging 92.2±0.7 g (mean±standard deviation [SD]) at 15.0±0.5°C and 100.2±0.4 g (mean±SD) at 19.0±0.5°C water temperature were randomly distributed into each of 15 indoor tanks containing 250-L sea water from a semi-recirculation system. A total of five feeding frequency groups were set up in three replicates as follows: one meal in a day at 08:00 hour, two meals a day at 08:00 and 17:00 hours, three meals a day at 08:00, 14:00, and 20:00 hours, four meals a day at 08:00, 12:00, 16:00, and 20:00 hours, and one meal every 2 days at 08:00 hour. Fish were fed at the rate of 1.2% body weight (BW)/d at 15°C and 1.5% BW/d at 19°C. At the end of 8 wks of feeding trial weight gain and specific growth rate were significantly higher at the fish fed groups of one meal a day and two meals a day at 15°C and fish fed groups of 1 meal every 2 days at 19°C were significantly lower than those of all other fish fed groups. Glutamic oxaloacetic transaminase and glutamic pyruvic transaminase of fish fed group at 1 meal every 2 days was significantly higher than those of all other fish fed groups in both experiments. Weight gain, specific growth rate and condition factor were gradually decreased as the feeding frequency increased. The results indicate that growing Korean rockfish 92 and 100 g perform better at 15°C than 19°C water temperature. As we expected, current results have indicated that a feeding frequency of 1 meal a day is optimal for the improvement of weight gain in growing Korean rockfish grown from 92 g to 133 g at 15°C and 100 g to 132 g at 19°C water temperature.

INTRODUCTION

Korean rockfish (Sebastes schlegeli) is one of the most commercially important and second largest marine finfish species in Korea (Bai and Okorie, 2009). It has several important characteristics for aquaculture such as good tolerance to low water temperature, growth, survival and easiness of seedling production due to the viviparous reproduction style (Lee et al., 2000; Moore et al., 2000). Within a given species, numerous factors can influence fish growth, among which the most important are probably temperature and feeding (Gardeur et al., 2007). Temperature regulates metabolic activity and all fish species are characterized by a range of temperature within which growth is maximal (Person-Le Ruyet et al., 2006; Bjornsson et al., 2007). The optimum water temperature increases metabolic rates and also increased feed demand of fish. On the other hand, low temperature causes sluggishness by retarding the digestion speeding of fish (Park et al., 2012). Feeding frequency is an important factor to establish an appropriate feeding management program. And for proper aquaculture management, the feeding time and amount have to be set appropriately. Fish growth is influenced by a number of factors, such as feeding frequency, feed intake, feed type and feed ration. Hutson et al. (2013) have described that feeding rate was also a limiting factor for fish growth. Feeding frequency is one of the most important variables influencing growth performance and feed conversion ratio in aquaculture husbandry practices (Kim et al., 2007; Biswas et al., 2010; Lee and Pham, 2010).
Several studies have been conducted to evaluate the effect of feeding frequency on growth, survival, feed utilization and body composition in different fish species including Korean rock fish (Lee et al., 2000), yellowtail flounder (Dwyer et al., 2002), ayu (Cho et al., 2003); Atlantic halibut (Schnaittacher et al., 2005), Indian major carps (Biswas et al., 2006), tambaqui (Silva et al., 2007); Australian snapper (Booth et al., 2008), and pike perch (Wang et al., 2009).
The optimal feeding frequency improves fish growth, survival and feed conversion ratio, and also reduces size variation and environmental pollution (Tucker et al., 2006; Xie et al., 2011). Excessive feeding leads not only to reduction in feed conversion efficiency and increase in input cost, but also to accumulation of wastes that adversely affects the water quality deterioration. On the other hand, sporadic feeding frequency may lead to increase hunger, intra-specific aggression and increased rate of cannibalism (Folkvord and Ottera, 1993). All these problems result in decreased production efficiency and in increased cost of production (Booth et al., 2008). However, available data are limited concerning optimal feeding frequency with optimum water temperature to maximize growth in growing Korean rockfish. Therefore, the objective of this study was to determine the optimum feeding frequency in growing Korean rockfish rearing at the temperature of 15°C and 19°C.

MATERIALS AND METHODS

Experimental diet

Commercial extruded feed was used in the feeding trial which was supplied by Suhyup Feed Company Limited (Uiryeong, Gyeongsangnamdo, Republic of Korea). The extruded pellet size was 5 mm and the feed contained 52.95% crude protein, 12.14% crude lipid, 13.75% crude ash and 9.45% moisture.

Experimental fish and feeding trial

Growing Korean rockfish were collected from a hatchery of Tongyeong coastal city and they were transported to the Department of Fisheries Biology of Pukyong National University, Busan, Republic of Korea. Prior to start of the experiment, fish were acclimated with the experimental diet and conditions. After acclimatization, three aquaria were selected to determine the satiation. Fish were fed three times a day to apparent satiation for a week. For satiation, fish were fed as much as they could ingest at each feeding time. Feeding was done by hand very slowly and carefully to ensure ingestion of feed completely. Finally the remaining feed weight was subtracted from the initial weight and calculated as the percentage of satiation.
After the conditioning period, fifteen fish averaging 92.2±0.7 g (mean±standard deviation [SD]) at 15.0±0.5°C and 100.2±0.4 g (mean±SD) at 19.0±0.5°C water temperatures were randomly distributed into each of 15 indoor tanks. Each tank was then randomly assigned to one of three replicated groups. A total of five feeding frequency groups were set up as follows: one meal a day at 08:00 hour, two meals a day at 08:00 and 17:00 hours, three meals a day at 08:00, 14:00, and 20:00 hours, four meals a day at 08:00, 12:00, 16:00, and 20:00 hours, and one meal every 2 days at 08:00 hour. Fish were fed by the feeding rate at 1.2% body weight (BW)/d at 15°C and 1.5% BW/d at 19°C. The feeding trial was conducted in a semi-recirculation system with 250-L rectangular tank receiving filtered seawater (33.0±0.5 ppt) supplied at a flow rate of 5 L/min from the central tank. Supplemental aerations were provided to maintain dissolved oxygen levels near 6.5±0.5 mg/L. Seawater temperature was maintained at 19.0±0.5°C and 15.0±0.5°C by using water heater and cooling machine in the center tank during the whole experimental period. Photo period was fixed at a natural condition during the feeding period. Total body weight of fish in each tank was determined every 4 weeks, and the amounts of diet fed were adjusted accordingly to the increasing body weight in the trial. In order to maintain a good environmental condition siphoning was carried out twice a day and around 50% to 60% water was changed every 2 days from the recirculation system.

Sample collection and analyses

After 8 weeks of feeding trial, fish were kept starved for 24 h and they were counted and weighed. Weight gain (WG), specific growth rate (SGR), feed efficiency (FE), protein efficiency ratio (PER), survival and whole body proximate composition were measured and calculated. At the end of feeding trial, total length and total body weight were measured from five randomly selected fish from each tank. And those fish were anesthetized with MS222 at a concentration of 100 mg/L and fish were dissected and measured their liver and visceral weight to determine the biological indices such as condition factor (CF), hepatosomatic index (HSI), and visceral somatic index (VSI). Blood samples were taken by using a heparinized syringes from the caudal vein of five randomly chosen fish per tank and then blood analysis was performed to get some parameters. Blood serum was collected after centrifugation (3,000 rpm for 10 min) and stored at −70°C in order to analyze the hematocrit (HCT), hemoglobin (Hb), glutamic oxaloacetic transaminase (GOT) and glutamic pyruvic transaminase (GPT). The HCT and Hb were measured using the Drabkin’s reagent method (Brown, 1980). Blood serum analyses were performed by the National Fisheries Research and Development Institute (NFRDI), Gijang-Gun, Busan, Korea. NFRDI analyzed blood serum using the kits of DRI-CHEM 4000i- Fuji Dri-Chem Slide-3150 (Tokyo, Japan). Rest five fish from each tank were used to analyze the whole-body proximate composition. Proximate composition analyses of experimental diets and fish body were performed by the standard methods of AOAC (1995). To determine the moisture content a number of samples of diets and fish were dried to maintain constant weights at 105°C for 24 h. Ash content was determined using a muffle furnace (550°C for 4 h). Crude fat content was determined by the soxhlet extraction method by using Soxtec system 1046 (Foss, Hoganas, Sweden) and crude protein content by Kjeldahl method (N×6.25) after acid digestion.

Statistical analyses

All data were subjected to one-way analysis of variance (Statistics 3.1, Analytical Software, St. Paul, MN, USA). A least significant difference test was used to compare means amongst treatments with significant effects. Treatment effects were considered with the significant level at p<0.05. The data are presented as mean±standard error of the mean of the replicate groups (3 tanks per treatment).
The effects of feeding rates on growth performance and body composition were assessed by the following formulae:
Satiation (SA:%BW/d)=total feed weight (g)×100/total fish weight (g)WG rate=(final weight-initial weight)×100/initial weightSGR (%/d)=(Logefinal wt-Logeinitial wt)×100/daysFE (%)=wet WG (g)×100/dry feed intake (g)PER=wet WG/protein intakeCF=fish weight (g)×100/total length (cm3)HSI=liver weight (g)×100/fish weight (g)Visceralsomatic index=visceral weight×100/fish weight (g)Pooled SEM:pooled standard error of meansSurvival (%)=number of fish at end of experiment/number of fish stocked×100

RESULTS

Feeding frequency of 92 g Korean rockfish reared at 15°C

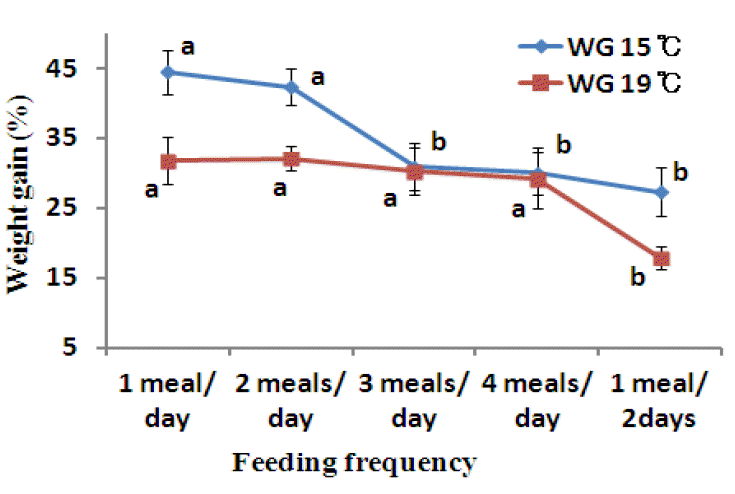
Weight gain, SGR, FE, and PER of fish, reared at 15°C water temperature are presented in Table 1. Weight gain was significantly affected by feeding frequency. At the end of 8 wks of feeding trial WG and SGR of fish groups of one meal a day and two meals a day were significantly higher than those of other fish groups (p<0.05). No significant differences were found in these parameters among the fish fed groups at 3 meals a day, 4 meals a day and 1 meal every 2 days. The FE and PER of fish fed 1 meal a day, 2 meals a day and 1 meal every two days were significantly higher than those fed 3 meals a day and 4 meals a day. There were no significant differences in FE and PER between fish groups fed 3 meals a day and 4 meals a day. Survival rate (SR) was not affected by feeding frequency.
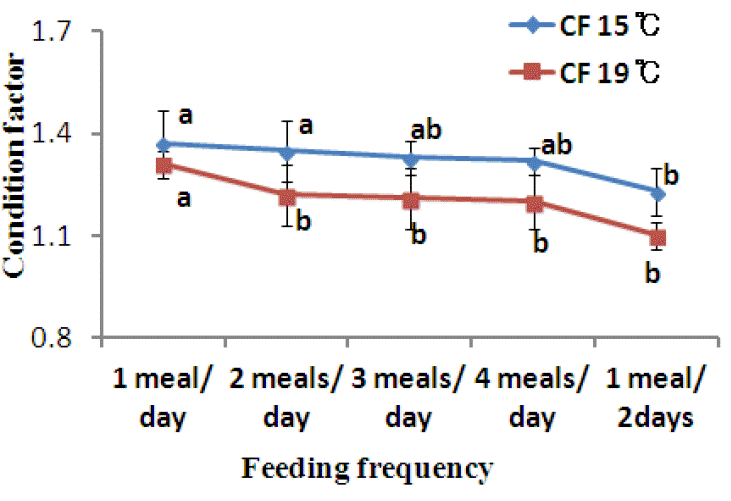
Morphological indices were significantly affected by feeding frequency (Table 1). Hepatosomatic index and VSI was significantly higher in 2 meals a day group and significantly lower in 1 meal every 2 days group. Condition factor in 1 meal a day and 2 meals a day groups were significantly higher than in all other fish groups. The CF was gradually decreased as feeding frequency increased from 2 to 4 meals a day. There were no significant differences in CF between the fish groups of 1 meal a day and 2 meals a day. And HSI had no any significant differences among the fish groups of 2 meals a day, 3 meals a day and 4 meals a day and it was significantly higher than other groups.
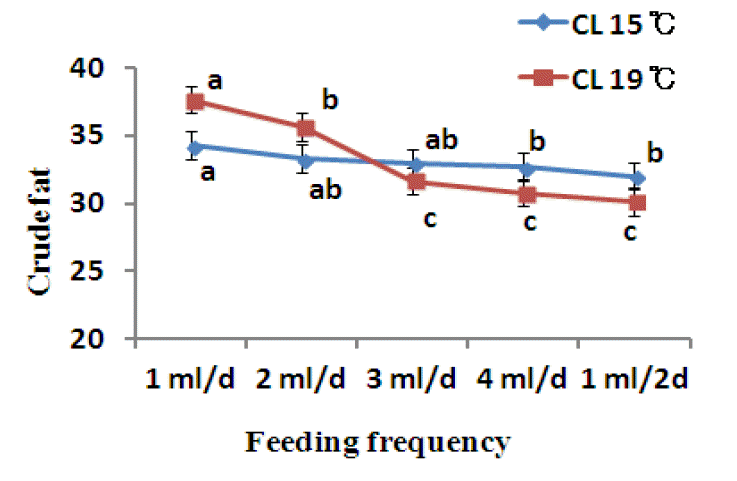
Whole body proximate compositions of rockfish are depicted in Table 2. Protein and fat contents were significantly higher in 1 meal a day and significantly lower in fish groups fed 4 meals a day and 1 meal every 2 days. An increase in feeding frequency resulted in a decrease in protein and fat (Figures 5 and 6). There was no significant difference in ash content at different feeding frequency. Whole-body moisture and crude ash content of fish were significantly higher at the group of 2 meals a day. And these parameters were comparatively lower at the group of 4 meals a day.
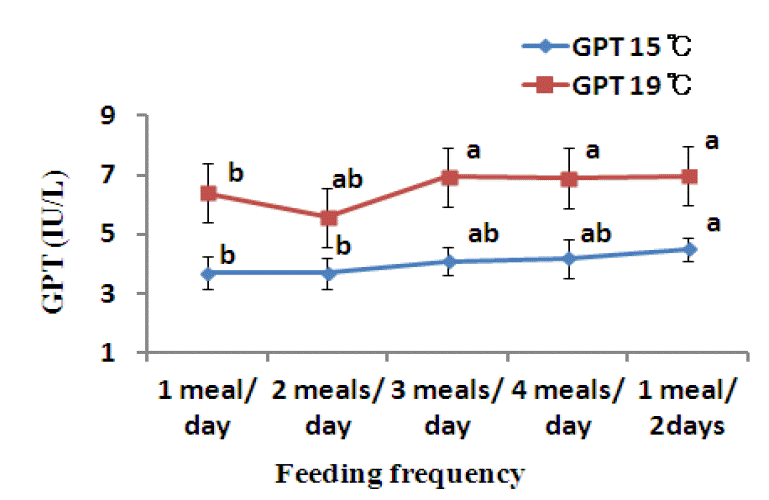
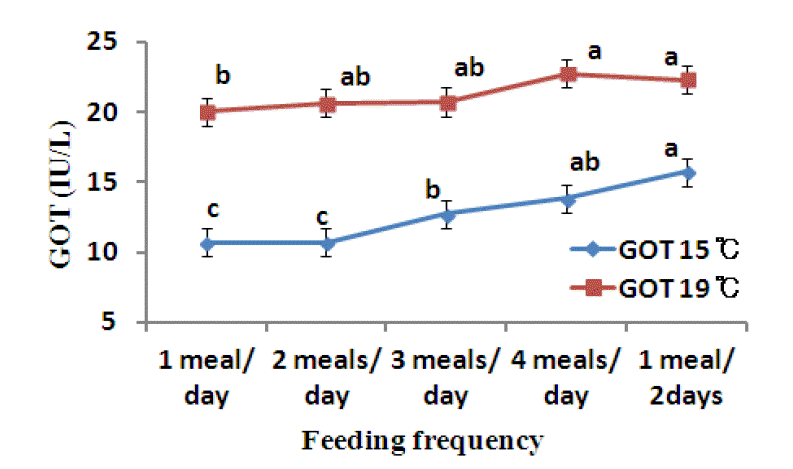
Effects of feeding frequency on serological characteristics of growing Korean rockfish, reared at 15°C water temperature are presented at Table 2. Hematocrit of fish fed group at 1 meal a day was significantly higher than other fish fed groups. There were no significant differences in HCT among the fish fed groups of 2 meals a day, 4 meals a day and 1 meal every 2 days. Hemoglobin had no any significant difference among all the fish fed groups. Glutamic oxaloacetic transaminase and GPT were significantly affected by feeding frequency. Serum GPT and GOT of fish fed group at 1 meal every 2 days was significantly higher and fish fed groups at 1 meal a day and 2 meals a day were significantly lower than all other fish fed groups. There was a clear trend in GPT and GPT with feeding frequency, because GOT and GPT were increased as the increasing of feeding frequency. There was no significant difference in GPT among the fish fed groups at 3 meals a day and 4 meals a day and also no significant difference in GOT was found among the fish fed groups at 1 meal a day, 2 meals a day.

Feeding frequency of 100 g growing Korean rockfish reared at 19°C

Weight gain and SGR, FE, PER of 100 g size of Korean rockfish, reared at 19°C water temperature are shown in Table 3. Weight gain was significantly affected by feeding frequency. At the end of 8 wks of feeding trial WG and SGR of fish fed group of one meal per two days was significantly lower than those of other fish fed groups (p<0.05). No significant differences were found in these parameters among fish fed groups at 1 meal a day, 2 meals a day, 3 meals a day and 4 meals a day. Feed efficiency and PER of fish fed group at 1 meal every 2 days were significantly higher than those of other fish fed groups. There were no significant differences in FE and PER at the fish fed groups of 1 meal a day, 3 meals a day and 4 meals a day. Survival rate was not affected by feeding frequency.
Effects of feeding frequency on morphological indices of 100 g size of Korean rockfish, reared at 19°C water temperature are shown in Table 3. Morphological indices were significantly affected by feeding frequency. Condition factor, HSI and VSI of fish fed group at 1 meal a day was significantly higher and at 1 meal every 2 days group was significantly lower of than those of other fish fed groups. There was a trend on morphological indices with feeding frequency because CF, HSI, and VSI were gradually decreased with the increasing of feeding frequency. There were no significant differences in HSI among the fish fed groups of 2 meals a day and 3 meals a day and also HSI did not express any significant differences among the fish fed groups of 3 meals a day, 4 meals a day and 1 meal every 2 days.
Whole-body proximate composition of growing Korean rockfish, reared at 19°C water temperature is presented at Table 4. Whole-body protein and lipid contents were significantly higher at 1 meal a day and it was significantly lower at the fish fed group of 4 meals a day. In the present study, there were clear trends with feeding frequency among whole-body crude protein and crude lipid because it was gradually decreasing with the increasing of feeding frequency from 1 to 4 meals a day. But this relation was not found in whole-body moisture and crude ash content of fish. On other hand, whole-body moisture at 3 meals a day and crude ash content at 2 meals a day were significantly lower than those of all other feeding frequency groups.
Effects of feeding frequency on serological characteristics of 100 g growing Korean Rockfish, reared at 19°C water temperature are depicted in Table 4. Hematocrit of fish fed group at 3 meals a day and Hb at 1 meal every 2 days were significantly higher than other fish fed groups. There were no significant differences in HCT among the fish fed groups of 1 meal a day and 4 meals a day and Hb was not found any significant difference among the fish fed groups of 3 meals a day and 1 meal every 2 days. Glutamic oxaloacetic transaminase and GPT were significantly affected by feeding frequency. There was a clear trend in GPT and GPT with feeding frequency, because GOT and GPT were increased as the increasing of feeding frequency. Serum GOT and GPT of fish fed group at 1 meal a day was significantly lower and it was significantly higher at the fish fed groups of 4 meals a day and 1 meal every 2 days. There was no significant difference of GOT among the fish fed groups at 2 meals a day and 3 meals a day and also no significant difference found in GPT among the fish fed groups at 3 meals a day, 4 meals a day and 1 meal a day and it was significantly higher.

DISCUSSION

In the present study, WG and SGR at 1 meal a day and 2 meals a day were significantly higher than all other fish feeding frequency groups in 15°C and at the fish fed group of 1 meal every 2 days was significantly lower in both 15 and 19°C experiments. Weight gain and SGR were gradually decreased with the increasing of feeding frequency in both experiments (Tables 1 and 3). Growth performance was comparatively higher at 15°C than 19°C experiment (Figure 1). Fish growth was not significantly enhanced by increasing the number of meals from 2 to 4 meals per day. Because when the feeding frequency high or the intervals between meals is short, the food passes through the digestive tract more quickly, resulting in less effective digestion. This agreement also well established with some previous research findings reported by Van Ham et al. (2003) and Biswas et al. (2010). Feed efficiency and PER of fish fed at 1 meal a day and 2 meals a day were significantly higher than fish fed groups of 3 meals a day and 4 meals a day. Because, fish tend to optimize their digestion to extract nutrients more efficiently at the optimum feeding rate (Van Ham et al., 2003). Feed consumption and growth increased linearly with an increase in the feeding frequency up to a certain level in juvenile black sea turbot (Aydin et al., 2011). Over-feeding not only reduces the feed conversion efficiency, but also accumulates lots of waste that adversely affects the water quality (Biswas et al., 2006). Our previous study described that after the optimum feeding, fish could not efficiently utilize additional feeds, leading to the drop in FE and PER in juvenile Korean rockfish (Mizanur and Bai, 2014; Mizanur et al., 2014a,b) and juvenile olive flounder (Okorie et al., 2013).
Hepatosomatic index, CSI, and CF may provide the information on growth, physical condition, energy reserves and ability of fish to tolerate the environmental stresses. In a poor, stressful and unfavorable environment, fish usually have a smaller liver which means less energy reserved in the liver. In the present study, morphological indices were significantly affected by feeding frequency. Condition factor, HSI and VSI were significantly higher at the group of 2 meals a day in 15°C and at 1 meal a day group in 19°C. On the other hand, CF and HSI were comparatively higher at 15°C than 19°C experiment (Figure 2; Tables 1 and 3). Condition factor, HSI and VSI were gradually decreased as the increasing of feeding frequency. It might be happened because of environmental pollution due to higher feeding frequency and fish could not able to digest properly all the feeds. Condition factor, HSI, and VSI at 1 meal every 2 days group was significantly lower than other fish fed groups in both experiments. Because, Korean rockfish was might be always hungry and under feeding stressed conditions. Oh et al. (2008) have described that HSI is a good compensatory growth index in juvenile black rockfish. On the other hand, HSI and CF of olive flounder could be indices reflecting the compensatory growth has been indicated by Cho (2012).
Whole-body proximate composition of Korean rockfish was determined to know the optimum feeding frequency at two different water temperatures. Whole-body protein and lipid contents were significantly higher at 1 meal per day and it was significantly lower at the fish fed group of 4 meals a day in both experiments. Crude protein and crude lipid were decreased as the increasing of feeding frequency. Van Ham et al. (2003) have got the same results in turbot fish. Lipid content of fish related to dietary energy level, indicating that excess dietary energy is not utilized by fish growth; it is deposited as lipid (Lee and Pham, 2010). On the other hand, less energy was used to compete for food and avoid cannibalism because of plentiful food at higher feeding frequency, so more protein and lipid were deposited in the fish body (Xie et al., 2011). In the present study, crude lipid and crude protein contents of fish fed group at 1 meal every 2 days was lower than other fish fed groups. Because lower feeding frequency distributed more energy to compete for limited food and to avoid cannibalism, which could accelerate the metabolism of protein and lipid.
In the present study, whole-body crude protein and crude lipid were gradually decreased as the increasing of feeding frequency in both experiments (Figures 5 and 6). But this study has been contrasted with some previous research findings such as; whole-body crude protein and crude lipid content were increased with the increasing of feeding frequency in juvenile red spotted grouper (Kayano et al., 1993) and juvenile Korean rockfish (Lee et al., 2000). These results were contrasted because those researchers were conducted their research with juvenile or larval stages of fish which have high digestive power. These findings also has been proved that for the optimum growth of juvenile or larval fish need higher frequency than growing or bigger size (NRC, 2011).
Plasma transaminase enzymes aspartate aminotransferase and alanine aminotransferase are formerly called GOT and GPT respectively. Serum GPT and GOT ratio provide useful information regarding the extent and causes of liver disease of olive flounder (Qiao et al., 2012). In the present study, serological characteristics of growing Korean rockfish were affected by different feeding frequencies. Serum GPT and GOT were increased with the increasing of feeding frequency in both experiments of 15°C and 19°C. In the present study, GPT and GOT were comparatively lower at 15°C than 19°C experiment (Figures 3 and 4). Environmental temperature is one of the most important ecological factors which also influence the behavior and physiological process of aquatic animals (Xia and Li, 2010). Glutamic pyruvic transaminase and GOT of fish fed group at 1 meal every 2 days was significantly higher and fish fed group at 1meal a day was significantly lower in both experiments. The reason for this observation may be attributed to the fact that Korean rockfish was might be always hungry and under feeding stressed conditions in 1 meal every 2 days group. Generally, in a stressful and unfavorable environmental condition GPT and GOT increase in blood serum. Serum GPT and GOT were gradually increased with the decreasing of feeding ration in juvenile Korean rockfish (Mizanur et al., 2014a,b) and olive flounder (Cho et al., 2007) due to the stress of under feeding condition.
The optimal feeding frequency for maximum growth of fish varies depending on fish species, sizes and culture conditions (Cho et al., 2003). Among them fish size is the most important factor to determine the optimum feeding frequency. Generally, matured fish need to be fed less frequently and at a lower amount of feed per feeding (NRC, 2011). In the present study there were no significant difference of WG among the fish fed groups at 1 meal a day, 2 meals a day, 3 meals a day and 4 meals a day and it was significantly higher than 1 meal every 2 days group. According to feed and labor cost 1 meal a day would be the optimum feeding frequency for growing Korean rockfish. Seo and Lee (2008) also found that WG of juvenile Korean rockfish fed to satiation once daily was higher than that of fish fed once every 2 days and twice-daily feeding. Feeding frequency of one meal a day till satiation is proper for the improvement of WG in juvenile Korean rockfish has been described by Lee et al. (2000).

CONCLUSION

In the conclusion, these studies demonstrate that a feeding frequency of 1 meal a day is optimum for the improvement of WG in 92 g and 100 g size growing Korean rockfish reared at 15°C and 19°C water temperatures respectively.

ACKNOWLEDGMENTS

The authors wish to thanks for the financial support from the National Fisheries Research and Development Institute (RP-2013-AQ-223), Republic of Korea. We would like to express our appreciation to all the students and staffs of the Feeds and Foods Nutrition Research Center (FFNRC) at Pukyong National University who collaborated in different ways while we were conducting our research.

Figure 1
Weight gain of rockfish with different feeding frequencies at 15°C and 19°C.
ajas-27-9-1319f1.gif
Figure 2
Condition factor of rockfish with different feeding frequencies at 15°C and 19°C.
ajas-27-9-1319f2.gif
Figure 3
Glutamic pyruvic transaminase of rockfish with different feeding frequencies at 15°C and 19°C.
ajas-27-9-1319f3.gif
Figure 4
Glutamic oxaloacetic transaminase of rockfish with different feeding frequencies at 15°C and 19°C.
ajas-27-9-1319f4.gif
Figure 5
Whole body crude protein of rockfish with different feeding frequencies at 15°C and 19°C.
ajas-27-9-1319f5.gif
Figure 6
Whole body crude fat of rockfish with different feeding frequencies at 15°C and 19°C.
ajas-27-9-1319f6.gif
Table 1
Biological performance and morphological indices of 92 g Korean rockfish, reared at 15°C water temperature
Items Feeding frequency

1 meal/day 2 meals/day 3 meals/day 4 meals/day 1 meal/2 days (SA1) p value Pooled SEM2
WG3 44.53a 42.36a 30.93b 29.96b 27.33b <0.05 2.13
SGR4 0.75a 0.72a 0.53b 0.52b 0.49b <0.05 0.03
FE5 81.55a 77.51a 55.75b 53.85b 81.89a <0.05 3.79
PER6 1.61a 1.53a 1.10b 1.06b 1.61a <0.05 0.07
FI7 50.5a 50.3a 49.5a 49.4a 30.7b <0.05 2.07
Survival8 100 100 100 100 100 > 0.05 0
Morphological indices
 CF9 1.37a 1.35a 1.33ab 1.32ab 1.23b <0.05 0.02
 HSI10 2.84b 3.06a 3.03a 2.93a 2.70c < 0.05 0.05
 VSI11 13.77b 14.35a 12.92ab 11.10c 11.31c <0.05 0.49

SA, satiation; Pooled SEM, pooled standard error of means; WG, weight gain; SGR, specific growth rate; FE, feed efficiency; PER, protein efficiency ratio; FI, feed intake; CF, condition factor; HSI, hepatosomatic index; VSI, Visceral somatic index.

1 SA (1.3%) = total feed weight (g)×100/total fish weight (g).

2 SD/n.

3 WG (%) = (final weight − initial weight)×100/initial weight.

4 SGR (%/d) = 100×(Loge final wt − Loge initial wt)/days.

5 FE (%) = wet weight gain (g)×100/dry feed intake (g).

6 PER = wet weight gain/protein intake.

7 FI = (final weight − initial weight)/feed efficiency.

8 Survival (%) = number of fish at end of experiment×100/number of fish stocked.

9 CF = fish weight (g)×100/total length (cm3).

10 HSI = liver weight (g)×100/fish weight (g).

11 VSI = visceral weight×100/fish weight (g).

Values are means from triplicate groups of fish where the values in each row with different superscripts are significantly different (p<0.05).

a, b, c Within a row, mean without a common letters (a, b, and c) differ (p<0.05).

Table 2
Whole-body proximate composition and serological characteristics of 92 g Korean rockfish, reared at 15°C water temperature
Items Feeding frequency

1 meal/day 2 meals/day 3 meals/day 4 meals/day 1 meal/2 days (SA1) p value Pooled SEM2
Crude protein 55.4a 55.2a 54.8ab 53.6b 53.4b <0.05 0.27
Crude lipid 34.3a 33.3ab 33.0ab 32.7b 32.0b <0.05 0.41
Crude ash 10.6 11.1 10.9 10.5 10.9 <0.05 0.15
Moisture 69.9b 72.4a 70.6ab 69.8b 70.0b <0.05 0.39
Serological characteristics
 HCT (%) 36.11a 35.10b 35.70ab 35.10b 35.11b <0.05 0.24
 Hb (g/dL) 6.80 6.93 6.80 6.57 6.23 > 0.05 0.18
 GOT (IU/L) 10.70c 10.70c 12.73b 13.83ab 15.72a <0.05 1.09
 GPT (IU/L) 3.70b 3.71b 4.10ab 4.20ab 4.50a <0.05 0.20

SA, satiation; Pooled SEM, pooled standard error of means; HCT, Hematocrit; Hb, hemoglobin; GOT, glutamic oxaloacetic transaminase; GPT, glutamic pyruvic transaminase.

1 SA (1.3%) = total feed weight (g)×100/total fish weight (g).

2 SD/n.

Values are means from triplicate groups of fish where the values in each row with different superscripts are significantly different (p<0.05).

a, b, c Within a row, mean without a common letters (a, b, and c) differ (p<0.05).

Table 3
Biological performance and morphological indices of 100 g Korean rockfish, reared at 19°C water temperature
Items Feeding frequency

1meal/day 2 meals/day 3 meals/day 4 meals/day 1meal/2 days (SA1) p value Pooled SEM2
WG3 31.82a 32.12a 30.33a 29.24a 17.87b <0.05 1.61
SGR4 0.52a 0.52a 0.50a 0.50a 0.31b <0.05 0.22
FE5 40.85b 41.94ab 39.45b 39.36b 43.14a <0.05 1.10
PER6 0.81ab 0.83ab 0.78b 0.78b 0.85a <0.05 0.02
FI7 78.1a 76.9ab 77.2ab 75.9b 41.6c <0.05 3.80
Survival8 100 100 100 100 100 >0.05 0
Morphological indices
 CF9 1.31a 1.22b 1.21b 1.20b 1.10b <0.05 0.03
 HSI10 2.78a 2.68ab 2.66ab 2.58b 2.37c <0.05 0.17
 VSI11 10.83a 10.39ab 10.18b 10.13b 10.12b <0.05 0.37

SA, satiation; Pooled SEM, pooled standard error of means; WG, weight gain; SGR, specific growth rate; FE, feed efficiency; PER, protein ratio; FI, feed intake; CF, condition factor; HSI, hepatosomatic index; VSI, Visceral somatic index.

1 SA (1.5%) = total feed weight (g)×100/total fish weight (g).

2 SD/n.

3 WG (%) = (final weight − initial weight)×100/initial weight.

4 SGR (%/d) = 100× (Loge final wt − Loge initial wt)/days.

5 FE (%) = wet weight gain (g)×100/dry feed intake (g).

6 PER = wet weight gain/protein intake.

7 Feed intake = (final weight − initial weight)/feed efficiency.

8 Survival (%) = number of fish at end of experiment×100/number of fish stocked.

9 CF= fish weight (g)×100/total length (cm3).

10 HSI = liver weight (g)×100/fish weight (g).

11 VSI = visceral weight×100/fish weight (g).

Values are means from triplicate groups of fish where the values in each row with different superscripts are significantly different (p<0.05).

a, b, c Within a row, mean without a common letters (a, b, and c) differ (p<0.05)

Table 4
Whole-body proximate composition and serological characteristics of 100 g Korean rockfish, reared at 19°C water temperature
Items Feeding frequency

1 meal/day 2 meals/day 3 meals/day 4 meals/day 1 meal/2 days (SA1) p value Pooled SEM2
Crude protein 54.74a 54.12a 52.71b 52.64b 51.12c <0.05 0.33
Crude lipid 37.63a 35.63b 31.65c 30.76c 30.12c <0.05 0.94
Crude ash 12.52a 10.80c 12.92a 11.00b 11.40ab <0.05 0.63
Moisture 67.62ab 68.11a 66.81b 68.92a 68.41a <0.05 0.32
Serological characteristics
 HCT (%) 33.92c 35.56b 36.51a 33.82c 35.83b <0.05 0.83
 Hb (g/dL) 7.90b 8.11b 8.50a 7.90b 8.80a <0.05 0.19
 GOT (IU/L) 20.03b 20.64ab 20.72ab 22.76a 22.32a <0.05 0.48
 GPT (IU/L) 6.40b 6.57ab 6.93a 6.90a 6.97a <0.05 0.19

SA, satiation; Pooled SEM, pooled standard error of means; HCT, Hematocrit; Hb, hemoglobin; GOT, glutamic oxaloacetic transaminase; GPT, glutamic pyruvic transaminase.

1 SA (1.3%) = total feed weight (g)×100/total fish weight (g).

2 SD/n.

Values are means from triplicate groups of fish where the values in each row with different superscripts are significantly different (p<0.05).

a, b, c Within a row, mean without a common letters (a, b, and c) differ (p<0.05)

REFERENCES

AOAC. 1995. Official Methods of Analysis. 16th ednAssociation of Official Analytical Chemists; Arlington, VA, USA:

Aydin I, Kucuk E, Sahin T, Kolotoglu L. 2011. The effect of feeding frequency and feeding rate on growth performance of juvenile Black Sea Turbot, Psetta maxima (Linneaus, 1758). J Fishscicom 5:35–42.

Bai SC, Okorie OE. 2009. Marine fish. Korean Rockfish (Sebastes schlegeli) Production in Korea. Global Aquaculture Advocate 41–42.

Biswas G, Jena JK, Singh SK, Patmajhi P, Muduli KK. 2006. Effect of feeding frequency on growth, survival and feed utilization in mrigal (Cirrhinus mrigala) and rohu (Labeo rohita) during nursery rearing. Aquaculture 254:211–218.
crossref
Biswas G, Thirunavukkarasu AR, Sundaray JK, Kailasam M. 2010. Optimization of feeding frequency of Asian seabass (Lates calcarifer) fry reared in net cages under brackishwater environment. Aquaculture 305:26–31.
crossref
Bjornsson B, Steinarsson A, Arnason T. 2007. Growth model for Atlantic cod (Gadus morhua): Effects of temperature and body weight on growth rate. Aquaculture 271216–226.

Booth MA, Tucker BJ, Allan GL, Fielder D. 2008. Effect of feeding regime and fish size on weight gain, feed intake and gastric evacuation in juvenile Australian snapper (Pagrus auratus). Aquaculture 282:104–110.
crossref
Brown BA. 1980. Routine hematology procedures. Hematology: Principles and Procedures. Lea , Febiger , editorsLea and Febiger Co; Philadelphia, USA: p. 71–112.

Cho SH, Lim YS, Lee JH, Park S, Lee SM. 2003. Effect of feeding rate and feeding frequency on survival, growth, and body composition of Ayu post-larvae Plecoglossus altivelis. J World Aquac Soc 34:85–91.
crossref
Cho SH, Lee SM, Park BH, Ji SC, Choi CY, Lee JH, Kim YC, Lee JH, Oh SY. 2007. Effect of daily feeding ratio on growth and body composition of subadult olive flounder, Paralichthys olivaceus, fed an extruded diet during the summer season. J World Aquac Soc 38:68–73.
crossref
Cho SH. 2012. Effects of dietary nutrient on the biological index and serum chemistry of juvenile Olive flounder Paralichthys olivaceous achieving compensatory growth. Fish Aquat Sci 15:69–72.

Dwyer KS, Brown JA, Parrish C, Lall SP. 2002. Feeding frequency affects food consumption, feeding pattern and growth of juvenile yellowtail flounder (Limanda ferruginea). Aquaculture 213:279–292.
crossref
Folkvord A, Ottera H. 1993. Effects of initial size distribution, day length, and feeding frequency on growth, survival and cannibalism in juvenile Atlantic cod (Gadus morhua). Aquaculture 114:243–260.
crossref
Gardeur JN, Mathis N, Kobilinsky A, Brun-Bellut J. 2007. Simultaneous effects of nutritional and environmental factors on growth and flesh quality of Perca fluviatilis using a fractional factorial design study. Aquaculture 273:50–63.
crossref
Hutson AM, Toya LA, Tave D. 2013. Effect of High Stocking Rates on Growth and Survival of the Endangered Rio Grande Silvery Minnow Hybognathus marus. Fish Aquat. Sci 16:285–290.

Kayano Y, Yao S, Yamamoto S, Nakagawa H. 1993. Effects of feeding frequency on the growth and body constituents of young red-spotted grouper, Epinephelus akaara. Aquaculture 110:271–278.
crossref
Kim KD, Kang YJ, Kim KW, Kim KM. 2007. Effects of feeding rate on growth and body composition of juvenile flounder. J World Aquac Soc 38:169–173.
crossref
Lee SM, Hwang UG, Cho SH. 2000. Effects of feeding frequency and dietary moisture content on growth, body composition and gastric evacuation of juvenile Korean rockfish (Sebastes schlegeli). Aquaculture 187:399–409.
crossref
Lee SM, Pham MA. 2010. Effects of feeding frequency and feed type on the growth, feed utilization and body composition of juvenile olive flounder (Paralichthys olivaceus). Aquac. Res 41:e166–e171.
crossref
Mizanur RM, Bai SC. 2014. A review of the optimum feeding rates and feeding frequency in Korean rockfish (Sebastes schlegeli) reared at seven different water temperatures. Fish Aquat Sci 17:1–19.
crossref
Mizanur RM, Park G, Yun HH, Lee S, Choi S, Bai SC. 2014a. The effects of feeding rates in juvenile Korean rockfish (Sebastes schlegeli) reared at 17°C and 20°C water temperatures. Aquacult Int 22:1121–1130.
crossref
Mizanur RM, Yun HH, Moniruzzaman M, Ferreira F, Kim KW, Bai SC. 2014b. Effects of feeding rate and water temperature on growth and body composition of Juvenile Korean Rockfish, Sebastes schlegeli (Hilgendorf 1880). Asian Australas J Anim Sci 27:690–699.
crossref pmid pmc
Moore RK, Scott AP, Collins PM. 2000. Circulating C-21 steroids in relation to reproductive condition of a viviparous marine teleost, Sebastes rastrelliger(grass rockfish). Gen Comp Endocrinol 117:268–280.
crossref pmid
NRC. 2011. Nutrient Requirements of Fish and Shrimp. National Academies Press; NY, USA:

Oh SY, Noh CH, Kang RS, Kim CK, Cho SH, Jo JY. 2008. Compensatory growth and body composition of juvenile black rockfish Sebastes schlegeli following feed deprivation. Fish Sci 74:846–852.
crossref
Okorie OE, Bae JY, Kim KW, Son MH, Kim JW, Bai SC. 2013. Optimum feeding rates in juvenile olive flounder, Paralichthys olivaceu s, at the optimum rearing temperature. Aquac Nutr 19:267–277.
crossref
Park IS, Kim CH, Choi JW. 2012. Histological observations and regeneration of barbles in juveniles of the Chinese Longsnout catfish Leiocassis longirostris. Fish Aquat Sci 15:299–303.

Person-Le RJ, Buchet V, Vincent B, Le DH, Quemener L. 2006. Effects of temperature on the growth of pollack (Pollachius pollachius) juveniles. Aquaculture 251:340–345.
crossref
Qiao G, Park SI, Xu DH. 2012. Clinical, hematological and biochemical alterations in Olive flounder Paralichthys olivaceus following experimental infection by Vibrio scophthalmi. Fish Aquat Sci 15:233–239.
crossref
Schnaittacher G, King WV, Berlins DL. 2005. The effects of feeding frequency on growth of juvenile Atlantic halibut (Hippoglossus hippoglossus). Aquac Res 36:370–377.
crossref
Silva CR, Gomes LC, Brandao FR. 2007. Effect of feeding rate and frequency on tambaqui (Colossoma macropomum) growth, production and feeding costs during the first growth phase in cages. Aquaculture 264:135–139.
crossref
Seo JY, Lee S-M. 2008. Effects of dietary macronutrient level and feeding frequency on growth and body composition of juvenile rockfish (Sebastes schlegeli). Aquacult Int 16:551–560.
crossref
Tucker BJ, Booth MA, Allan GL, Booth D, Fielder DS. 2006. Effects of photoperiod and feeding frequency on performance of newly weaned Australian snapper, Pagrus auratus. Aquaculture 258:514–520.
crossref
Van Ham EH, Berntssen MHG, Imsland AK, Parpoura AC, Wenderlaar BSE, Stefansson SO. 2003. The influence of temperature and ration on growth, feed conversion, body composition and nutrition retention of juvenile turbot (Scohthalmus maximus). Aquaculture 217:547–558.
crossref
Wang N, Xu X, Kestemont P. 2009. Effect of temperature and feeding frequency on growth performances, feed efficiency and body composition of pikeperch juveniles (Sander lucioperca). Aquaculture 289:70–73.
crossref
Xia J, Li X. 2010. Effect of temperature on blood parameters of the salamander Batrachupems tibetanus (Schmidt, 1925) (Amphibia: Hynobiidae). Russian J Ecol 41:102–106.
crossref
Xie F, Ai Q, Mai K, Xu W, Ma H. 2011. The optimal feeding frequency of large yellow croaker (Pseudosciaena crocea, Richardson) larvae. Aquaculture 311:162–167.
crossref


Editorial Office
Asian-Australasian Association of Animal Production Societies(AAAP)
Room 708 Sammo Sporex, 23, Sillim-ro 59-gil, Gwanak-gu, Seoul 08776, Korea   
TEL : +82-2-888-6558    FAX : +82-2-888-6559   
E-mail : editor@animbiosci.org               

Copyright © 2024 by Asian-Australasian Association of Animal Production Societies.

Developed in M2PI

Close layer
prev next